 Copyright © Michael Richmond.
This work is licensed under a Creative Commons License.
Today, we're going to look at the issue of "flatfield images". What are they, and why do we need to take them? What can we do with them?
The images for today's exercises can be found in the $dd/sep20_2003 directory. Make sure that you make copies of all these images in your own directory. So, after you log in, you might execute these commands, which

When you have reached this point, please pause, and look around. If someone nearby is having problems, please help him or her to reach this point.
Today, let's take another look at one of the "target images" take on Sep 20, 2003. Make sure that you have a fresh copy of the file v585.fit in your directory.
Astronomers typically display images in an inverted mode, so that stars appear as black objects on a white background. It's easier to pick out very faint detail that way. So, display the target frame like so:
tv v585.fit z=900 l=1000 invert
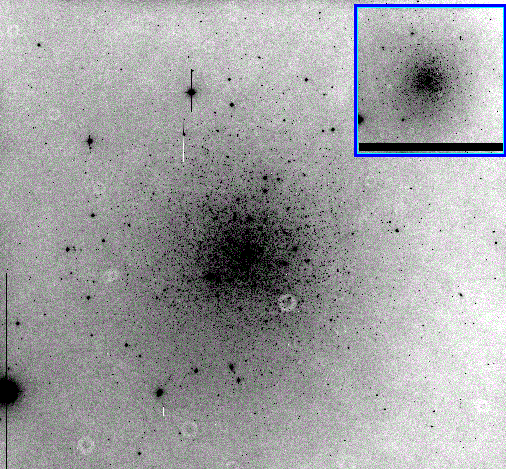
It should look like this:
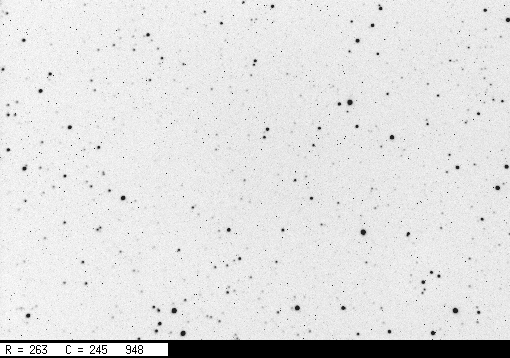
Hmmm. There are lots of hot pixels, but we know how to get rid of them. Is there anything ELSE wrong with the image?
Display the image again, this time with a much smaller range, l = 100 instead of l = 1000. This will enhance very subtle features in the background.
tv v585.fit z=900 l=100
Note that you don't need to (and shouldn't) provide the invert
keyword this time; the tv command remembers the display
mode and keeps using the last one you specified.
When you reach this point, stop and look around. If someone nearby hasn't reached here yet, offer to help. If someone nearby has reached this point, too, then discuss your answers.
The problem is that some (all?) instruments are imperfect. When I write "instruments", I mean the combination of optics and detector. Several different problems commonly cause variations in sensitivity across the focal plane; if those variations are not corrected, they end up as errors in the measured magnitudes of stars and other celestial sources.
The three main culprits are
Here's an example: a raw I-band image taken by one of the TASS Mark IV cameras . The field of view is very large, about 4 degrees on a side.
You can download and examine the image itself, if you wish. Be careful, though: it's a big image, roughly 2048x2048, so if you want to see the whole thing, you'll need to use zoom=0.25 as part of your tv command.

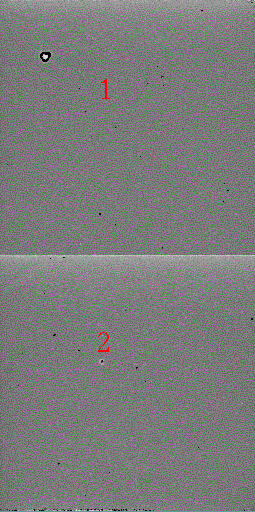
Some CCDs may have been nearly perfect when first made, but, over the years, have accumulated layers of oil, grease, or other contaminants. Little specks of dirt and dust can also sit on the chip, blocking most of the light from reaching the pixels below. Here are a couple of closeups of quadrants 1 and 2 of the Dandicam CCD camera.
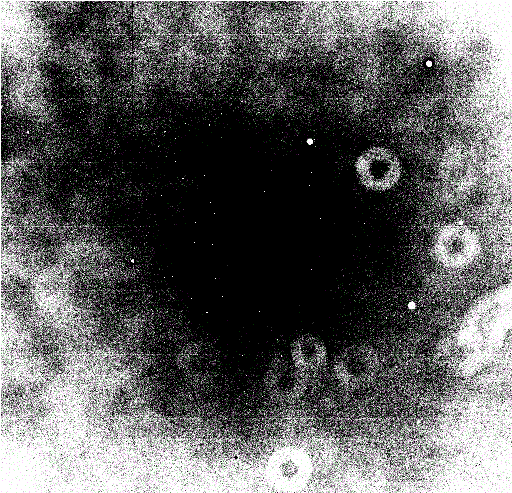
and the 1-m telescope at Las Campanas in Chile:
The problem boils down to this imagine a very simple CCD, consisting of just two pixels. Suppose that the pixel on the left is a bit less sensitive than that on the right. I point my camera at a blank white wall. I ought to see this:
             left pixel              right pixel
           --------------         ----------------
              100 counts             100 counts
But instead, the CCD actually records this:
             left pixel              right pixel
           --------------         ----------------
                95                      100
Evidently, the left-hand pixel is slightly less sensitive to light, by 5 percent. This is a problem if we're trying to make precise measurements of stellar brightness. Suppose I look at two stars, A and B, which are really the same brightness. But if star A falls on the left-hand pixel, and star B on the right-hand pixel, I won't see that; instead, I will measure fewer counts from star A:
              star A                   star B
           --------------         ----------------
               9,500                   10,000
Sure! It's not too hard, either. All I need to do is divide each pixel's measured value by its relative sensitivity, like this:
              star A                   star B
           --------------         ----------------
 measured      9,500                   10,000

            divided by              divided by

 relative
 sensitivity     0.95                    1.00

            ===========             ============

  corrected   10,000                   10,000
So, the theory of "flatfields" goes like this:
There are a few complications:
                 uncertainty = 1.0 / sqrt(100)

                             =  0.1   =  10 percent
If you want to do work at the 1 percent level,
you need to gather roughly 10,000 electrons
in each pixel of the flatfield image.
It's a bit more complicated than this, but a good rule of thumb is "take flatfield images which are around 1/4 to 1/2 of the saturation level." For the RIT cameras, anywhere between 10,000 and 20,000 counts per pixel is pretty good.
Fortunately, this is easy to fix: just take a set of dark frames with the same exposure time as your flatfield images, create a master dark, and subtract that master dark from all flatfield frames before any further processing.
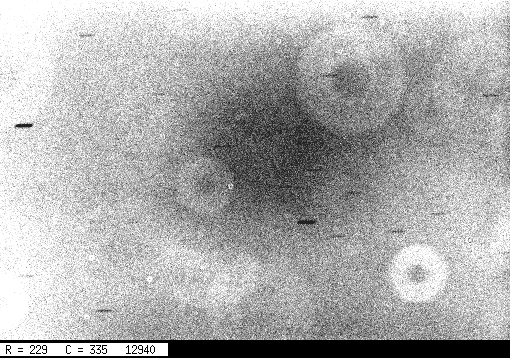
The short horizontal streaks are due to stars which were bright enough to appear above the relatively bright sky level. They are trailed because the telescope's tracking was turned off (oops).
Again, there is a relatively simple solution: take a number (10 or more) of flatfield images, and (after subtracting the master dark from each one) create a "master flat" by taking the median of the set, on a pixel-by-pixel basis.
Okay, so give it a try. Do the following:
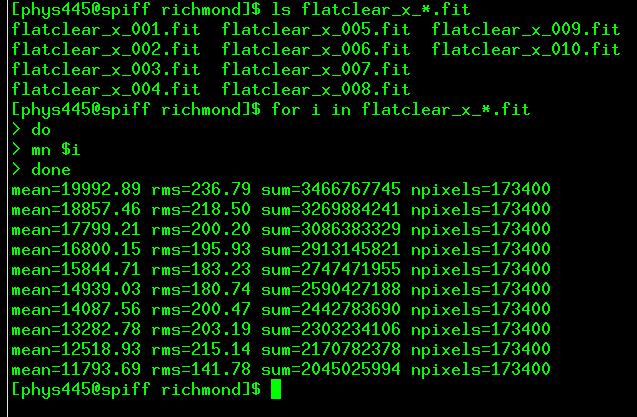
Notice that the mean level in each image decreases through the sequence. The sky was getting darker as I was taking these images. If we tried to compute a median value for one particular pixel -- say, (100, 100) -- from these images in their current state, we'd have a problem: that pixel would always be brightest in the the first image, and faintest in the last image, just because the average light level is highest in the first image.
median flatclear_x_*.fit outfile=master_flat.fit verbose
The median command will first re-scale all the flatfield images so that they have the same average value; only then will it look at each pixel to pick the middle value from the entire set of images. In order to do this re-scaling properly, the median program uses the results of the mn commands you ran earlier.
mn master_flat.fit
to compute the average value of pixels in the "master flat"; we'll
need that later ...
Now, with both a "master dark" image, and a "master flat" image, you are ready to reduce the raw target image of V585 Lyrae. This is the same procedure you'll use on your own target images.
cp v585.fit v585_raw.fit
median dark30*.fit outfile=master_dark_30.fit
div v585.fit master_flat.fit flat
Don't forget the final keyword flat
at the end of this command!
If all went well, you should see faint defects in the raw image -- variations in the background level from center to corners, and dust donuts -- but no such defects in the processed version. Did it work?
 Copyright © Michael Richmond.
This work is licensed under a Creative Commons License.