 Copyright © Michael Richmond.
This work is licensed under a Creative Commons License.
Copyright © Michael Richmond.
This work is licensed under a Creative Commons License.
So -- you've measured the instrumental magnitudes of some stars in a bunch of CCD images. What can you conclude? Do these instrumental magnitudes tell you directly about variations in each star's luminosity?
(Alas, no. Read on)
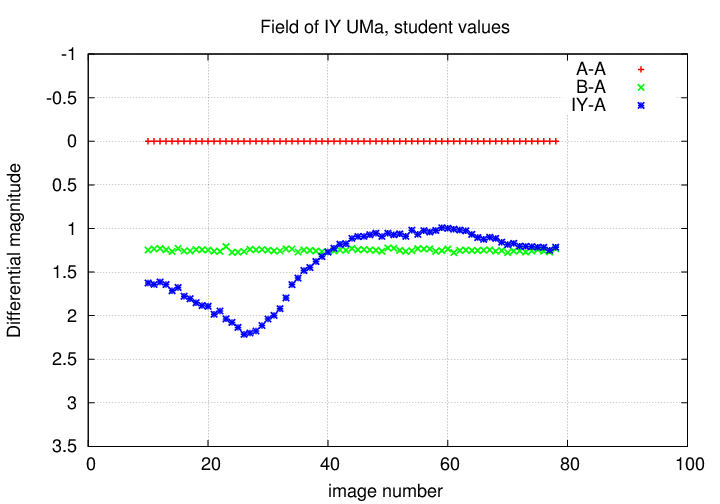
Each student in the class was given 10 images from a set of about 80. Students measured the instrumental magnitudes of the stars marked A, B and IY in their sets of 10, using -- in some cases -- somewhat different aperture sizes. I collected these measurements and placed them all onto a single graph, shown below.
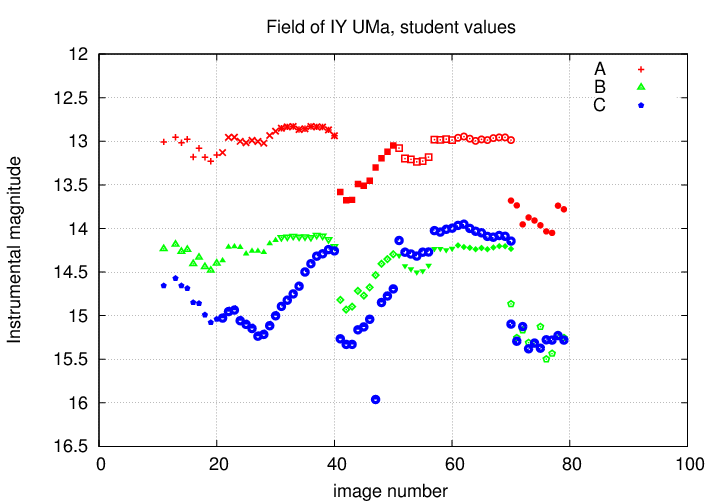
Wow! This looks, um, quite exciting. All three stars appear to change in brightness, by a magnitude or more. Golly! Is this really happening?
Well, no. One of the complications is that two of the students chose much smaller apertures to measure the light from the stars. The typical aperture radius was about 3 or 4 pixels, but in two cases, the radius was only about 1.5 pixels.
  Q:  Each student measured 10 images: 11-20, 21-30,
      and so forth, up to 71-80.

      Can you guess which two sets of 10 images
      were measured through a smaller aperture?
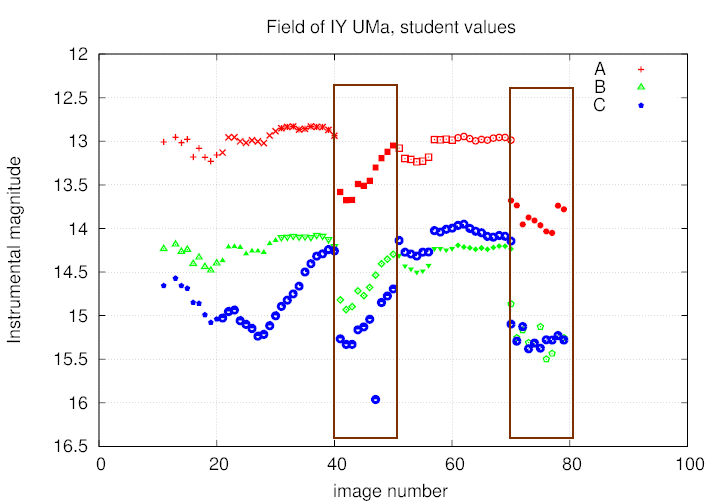
Right -- the students measuring images 41-50 and 71-80 chose smaller apertures; as a result, their instrumental magnitude measurements have systematic differences from all the other measurements. Astronomers who work in teams -- and even those who work alone -- must be careful to avoid this sort of mistake in their data analysis.
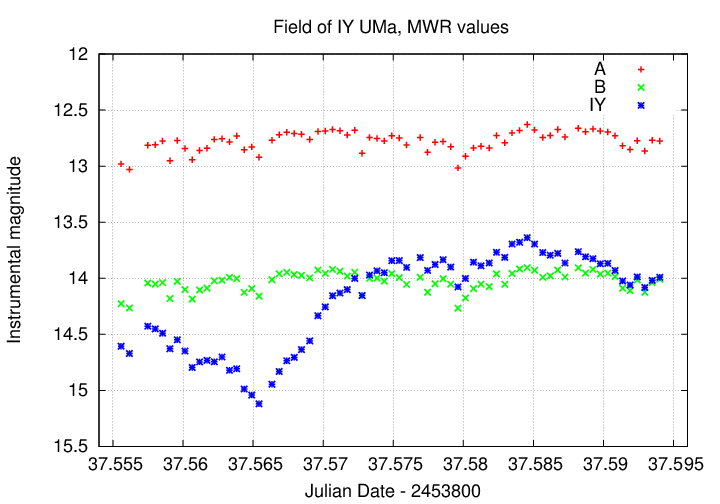
So, to make things homogeneous, I went through the entire dataset myself and measured all stars using a single aperture radius: 4 pixels. Here are my instrumental magnitudes for the three stars:
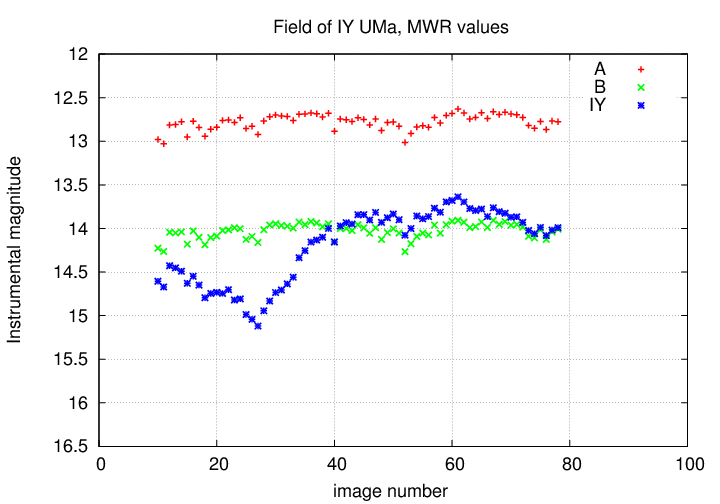
  Q:  All three stars show similar small-scale
      variations.  Does this mean that all
      three were pulsing or eclipsing in sync?
No -- these three stars may appear to be close together in the sky, as seen from our vantage point on Earth, but they are really very far away from each other. It would be very, very improbable for all of them to have intrinsic variations of roughly the same amplitude, and same period, and same phase.
  Q:  So what is going on?  Why do all three stars
      show those same small fadings and brightenings?
Yes, that's right: the answer is that the stars aren't really varying -- it's just the Earth's atmosphere which is changing. As clouds come and go, the light from all the stars in this field is blocked equally, so all stars fade and brighten simultaneously and by the same amount.
  Q:  Is there any way for us to remove the effects
      of variations in the transparency of the atmosphere?
The cure for this symptom is to pick one star as a reference, and calculate the difference between this star and every other star in the field. For example, if you were to pick star "A" as a reference, you would calculate
(A - A) (B - A) (IY - A)
for each image. Then, instead of plotting the raw
magnitude versus image index number (or time)
to make a raw light curve,
plot the differential magnitude
versus image index (or time).
All the common patterns should disappear -- as long
as you picked a good reference star --
leaving only the instrinsic changes of each star.
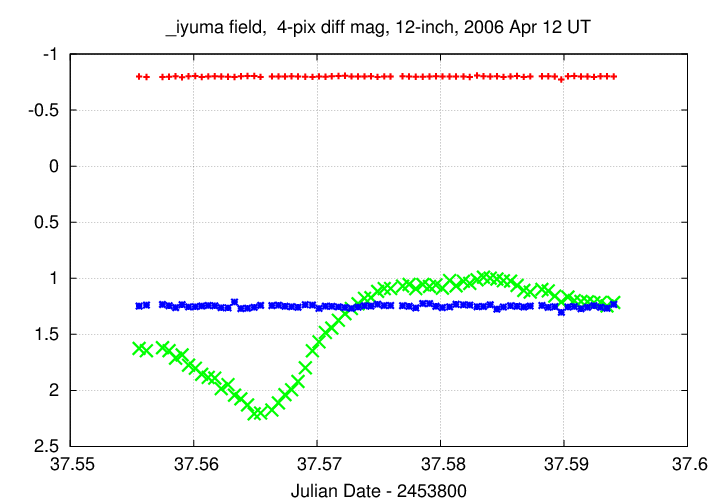
Ta-da! We can now see that the apparent variation in the brightness of stars A and B was NOT intrinsic, but due to changes in the Earth's atmosphere. On the other hand, the star labelled IY really DOES seem to be changing in brightness.
This idea of differential measurements is a very powerful one. We astronomers use it frequently, but so do other people: physicists, chemists, biologists, electrical engineers -- the list goes on and on. We all suffer from systematic problems with the environment, or our instruments, or both. By looking simultaneously at several sources, some of which are known (or thought) to be constant, we can remove these spurious variations and isolate the true signal.
In our example, we compared all sources to a single star: star A. Our analysis assumes that this star was NOT varying over the course of the night.
  Q:  How do we know that star A wasn't really growing
      brighter or dimmer over the course of these images?

      Is there any evidence for that assumption?
Well, there is one good clue: when we computed the difference (B-A), we found that it remained very nearly constant throughout the entire period. That means either
It is far more likely that the first possibility is true ... but it's not certain.
  Q:  Is there something we could do to provide more
      evidence that star A isn't really varying?
Yes -- we could include more stars in our comparison. If we measure the difference between stars A, and B, and C, and D, and E, etc., etc., etc., and we still see that those differences are constant, then the options become
The technique of including LOTS of stars as comparisons is called ensemble photometry, since one is creating an "ensemble" of sources to use as a reference. The mathematics involved in comparing many stars to each other, all at once, is somewhat complicated. Fortunately, astronomer R. Kent Honeycutt explained very clearly how one can perform this analysis, even if some of the stars fall off the edges of some of the images, or disappear behind thick clouds.
In my own work over the years, I have found this technique very, very useful. So useful, in fact, that I wrote a software package to perform ensemble photometry on a set of datafiles derived from CCD images. I'd be happy to discuss the technique with any students whose projects involve the repeated measurements of stars in some area.
Suppose we do apply the ensemble photometry technique to these images of IY UMa and the stars nearby. What are the results? You can read a report on the RIT Observatory web site
but, in brief, one thing that we learn is that the transparency of the sky varied quite a bit over the course of the observations. In the graph below, larger image adjustment factors mean "clouds were thicker":
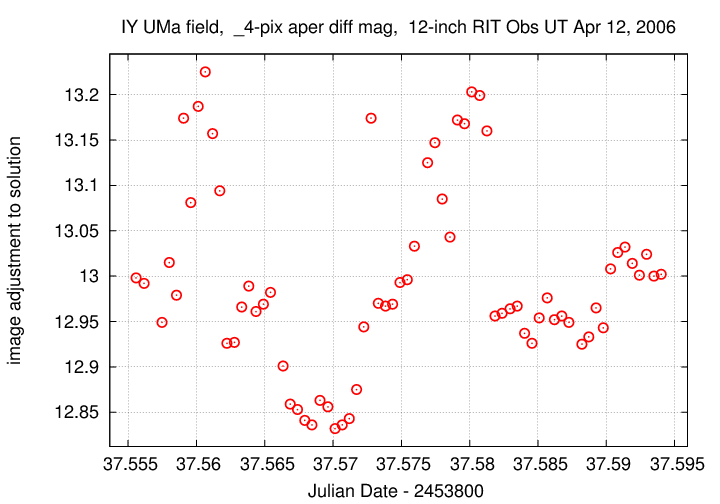
See how well these variations correlate with the changes in the raw instrumental magnitudes?
Once we remove these common variations due to the Earth's atmosphere, we can compute the average differential magnitude of each star, and its scatter around that mean value. Look on the graph below: what do you see?
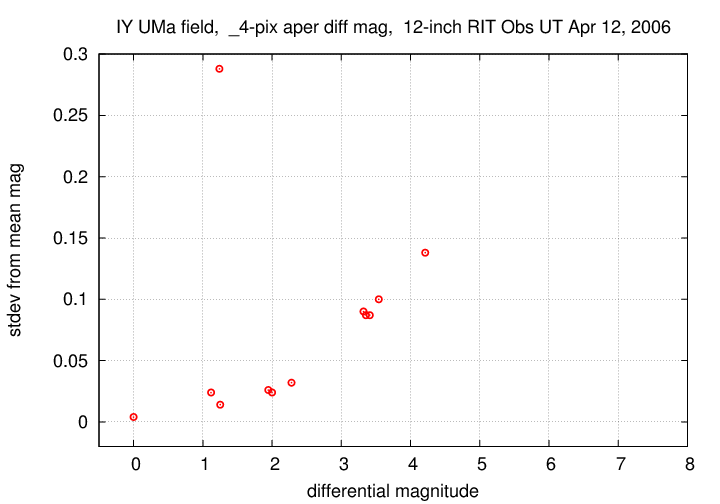
Yes, that's right: bright stars have relatively small scatter from their mean value, and faint stars have larger scatter. That's the general trend .... but one object doesn't follow the trend. One star appears to be bright, and yet has a big scatter around its average value.
Q: What's happening with that one star?
Answer: it's varying in intrinsic brightness -- strongly!
Copyright © Michael Richmond.
This work is licensed under a Creative Commons License.