 Copyright © Michael Richmond.
This work is licensed under a Creative Commons License.
Copyright © Michael Richmond.
This work is licensed under a Creative Commons License.
Suppose you have tens or hundreds of images of the same field, and you want to combine them to create a deeper, more detailed image. Do you have to display one image at a time, point at a bright star manually, write down the coordinates, and go on to the next one ... and then type hundreds of imshift commands? Well, you could --- but there is a better way to deal with this large volume of data. You can use a set of Perl scripts I wrote to perform these repeated tasks in a relative jiffy.
You need to provide a set of cleaned images. This little tutorial will show you the basic steps:
         shift_sum.fit         sum of all the aligned images
         shift_median.fit      pixel-by-pixel median of all the aligned images
Each of the scripts mentioned in this tutorial can be found in the directory $dd/scripts. You should copy each script into the same directory as your FITS image files before you try to use them. For example,
cp $dd/scripts/stars.pl .
Each script contains a few lines at the beginning which you will need to edit -- in order to describe the files you'd like to analyze, for example, or to modify one of the major parameters of the procedure. However, you should not (usually) need to make any changes to the code after this initial section. If you think it IS necessary, please talk to me for help.
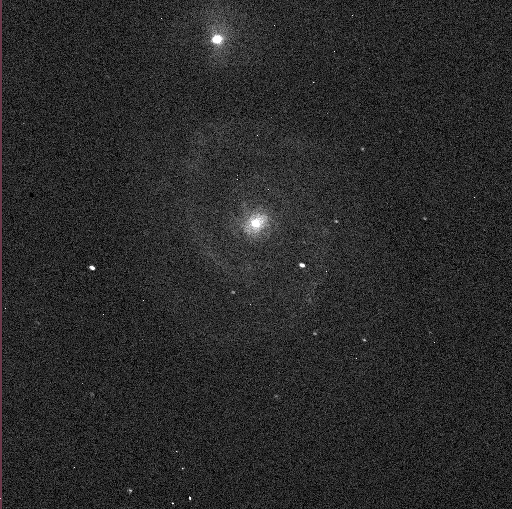
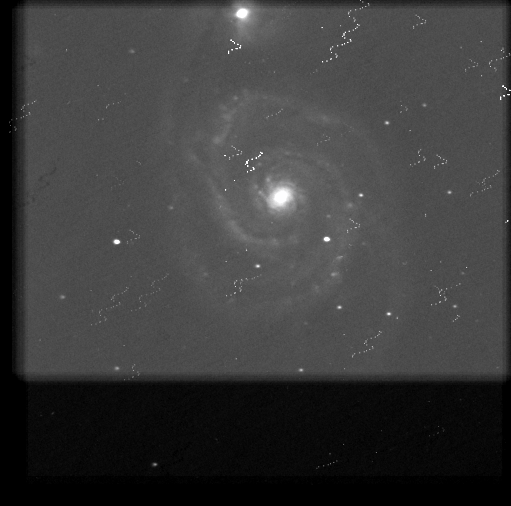
In this tutorial, I'll start with 41 images of the galaxy M51. Each image is just 31.5 seconds long, taken in the V-band with the RIT Observatory's 12-inch telescope. Here's one example:
The script stars.pl looks through a list of astronomical images, identifies the stars in each one, and measures each star's position and brightness.
The start of this script looks like this:
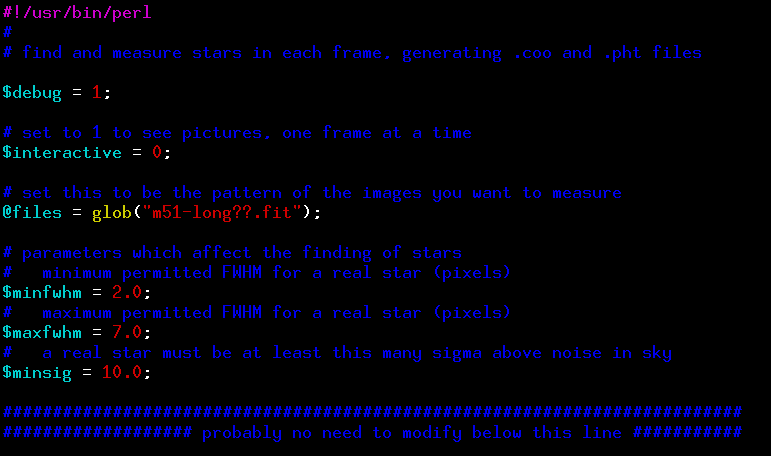
You will certainly have to modify the line with @files so that it describes the files you wish to analyze. All of the files should be in the same directory as this script.
To run this script, simply type at the command line
perl stars.pl
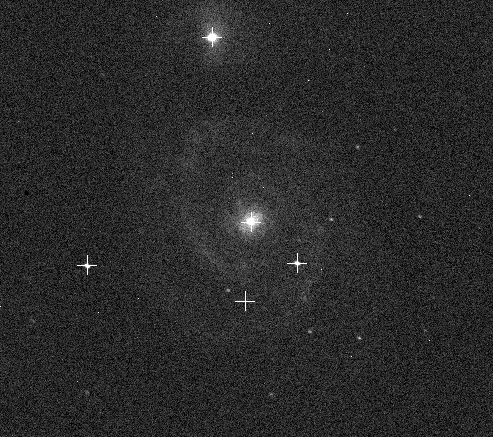
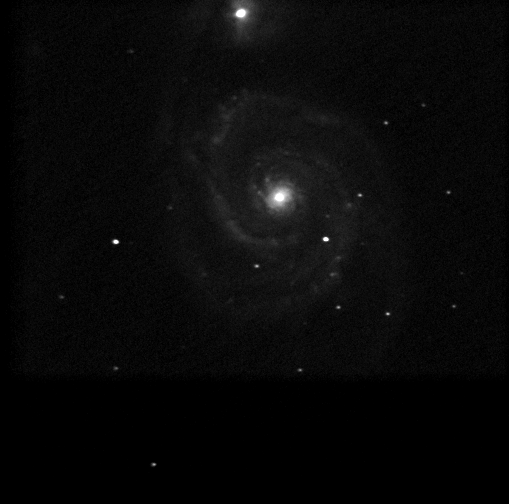
If you want to watch the star-finding code as it executes, modify the $interactive variable to be "1" instead of "0". If you do, then as the code processes each image, it will pop up a window showing the image, then place little crosses at the position of each star as it is detected, like this:
However, this will slow down the execution a LOT, by a factor of 10 or so.
After this script finishes, you'll see a bunch of files with names ending in .coo and .pht, one each for each of your images. The .coo files contain a list of the positions of the detected stars (plus some information about their shapes), while the .pht files contain aperture photometry for each star.
The script is designed to work reasonably well for "typical" images taken at the RIT Observatory. If you find that it's not working for your images, you might try tweaking some of the parameters hidden deep inside; talk to me for more information.
Details follow -- don't bother unless you're really interested.
The XVista program stars does the first step: finding stars in the image. It is designed to follow the algorithm for detecting stellar peaks described in Peter Stetson's 1987 paper on DAOPHOT. Each candidate peak in the image is measured in a few simple ways. This program produces a file in the output directory with a name likehira2011799.fits.coowhere the first part of the name is that of the image, and the extension is .coo (short for "coordinates"). The file contains one line per detected star, with a format like this:1 17.07 1552.08 8845 2.589 -0.058 0.759 2 25.97 1588.19 4923 2.391 -0.151 0.743 3 35.81 1339.97 2924 2.287 0.029 0.810where the columns contain
- a star ID number
- the row position (pixels)
- the column position (pixels)
- the peak value (ADU above sky level)
- estimate of Full-Width at Half-Maximum (FWHM) (pixels)
- "roundness" parameter (see below)
- "sharpness" parameter (see below)
The "roundness" is a measure of the symmetry of the stellar image. It is defined as
                      xwidth - ywidth
   roundness =  2 * (-----------------)
                      xwidth + ywidth
The "sharpness" parameter is similar to, but not exactly the same as, the sharpness parameter in DAOPHOT. It is here
  (image value at star centroid) - (mean of image values around centroid)
  -----------------------------------------------------------------------
                    (image value at star centroid)
So, a value close to 1 indicates a very sharp peak (possibly a cosmic-ray hit or chip defect), while a value close to 0 indicates a very soft peak.The next step is to measure the brightness of the detected stars. The XVista program phot does this job. It performs simple synthetic aperture photometry on the image, using a circular aperture centered on the star's position. The phot program produces one output file per image, with a name like:
hira2011799.fits.phtwhere the first part of the name is that of the image, and the extension is .pht (short for "photometry"). The file contains one line per detected star, with a format like this:1 17.07 1552.08 7661 23.92 12.809 0.021 12.851 0.025 12.903 0.027 1 2 25.97 1588.19 7671 19.21 13.263 0.031 13.273 0.033 12.387 0.040 0 3 35.81 1339.97 7704 15.58 14.176 0.070 14.120 0.075 14.211 0.088 3where the columns contain
- a star ID number
- the row position (pixels)
- the column position (pixels)
- the local sky value (ADU)
- uncertainty in sky value (ADU)
- instrumental magnitude in first aperture
- uncertainty in instrumental magnitude in first aperture
- instrumental magnitude in second aperture
- uncertainty in instrumental magnitude in second aperture
- instrumental magnitude in third aperture
- uncertainty in instrumental magnitude in third aperture
- (very last column) quality flag
There will be two extra columns per line for each aperture, containing the magnitude and uncertainty thereof. The "quality flag" always comes in the very last column.
The "quality flag" is a bit-wise OR combination of several flags.
          0          no problems with star
          1          star may be saturated
          2          star is close to a bad region
          4          star is close to an edge of the image
          8          star was not detected in a passband
In this context, "close to" means "within an aperture radius of". In the example above, star 1 is possibly saturated, while star 3 is both possibly saturated and close to a bad region. The flag value meaning "star was not detected in this passband" will obviously not be set at this point; it may appear later, when data from several passbands are collected and merged.
So, you have a list of files, one per image, which list all the stars found in each image. Unfortunately, the position of one particular star won't always be exactly the same, because the telescope drifts by a small amount over the course of many minutes. If you observed over several hours, you probably had to correct the position of the telescope several times, causing the positions of all stars to "jump" by a large amount. Before you can combine the images, you need to align them so that each star DOES appear in exactly the same (row, col) location all the time.
The do_multi.pl script will do this work for you. The start of the script looks like this:
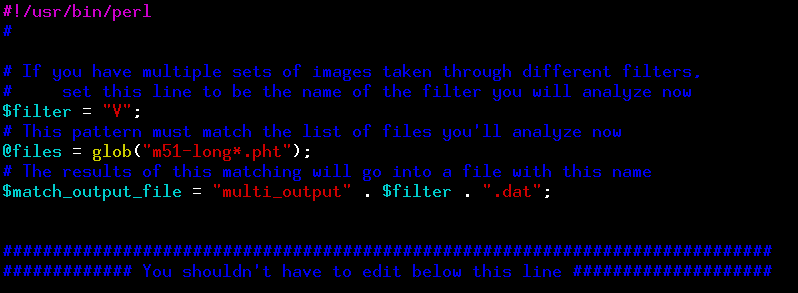
You should modify the @files line so that it describes your files. You might also modify the $filter line, especially if you have images of the same object through several filters; this script should be run only on images in a single filter at a time.
To run this script, simply type at the command line
perl do_multi.pl
If all goes well, it will produce an output file with a name given by the $match_output_file variable. This file simply provides the offset in rows and columns between a "reference image" and each other image in the dataset. For example, here's the first few lines of one output file I created:
lists m51-long31_fit.pht m51-long10_fit.pht dr = -28.07000 dc =  26.09000     4 of    4
lists m51-long31_fit.pht m51-long11_fit.pht dr = -27.28250 dc =  27.51500     4 of    6
lists m51-long31_fit.pht m51-long12_fit.pht dr = -25.25500 dc =  25.56667     6 of    6
lists m51-long31_fit.pht m51-long13_fit.pht dr = -23.91500 dc =  24.15000     4 of    6
lists m51-long31_fit.pht m51-long14_fit.pht dr = -22.40500 dc =  21.80250     4 of    6
In this example, the image m51-long31_fit.pht is the "reference image". The offset between this reference image and m51-long10_fit.pht was determined to be -28.07 rows and 26.09 columns. The final three columns tell you how many stars were matched between the two images, and how many possible stars _could_ have been matched. In this first line, 4 out of a possible 4 stars were matched between the images number 31 and number 10.
The final step is to use the image-to-image offset information provided by the $match_output_file to shift all the images into alignment, and then combine them into a single, very deep (we hope) image. The script shift_and_stack.pl will do these tasks, as its name suggests. Here is the section of the script which you might need to edit:
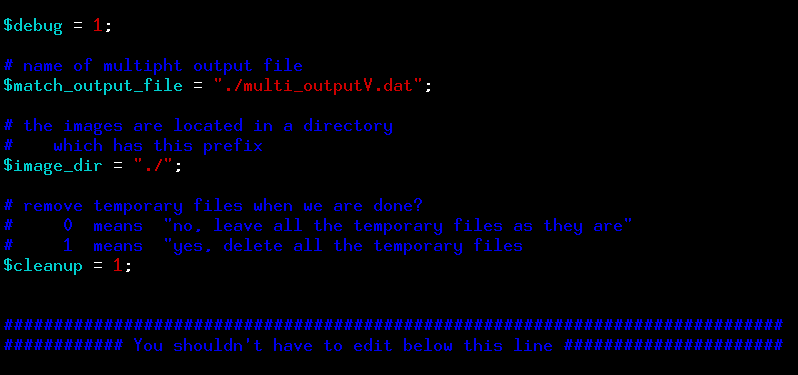
You will definitely have to modify the match_output_file value for your dataset. This script creates a large number of copies of your images, so that it can apply shifts without modifying your original data. By default, the script deletes all those shifted versions of the images when it finishes; but you can prevent them from being deleted by setting the $cleanup variable to 1 instead of 0.
If all goes well, this script will create two types of combined output images:
After you have created the shift_sum.fit and shift_median.fit images, you should probably re-name them to something more appropriate for your particular dataset. Otherwise, you might overwrite them if you run the shift_and_stack.pl script on another set of images.
Copyright © Michael Richmond.
This work is licensed under a Creative Commons License.