 Copyright © Michael Richmond.
This work is licensed under a Creative Commons License.
Copyright © Michael Richmond.
This work is licensed under a Creative Commons License.
This time, we examine supernovae which involve the accretion of material onto a white dwarf star until it explodes; these are called "Type Ia" events. To first order, these supernovae appear to be a very homogeneous group, and so for years it was hoped that they might serve as standard candles. Recent developments have shown that it may take a bit more work to choose a proper subset of them, but that the idea is still a good one.
Let's review the nature of Type Ia supernovae. We believe there are two ways that a white dwarf might be induced to explode.

Material from the main-sequence star can -- under the right circumstances -- escape from the outer atmosphere and form an accretion disk around the white dwarf. If the rate of mass accretion onto the white dwarf falls into the proper range, then the white dwarf's mass may eventually reach the Chandrasekhar limit, about 1.4 solar masses. At that point, little regions of thermonuclear reactions near the center of the white dwarf may enter a runaway instability, turning most of the white dwarf from C-O to Fe-group elements and producing enough energy to blow the entire white dwarf into smithereens, which fly out into space at very high speeds. The main sequence star, on the other hand, survives the explosion, though it takes a lot of damage.
Well, that's one possibility. Another is that TWO white dwarfs in a close orbit may eventually merge (the double degenerate scenario). The merger creates a single object which again exceeds the Chandrasekhar limit, and, once again, Ka-Boom.
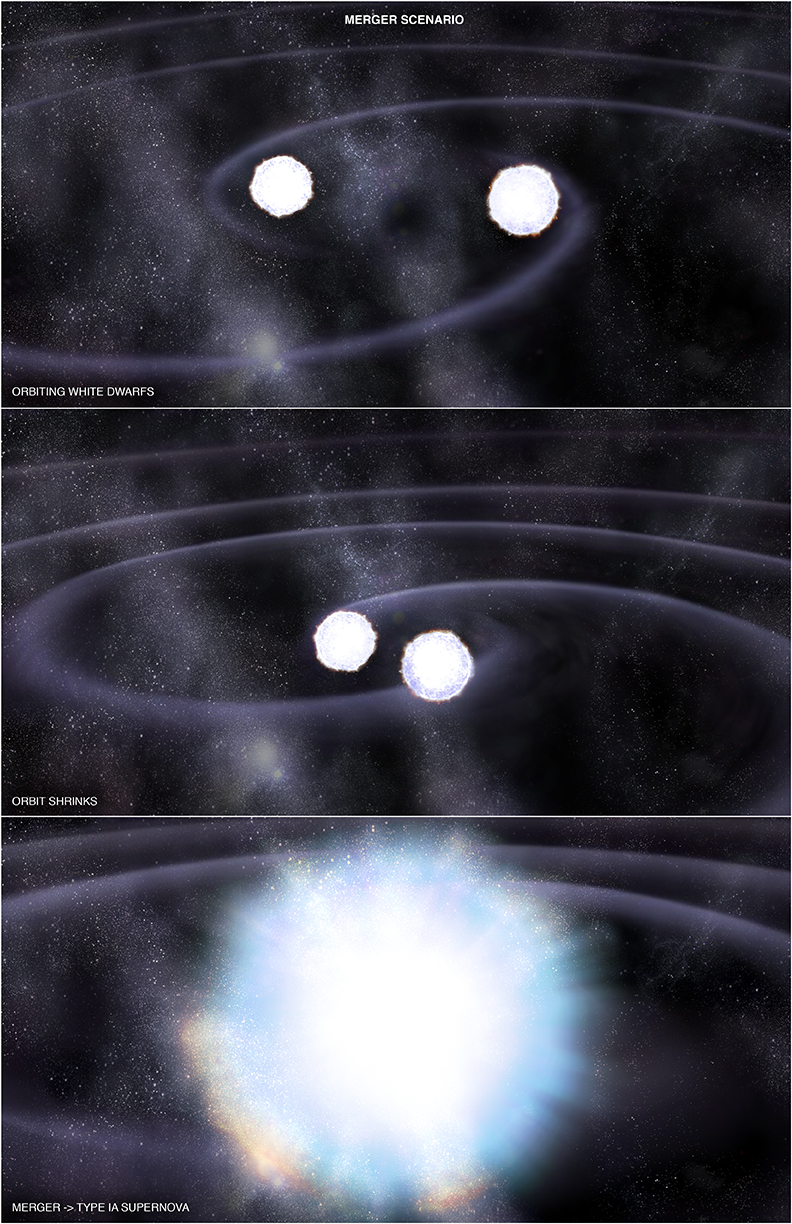
In this case, both of the merging white dwarfs are completely destroyed, so there is no surviving star.
In both of these scenarios, the result is pretty similar: the body of one (or two) white dwarf(s) blows apart into a cloud of gas, which is heated to temperatures of around 100,000 Kelvin and sent flying outward at speeds of 5,000 to 10,000 km/s. The hot cloud radiates light at all wavelengths, growing brighter as it increases in size over the first few days or weeks.
But wait -- there's a bit more to it than just a hot cloud of expanding gas. The nuclear reactions which caused this explosion converted a good portion of the white dwarf's material into a few isotopes of iron (Fe) and nickel (Ni). Most of these isotopes are unstable and decay over the next few days or weeks, injecting energy into the cloud. In particular, the decay chain
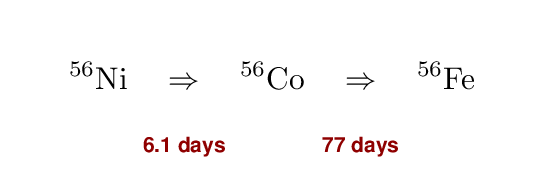
produces a significant portion of the energy which eventually turns into (mostly) visible light. This energy, released over a relatively prolonged period of time, is responsible in large part for the characteristic shape of a Type Ia light curve.
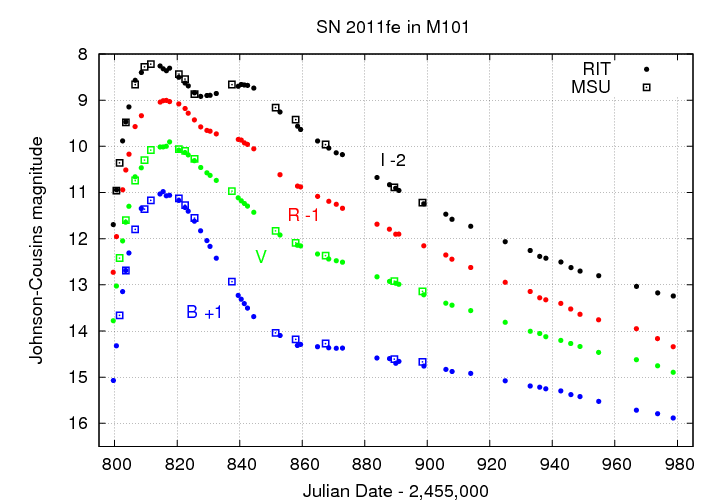
Based in part on data taken at the RIT Observatory,
figure taken from
Richmond and Smith, JAVSO, 40, 872 (2012)
If all Type Ia supernovae were identical, producing the same luminosity and decaying over the same period, then we could treat them as standard candles. In that case, we could

In the Old Days (1970s and 1980s), the collection of measurements was relatively small and inhomogeneous. At that time, it seemed possible -- within the uncertainties -- that all Type Ia SNe did indeed have the same absolute luminosity; in other words, it seemed possible that they might be standard candles.
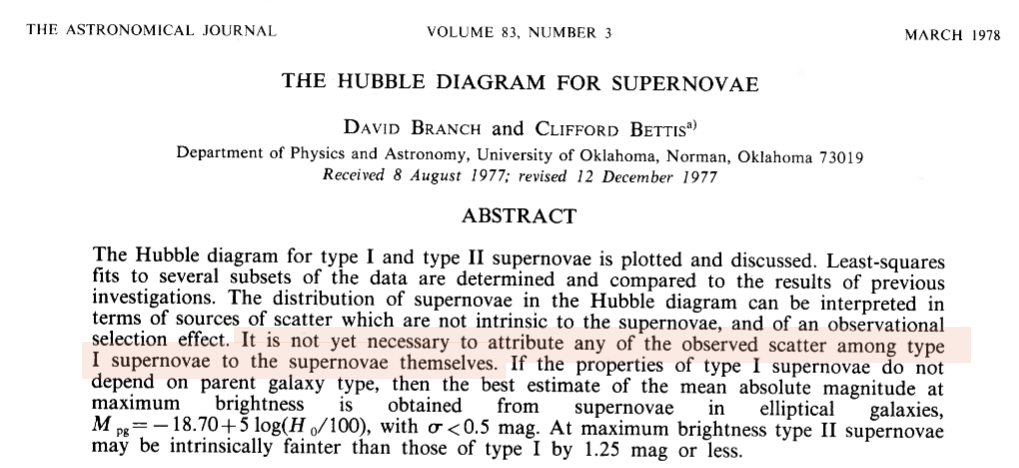
Abstract from
Branch and Bettis, AJ 83, 224 (1978)
However, as astronomers accumulated better measurements and larger samples, it became clear that SNe Ia are not all identical. These supernovae appear to vary in a systematic way.
For example, if we measure the amount by which supernovae decline in brightness 15 days after maximum light in the B-band,
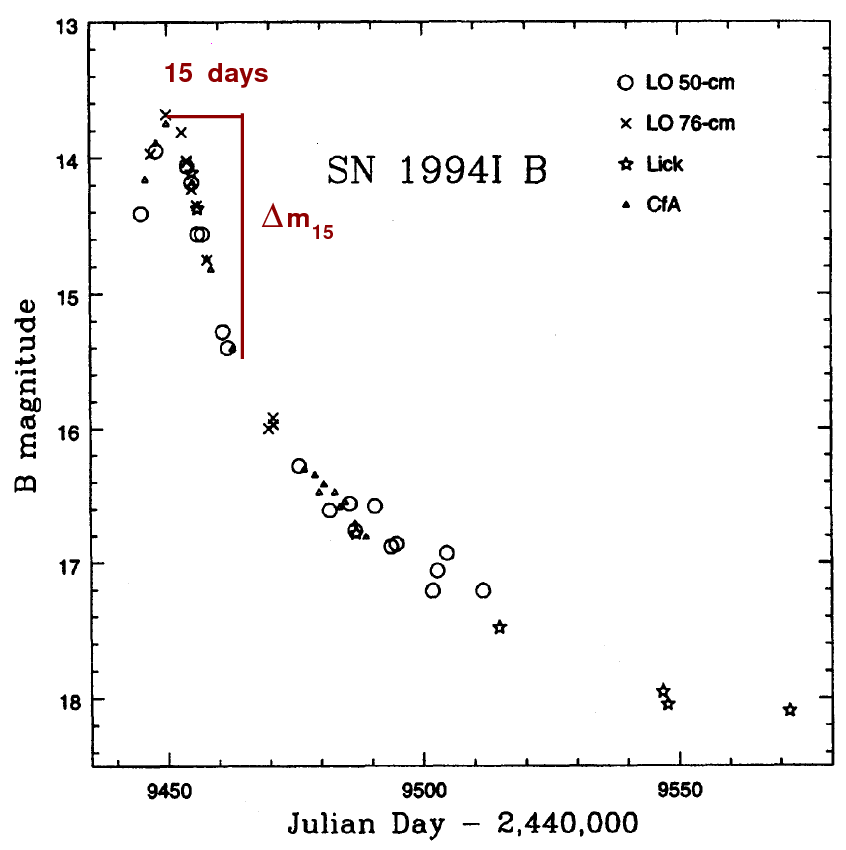
Figure taken from
Richmond et al., AJ 111, 327 (1996)
and compare it to the absolute magnitude of the event, we find a clear correlation.

Figure 2 modified from from
Hamuy et al., AJ 112, 2391 (1996)
    Extraluminous        Normal          Subluminous
 -----------------------------------------------------

     decline slowly                     decline quickly

     bluer                              redder

     faster ejecta                      slower ejecta

 -----------------------------------------------------
If we can measure enough SNe Ia to pin down these relationships between absolute magnitude and other observable quantities, we can perhaps turn SNe Ia into standard-izable candles; not as nice as truly standard candles, but still useful. There are several groups working on this problem, with slightly different techniques, and both have found some success. The SALT procedure involves choosing one of a set of templates which best fits the light curve of some particular observed SN Ia.
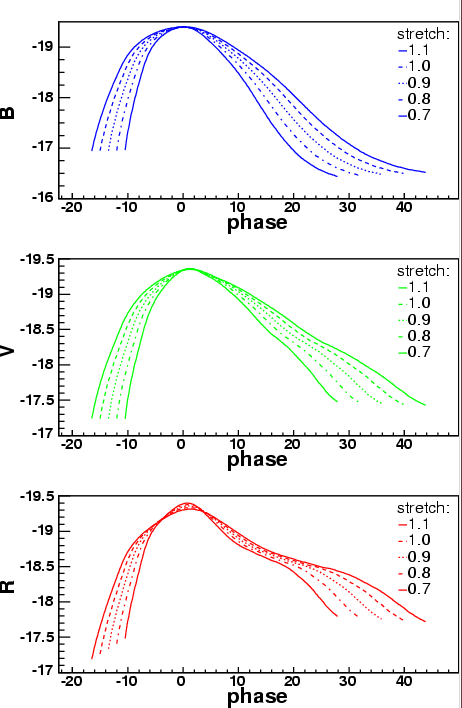
Figure taken from
Guy et al., A&A 443, 781 (2005)
Using these methods to correct for the relationship between decline rate and luminosity, one can reduce the uncertainty in distance modulus measurements for SNe Ia to perhaps 0.15 magnitudes.
  Q:  If the uncertainty in absolute magnitude
      is +/- 0.15 magnitudes, what is the
      uncertainty in distance?

      Express as a percentage.
If one looks at SNe in the near-infrared H-band, they may indeed be nearly identical; the Hubble diagram below uses measurements which have NOT been corrected for the decline-rate effect. To be fair, much less work has been done in the near-IR than in the optical.
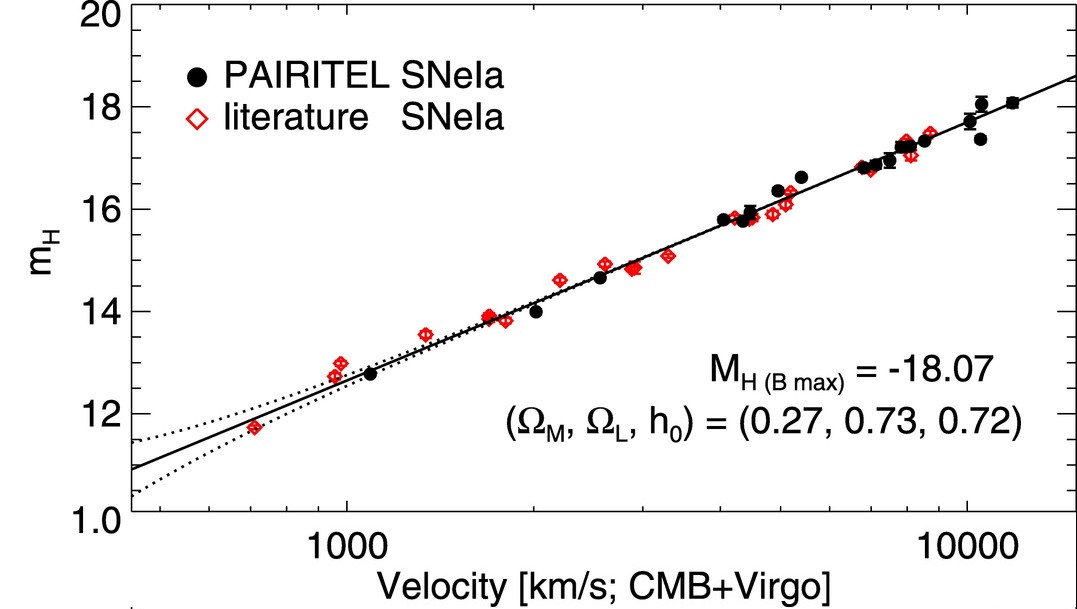
Figure taken from
Wood-Vasey et al., ApJ 689, 377 (2008)
One of the reasons astronomers spend so much time trying to understand Type Ia SNe is that they are really, really luminous: their absolute magnitudes are around -19 or -20! That means that they can be seen at VERY large distances, which means that they may be able to test different cosmological models.
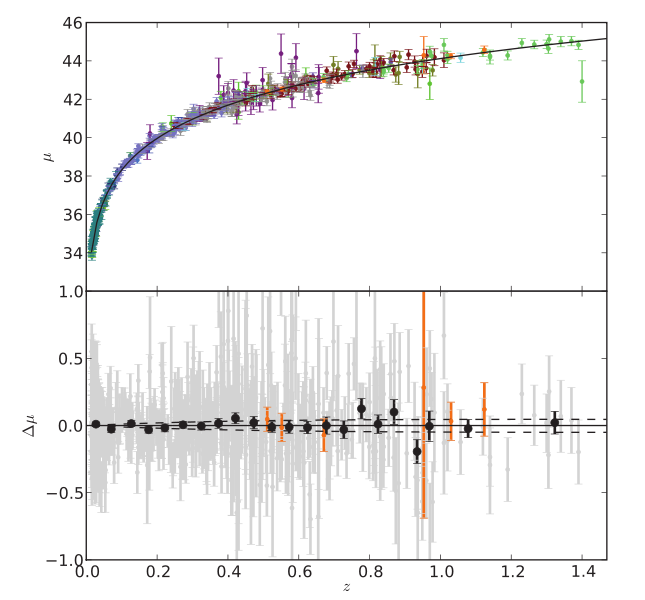
Figure taken from
Amanullah et al., ApJ 716, 712 (2010)
  Q:  What is the largest redshift out to which
      SNe Ia have been detected, as shown in
      the figure above?


      What is the distance modulus to that
      location?  Just look at vertical axis.


      To what (luminosity) distance, in Mpc, does that
      correspond?

         If you have a network device,
         go to Ned Wright's Cosmology Calculator
         and look it up.

         If you don't, use the definition
         of distance modulus.
Let's give it a try! Our target will be SN 2011fe in M101, which is one of the "good" Type Ia supernovae for distance measurements:
A portion of the B-band light curve measured by Richmond and Smith, JAVSO 40, 872 (2012) is shown in the figure below.

  Q:  What is the apparent B-band magnitude at peak?

  Q:  What is the Δm15 value in the B-band?
         (how much does the magnitude fade in the 15 days after peak?)

  Q:  Use the  relationship between decline rate and absolute magnitude
         as quantified by  Prieto, Rest and Suntzeff, ApJ 647 (2006)

                 MB = -19.325 + 0.636 ( Δm15 - 1.1)

         to compute the absolute B-band magnitude of this event.

  Q:  Compute the distance to this galaxy.
You can compare your distance to those derived using other techniques:
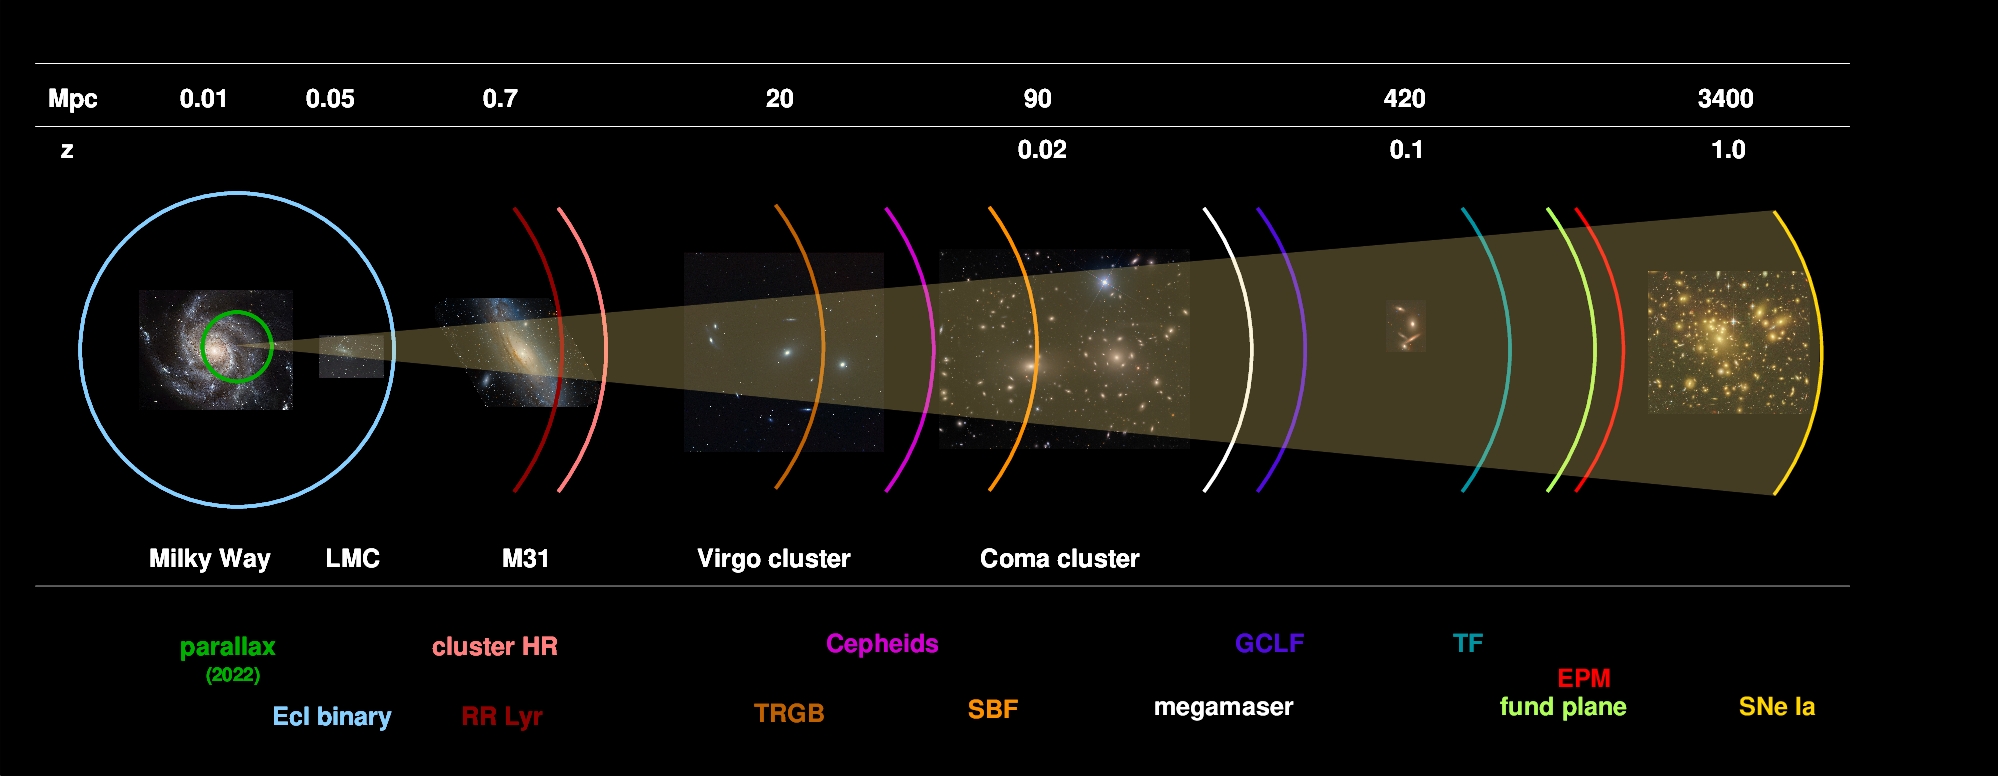
Now, one last word on Type Ia SNe: even the "good" events only provide relative distances. If we account for the relationship between decline rate and luminosity, we can determine the distance of one SN to another --- but we need to know the absolute distance to the first SN to turn these ratios of distance into Mpc. This makes Type Ia SNe one of the "secondary" distance indicators; or, more accurately, a "tertiary" indicator. The problem is these explosions are so uncommon that we haven't seen many (or any) in regions of space close enough to be reached with parallax, or even with some other methods. So we need at least 3 steps:
Still, even with this caveat, type Ia supernovae provide a powerful tool, because we can see them (and measure their properties) SO FAR AWAY!
Copyright © Michael Richmond.
This work is licensed under a Creative Commons License.