Copyright © Michael Richmond.
This work is licensed under a Creative Commons License.
Copyright © Michael Richmond.
This work is licensed under a Creative Commons License.
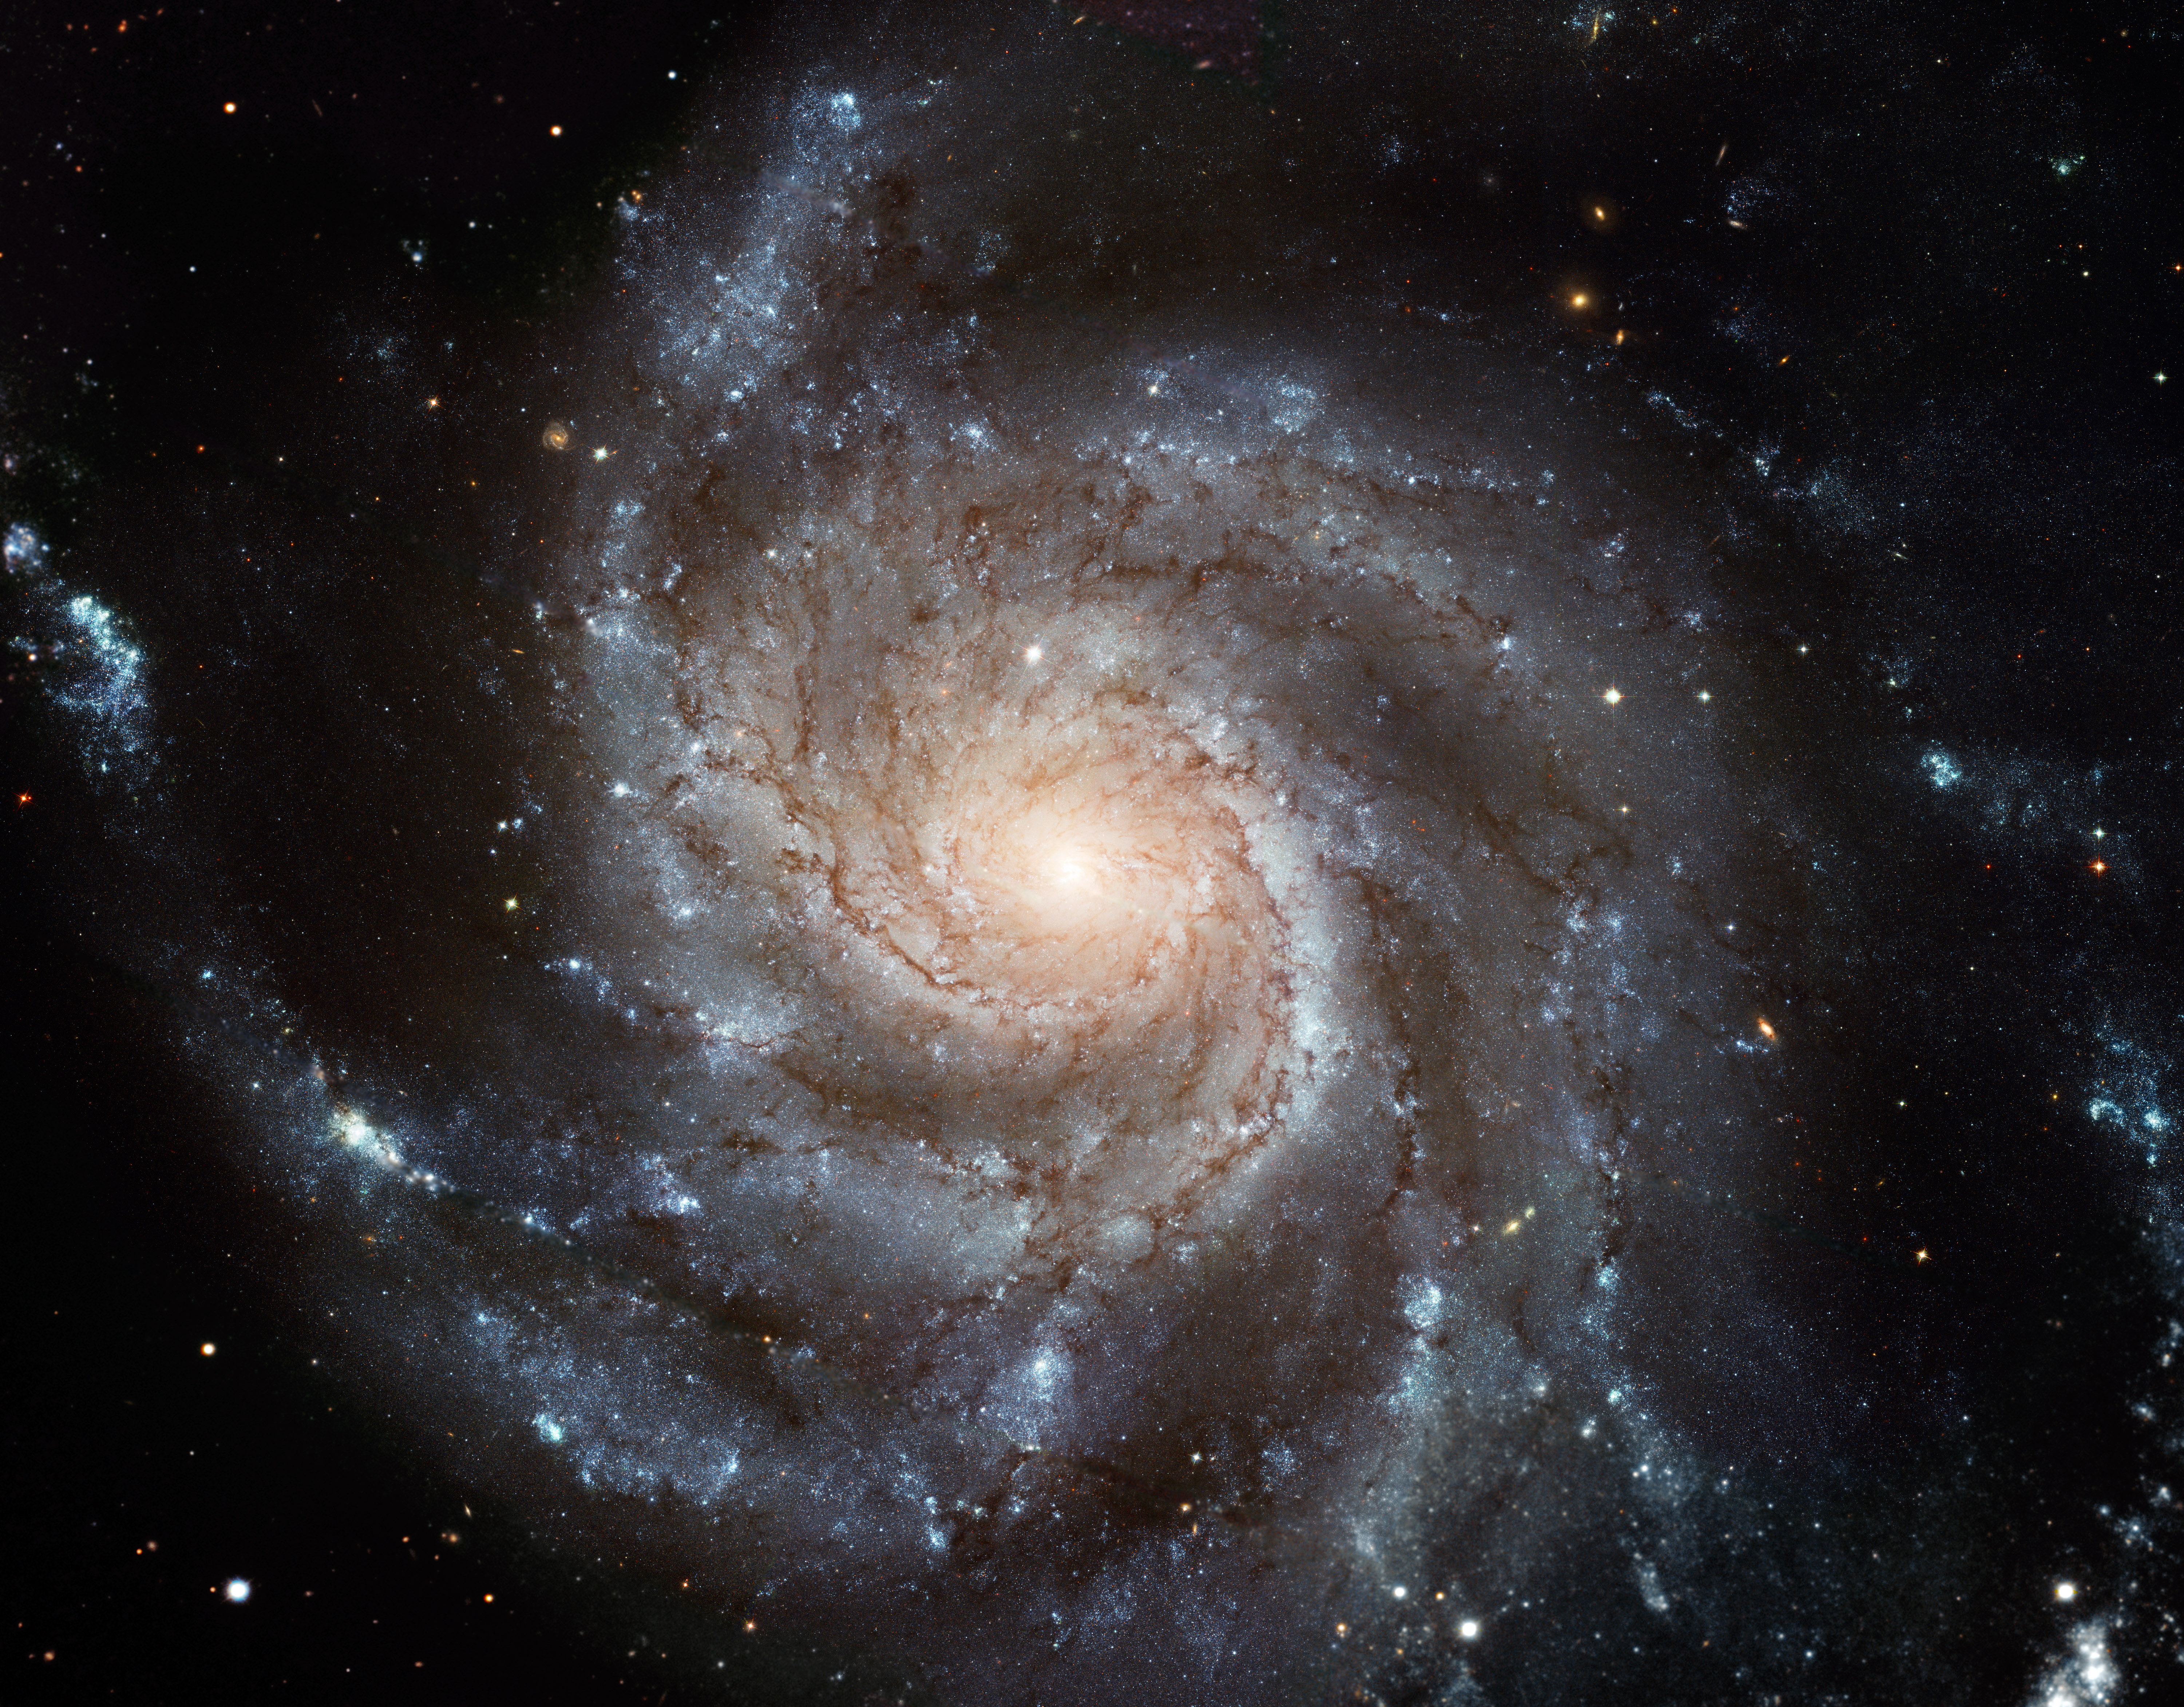
The galaxy in which we live is a relatively large, but otherwise ordinary, spiral galaxy. If we could fly far above it and look down on the disk, we might see something like this:
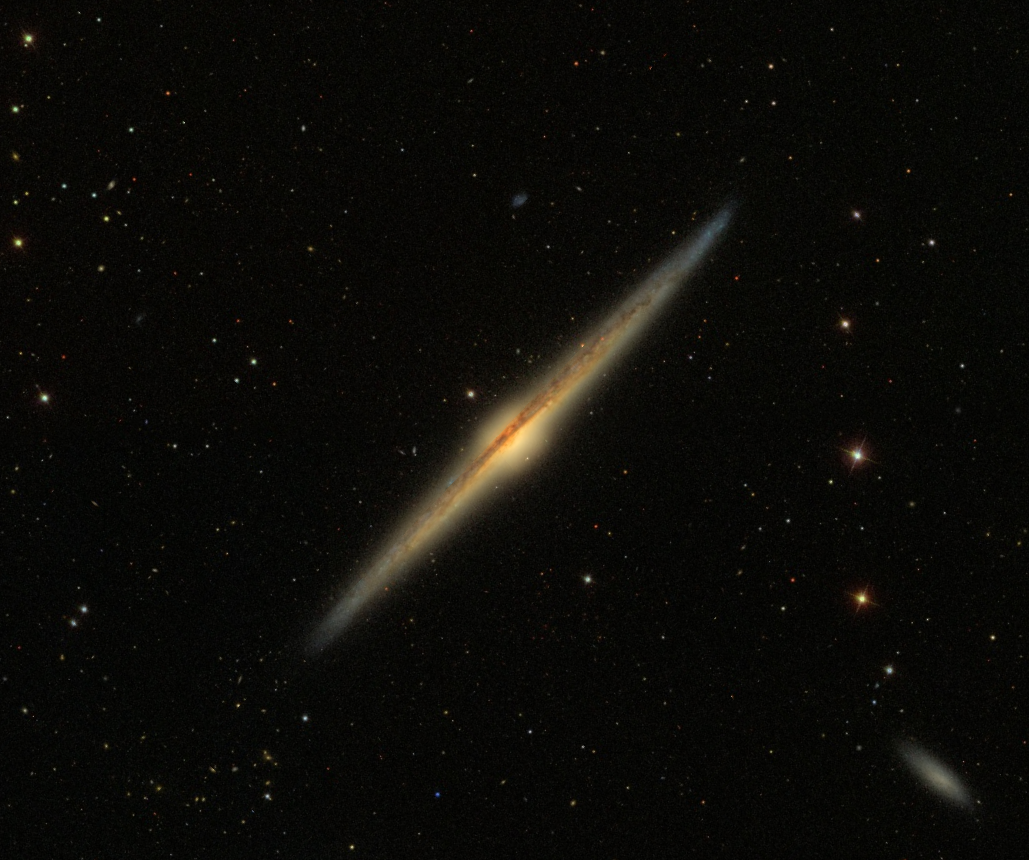
On the other hand, if we were to fly far away, but in the plane of the disk, and take a picture of the Milky Way from the side, we might see this:
Galaxies are very complicated entities, composed of hundreds of billions of stars and planets, untold trillions of asteroids and rocks, giant and not-so-giant clouds of gas and dust, magnetic fields, and a host of other objects. In order to simplify our discussion of galaxies, astronomers often break them down into a few common pieces.
Today, we'll focus mostly on the disk and the bulge; we'll leave the halo for our next lecture.
Most spiral galaxies feature a central bulge of roughly spherical shape. The stars in this bulge are quite different from the stars in the disk: bulge stars are
In theories of galaxy formation, the bulge is one of the first components in which stars form.
Some galaxies, like M104, have very large bulges.
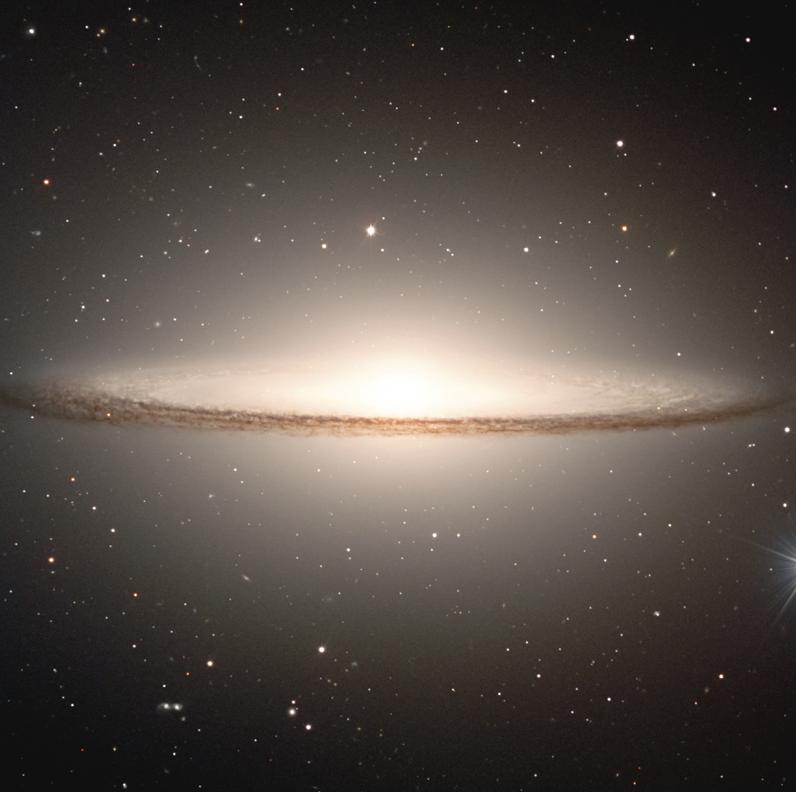
Image courtesy of
ESO/P. Barthel
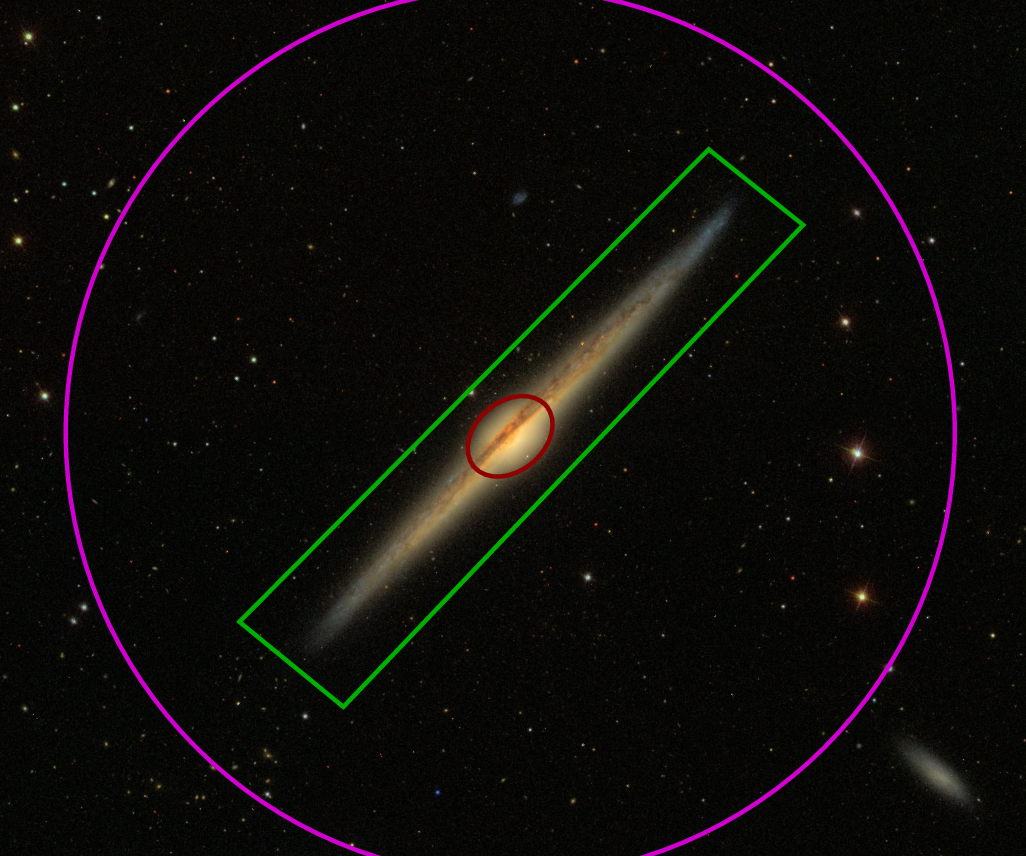
In others, such as NGC 5907, the bulge is so small that one can barely see it.

Image courtesy of
Brad Ehrhorn/Adam Block/NOAO/AURA/NSF
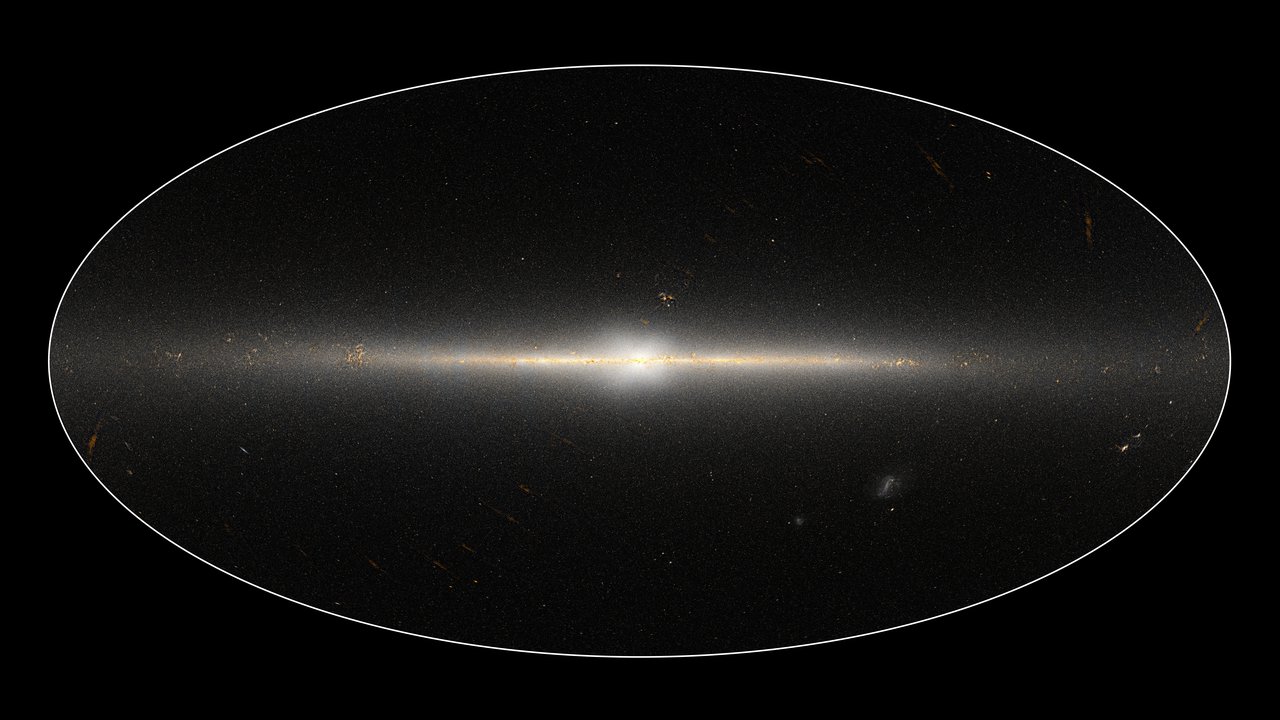
The bulge of our Milky Way lies somewhere in the middle.

Image courtesy of
Axel Mellinger and Astronomy Picture of the Day for 2001 Feb 2
Humans have a personal connection to the disk of our galaxy: our Sun is one of the members of the disk population. The disk is a large, flat collection of gas and dust, sprinkled with stars which
If we look at relatively short wavelengths -- in the optical, or near-infrared -- we see a flat collection of billions of stars.
WISE image courtesy of
NASA/JPL-Caltech
But if we look at longer infrared wavelengths, or in the radio regime, we see the clouds of gas and dust that permeate this portion of the Milky Way.
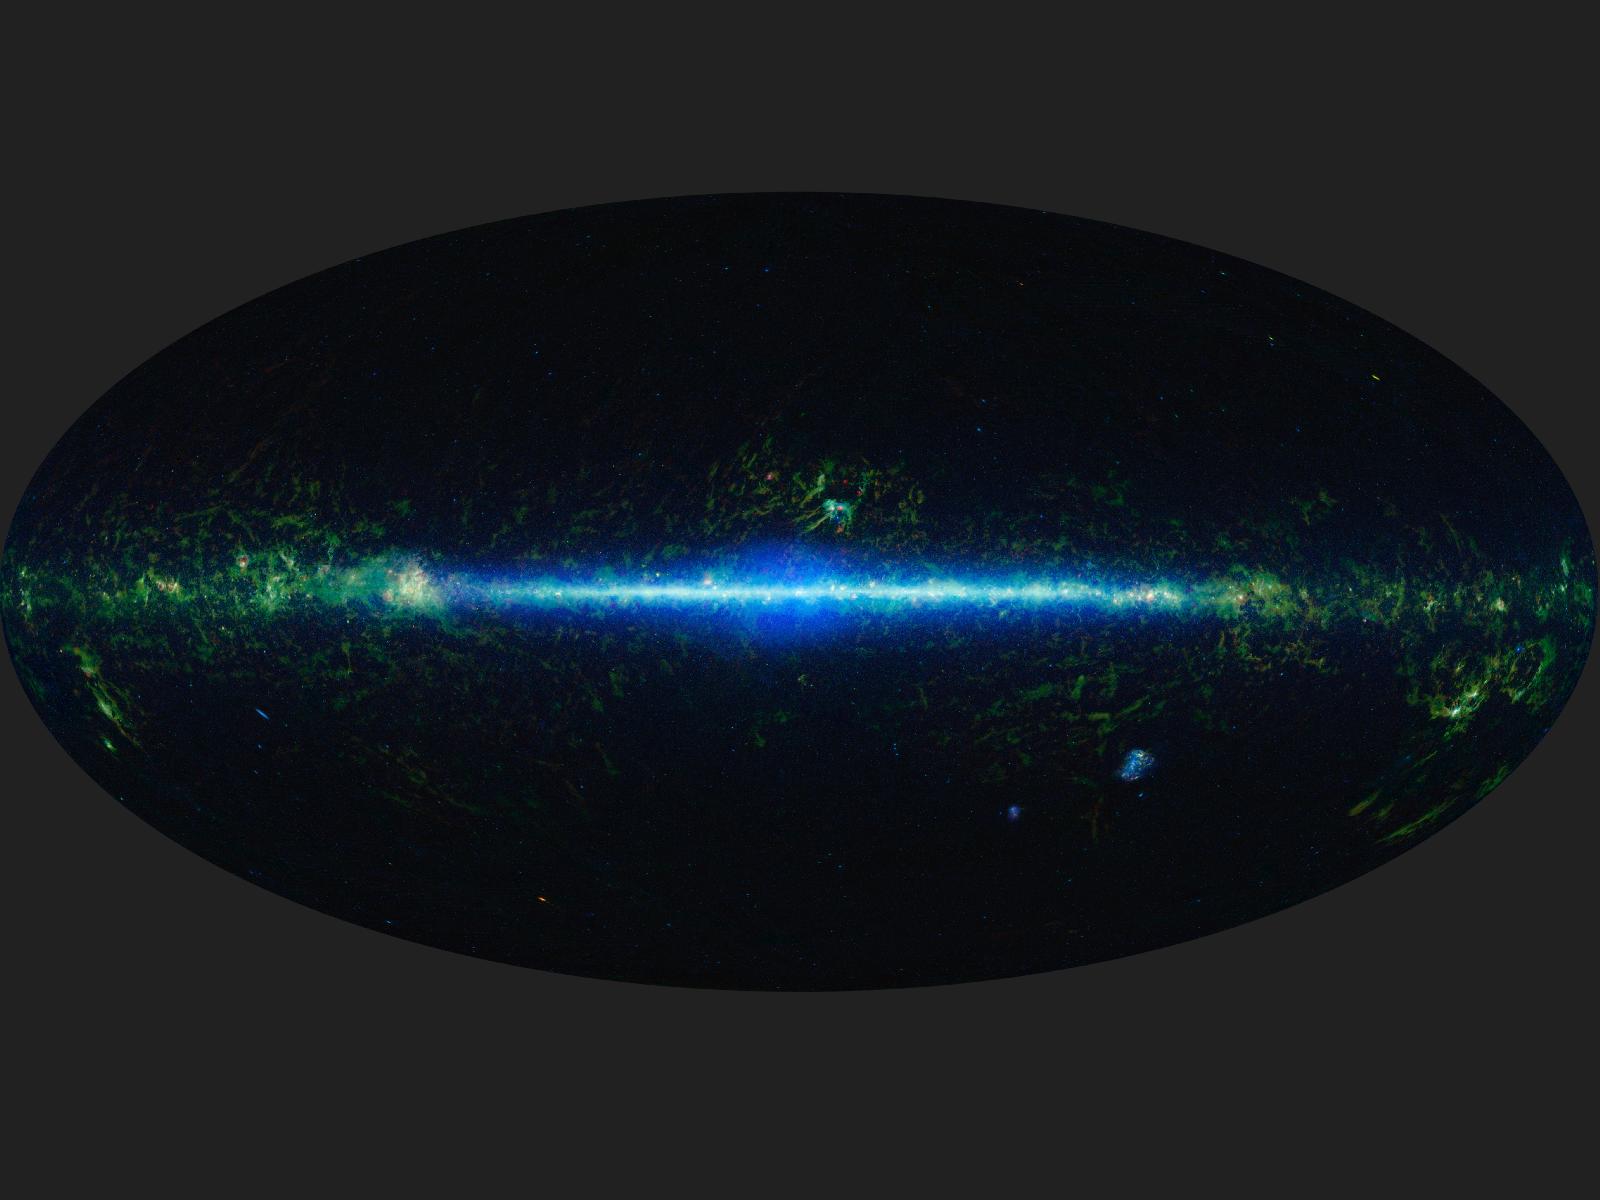
WISE image courtesy of
NASA/JPL-Caltech/UCLA
How do we know that the disk of our own Milky Way contains spiral arms? We can see them clearly when we view other galaxies from far away, but our Sun lies in the middle of the disk. Is there any clear evidence for spiral structure?
Since the clouds of gas and dust lying in the disk block our view of distant portions of the galaxy in the optical, astronomers have used radio waves -- which can penetrate the clouds -- to examine the far regions of the Milky Way. We can use radio observations to identify discrete structures which should act as tracers of the spiral arms.
Look at the maps of these tracers in the figures below, taken from
The Sun is located at (X = 0, Y = 8.5), and the center of the Milky Way at (X = 0, Y = 0). Can you see evidence for spiral structure?
First, look at the position of HII regions.
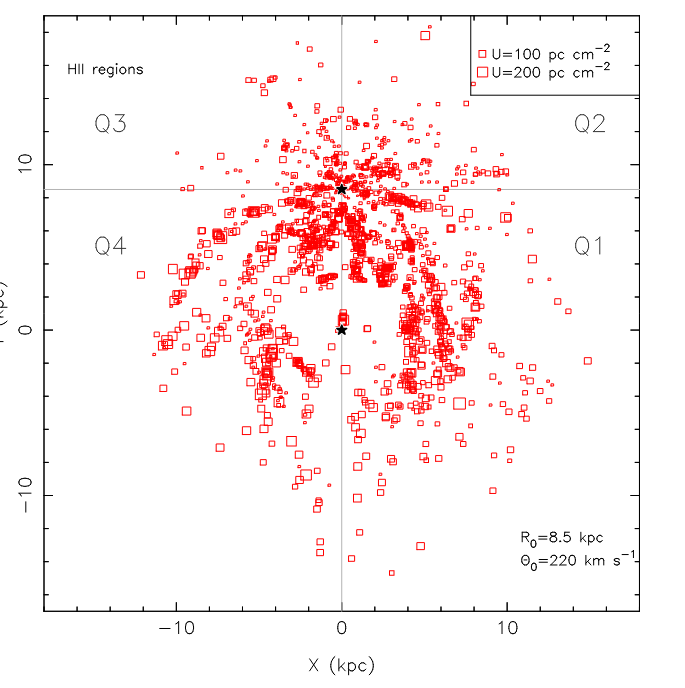
Image taken from Figure 5 of
Hou, L. G., and Han, J. L., A&A 569, A125 (2014)
One model suggests that arms lie here:
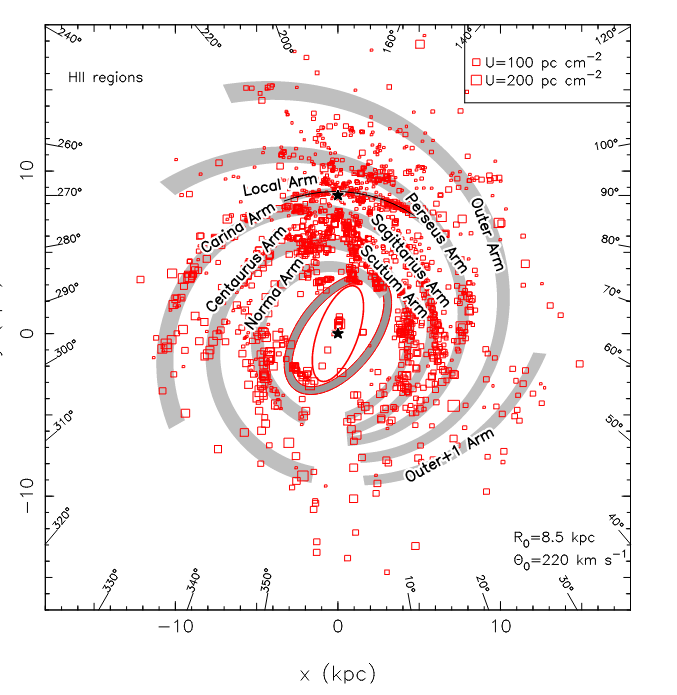
Image taken from Figure 5 of
Hou, L. G., and Han, J. L., A&A 569, A125 (2014)
Will a pattern emerge more clearly if we include not only HII regions, but also GMCs and masers?

Image taken from Figure 7 of
Hou, L. G., and Han, J. L., A&A 569, A125 (2014)
It probably says a lot that we can't decide just how many arms the Milky Way contains!
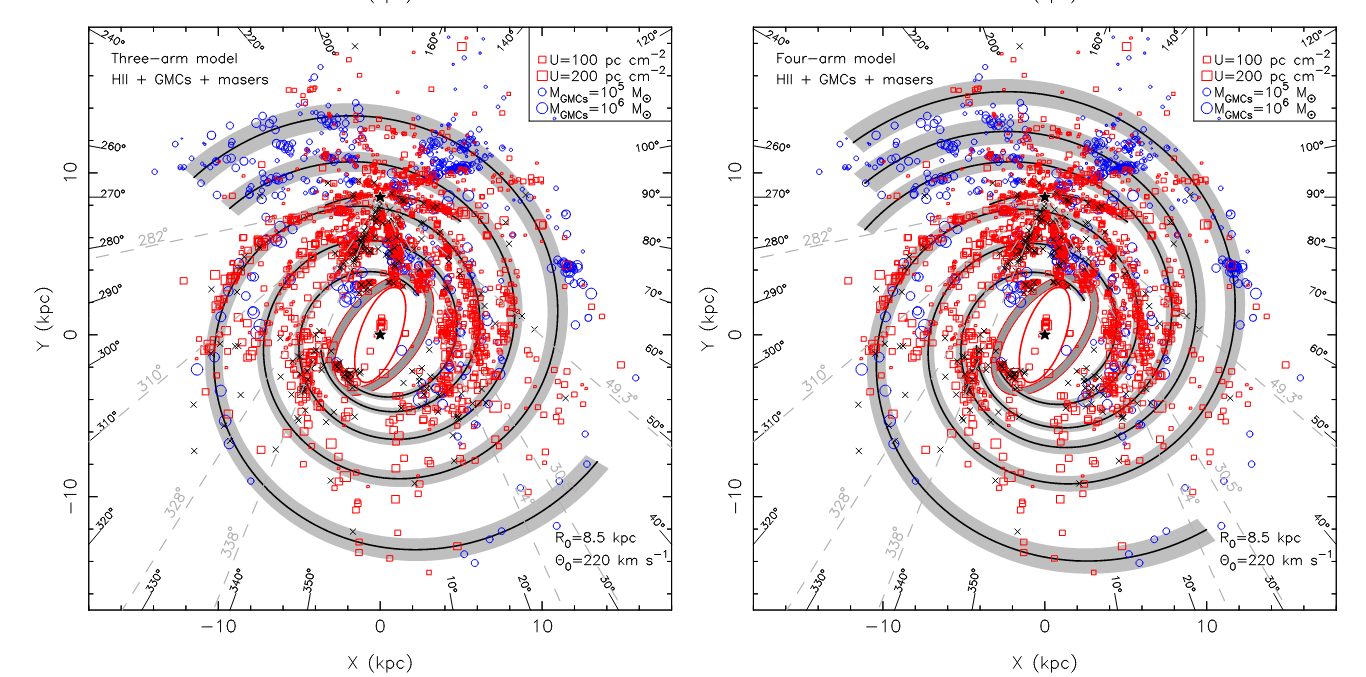
Image taken from Figure 10 of
Hou, L. G., and Han, J. L., A&A 569, A125 (2014)
In the last few years, Gaia has measured the properties of over a billion stars in the Milky Way. Using this gigantic dataset, and selecting stars of particular types, we can start to see the spiral arms directly as clumps of stars (or the voids between them). Click on the image below to watch an animation which shows off Gaia's detection of the spiral arms in the solar neighborhood.
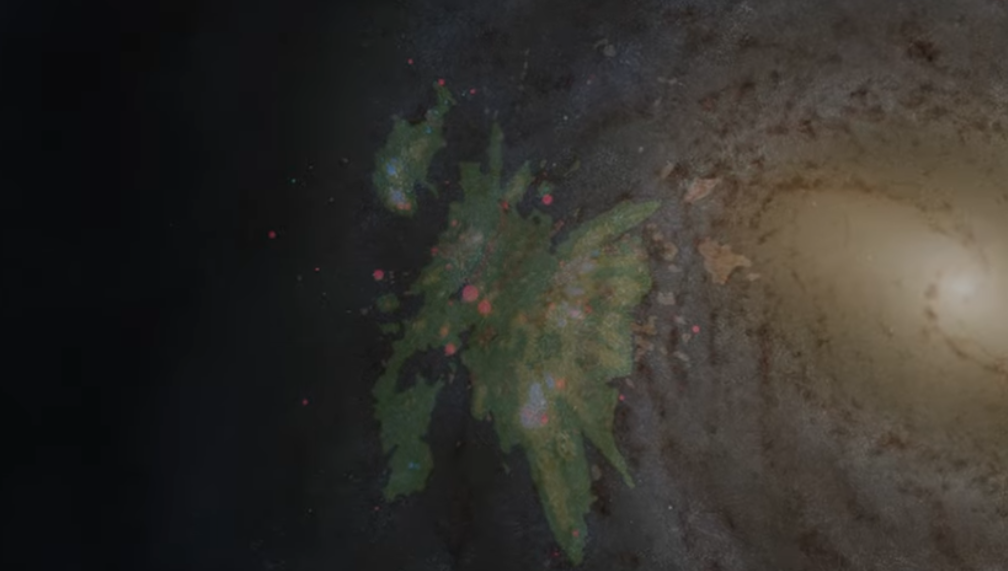
Image and movie courtesy of
ESA/Gaia/DPAC
Using the Gaia database to select the most massive, and certainly very young, O and B stars, we can map out spiral arms in the vicinity of the Sun.

Image courtesy of
Gaia Collaboration, Drimmel et al., arXiv:2206.06207 (2022)
  Q:  Does the Sun, marked by the cross at (0, 0) in the graph above,
           lie inside an arm, or in the space between two arms?
It does appear that we are located between two spiral arms, and more than 100 pc from the nearest substantial HII region.

Image courtesy of
Kevin Jardine,
based on data from the paper
"Gaia Data Release 3: Mapping the asymmetric disc of the Milky Way" by the Gaia Collaboration, Drimmel, R., et al. 2022.
In some other galaxies, we see evidence for a slight "twist" or warp in the shape of the disk. Perhaps the gravitational forces during a close encounter with another galaxy produce these distortions.

Image of UGC 3697 courtesy of
NRAO/AUI/NSF, Image copyright J. M. Uson (NRAO), observers L. D. Matthews (CfA), J. M. Uson (NRAO)
Does the plane of our own Milky Way have a similar twist? Several lines of evidence suggest that it does -- leading to headlines like this:

Headline from
NBC News (Aug 5, 2019)
What is the evidence for these claims?
And look at how that position changes as one selects stars in different sectors of the galaxy!
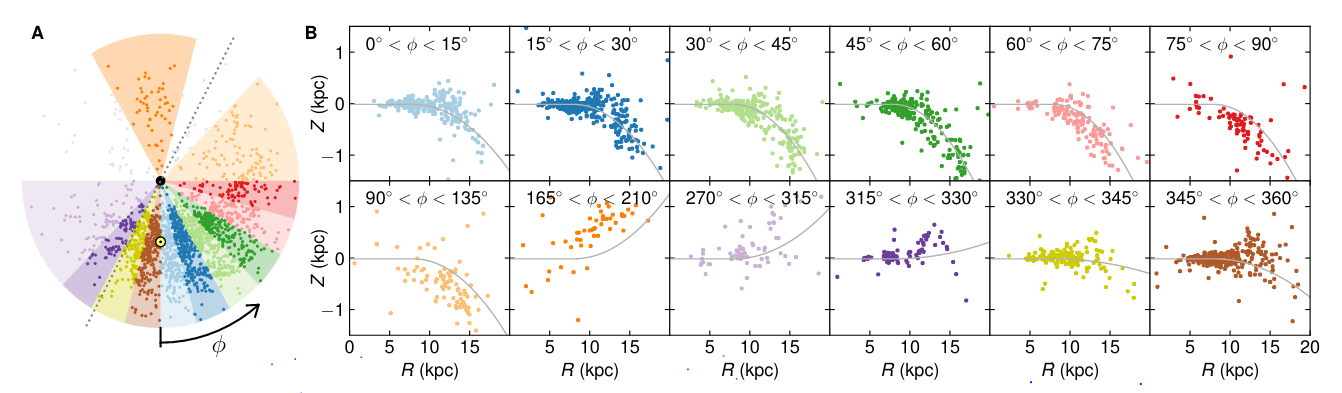
Image taken from Figure 2 of
Skowron et al., axXiv 1809.10653 (2019)
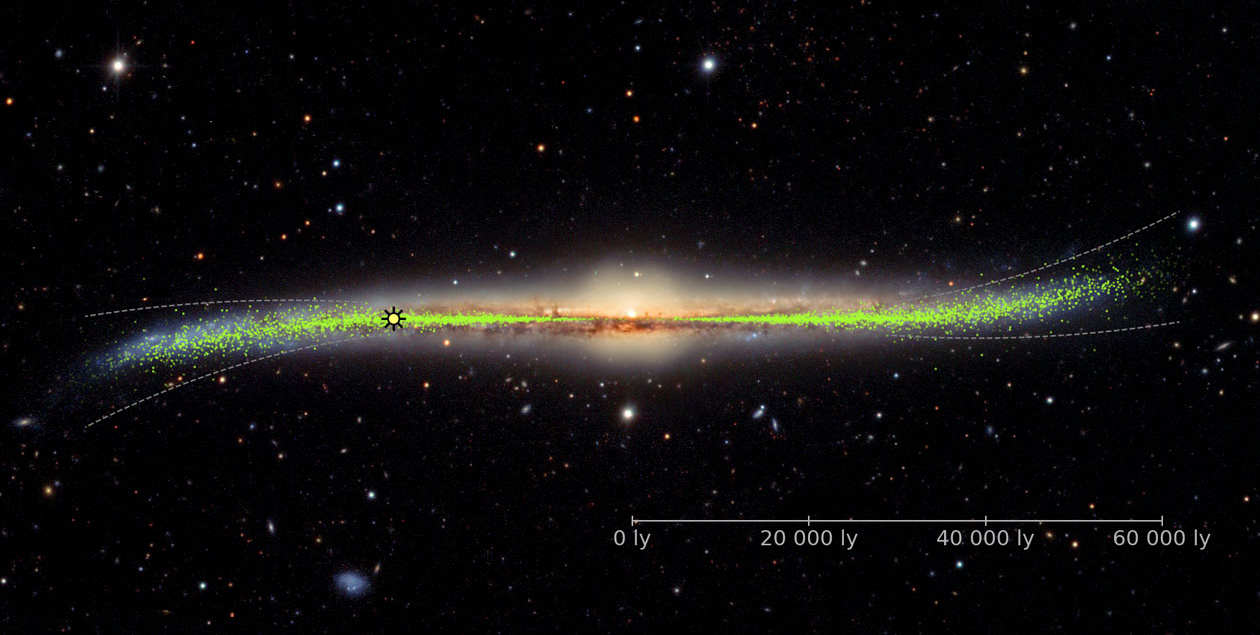
Image courtesy of
J. Skowron/OGLE/Astronomical Observatory, University of Warsaw
Below is a map of several models: each symbol shows the location of the mean of a bunch of stars in the (X, Y) plane of the disk, and the COLOR of the symbol is related to its VERTICAL position. Note that a perfectly flat disk will yield a map which is uniformly grey, indicating no variations in height from one region to another. A warped disk, on the other hand, will show a clear pattern.
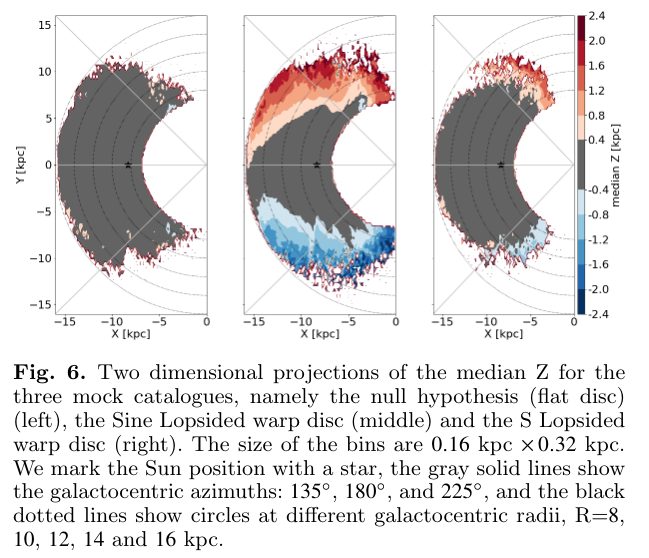
Figure 6 taken from
Romero-Gomez et al. (2019)
The actual Gaia measurements are shown in the figure below. It's clear that there is a systematic difference between stars on one side of the Sun and stars on the other side.
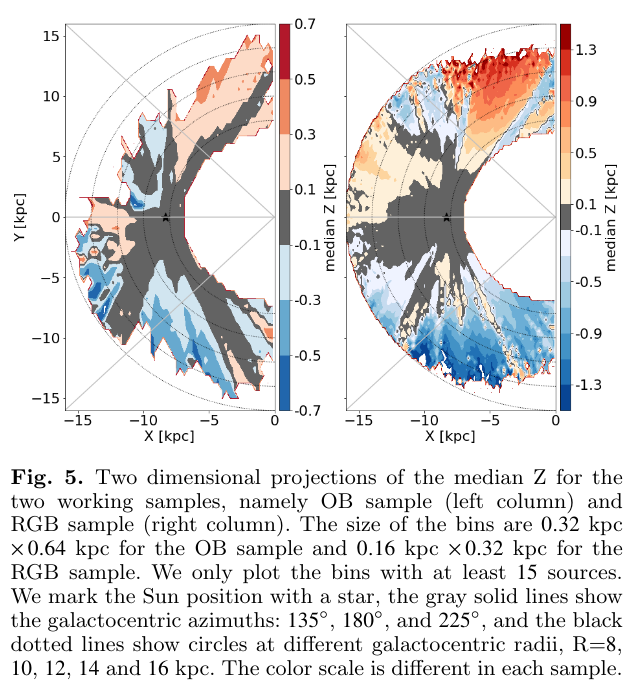
Figure 5 taken from
Romero-Gomez et al. (2019)
Gaia did more than count stars, and measure their distances and luminosities; for a subset of the brighter stars, it measured their motions and the elemental makeup of their outer atmospheres. That means that we can search through the Gaia dataset to find clues about the formation and evolution of our galaxy.
There's a gradient in the metallicity of stars as one moves from the center outwards: in general, the metallicity is highest near the center and lowest in the outer regions. However, that depends on exactly which stars one measures. Stars shown in blue below are those closest to the middle of the plane of the disk, while stars shown in red lie at some distance from the plane.

Taken from Figure 13 of
Gaia Data Release 3: Chemical cartography of the Milky Way
by Gaia Collaboration; Recio-Blanco, A., et al.,
A&A (2022) in press.
The different colored lines correspond to samples taken
at the given vertical distances from the plane.
If one examines metallicity as a function of distance above or below the plane, then one finds a very clear pattern:
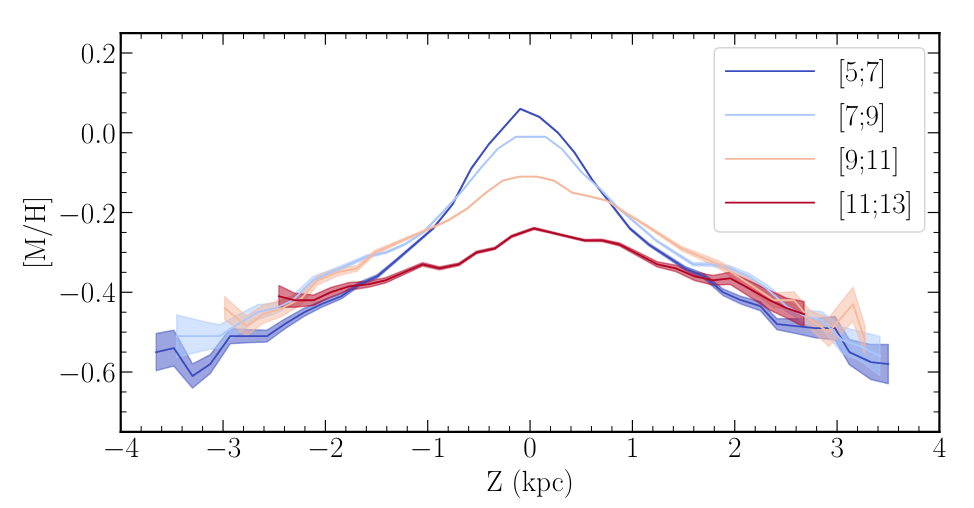
Taken from Figure 13 of
Gaia Data Release 3: Chemical cartography of the Milky Way
by Gaia Collaboration; Recio-Blanco, A., et al.,
A&A (2022) in press.
The different colored lines correspond to samples taken
at the given radial distances from the center of the galaxy.
  Q:  Can you think of any reason(s) why stars in the very
          plane of the disk might have the highest metallicity?

          (Hint: where does one find most of the gas and
                 star-forming regions?)
Copyright © Michael Richmond.
This work is licensed under a Creative Commons License.