
Headline from an article in Scientific American in July, 2019.
 Copyright © Michael Richmond.
This work is licensed under a Creative Commons License.
First, we need to go over the structure of this course.
The "big" questions this course will try to answer are
There will be a bit of review of topics related to stars and clusters of stars, which most of you will (I hope!) have seen in other classes, but that will build character.
There will be math.
Bring your calculator, paper, and pen/pencil to class.
At times, I may give quizzes in class using the "Quizzes" facility on myCourses. At other times, I may ask you all to look up certain sorts of information on the Internet during class periods.
Bring an internet-enabled device to class.
But we can also do things the old-fashioned way, with pen and paper.
Now, astronomy is a fast-moving field. Scientists are always building bigger and better telescopes and detectors, and faster, cheaper computers make it possible for theorists to run more sophisticated simulations each year. As a result, the media is almost constantly shouting about new discoveries, each more breathtaking than the previous one. Let's take a brief look at two examples of hyped-up headlines -- perhaps you might recognize them.
Later on in this course, once we've done enough preparation to understand the background of these puzzles, we'll revisit these issues.

Headline from an article in
Scientific American
in July, 2019.

Headline from an article in
Quantum Magazine
in December, 2020.

Headline from an article on
Big Think on Nov 2, 2022

Image courtesy of
The Debrief
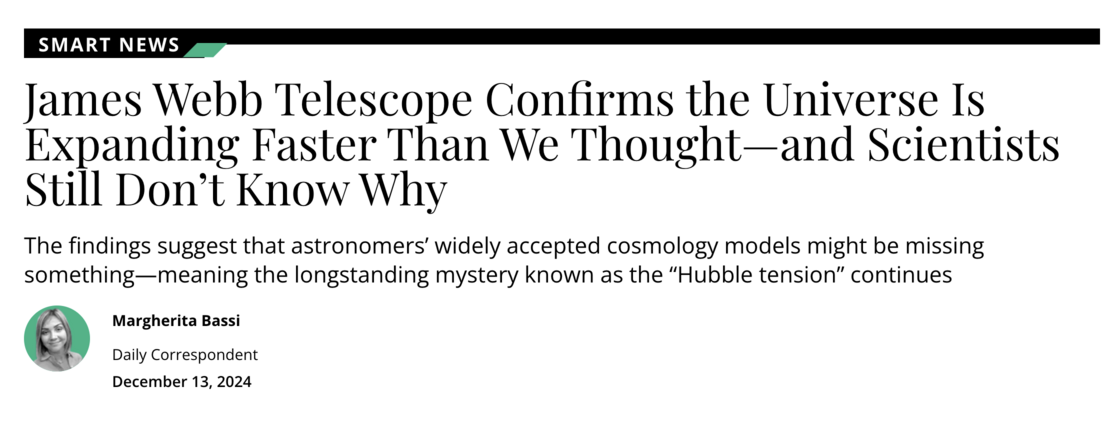
Image courtesy of
Smithsonian Magazine
As we will discuss later in this course, there is a great deal of evidence that the universe is expanding; not only that, but there appears to be a simple relationship between the distance to some galaxy and the rate at which it recedes from our Milky Way Galaxy: the more distant the galaxy, the faster it recedes.
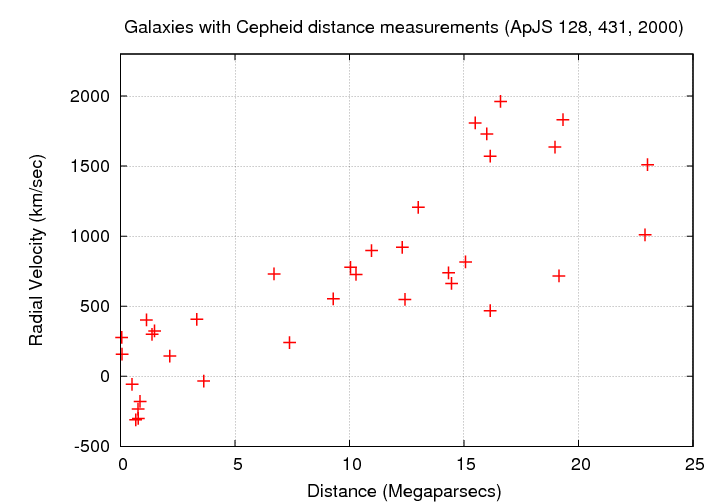
In mathematical terms,

In order to make quantitative tests of this idea, we need to determine the constant of proportionality in this equation (or the slope of the line in the diagram), which has been given the symbol H0 and the name "the Hubble Constant."

There are, it turns out, many different approaches one can take to measuring this quantity. If several astronomers choose different techniques, they can end up with values that don't agree. Back when I was a student in the 1980s, two of the major figures in this endeavour were Alan Sandage and Gerard de Vaucouleurs. In the diagram below, Sandage's values are highlighted in red, and de Vaucouleurs' in blue.

  Q:  What is the typical value of Sandage's estimates
           in the 1980s?

               __________  +/-  __________


  Q:  What is the typical value of de Vaucouleurs' estimates
           in the 1980s?


               __________  +/-  __________


  Q:  Do the two values agree within the uncertainties?
Back in those days, there was quite a lively debate about the Hubble Constant. At least one of the two camps had to be wrong -- but which one? And was the other one correct, or also mistaken?
Over the past few decades, telescopes and detectors have advanced markedly. It is now possible to see much fainter and much more distant objects that we could back then; in addition, we can measure the properties of all objects more precisely. It is no surprise, therefore, that the uncertainties associated with our current estimates of H0 are much smaller than they used to be. That's the Good News.
The Bad News is that the astronomical community is again divided into two (main) groups, which have chosen two different approaches to measuring the Hubble Constant. The error bars are much smaller now, but, well, see for yourself.
Method One (based on the cosmic microwave background):

Adapted from Figure 2 of
Cosmology Intertwined: A review of the particle physics, astrophysics, and cosmology associated with the cosmological tensions and anomalies
Abdalla, E., et al., Journal of High Energy Astrophysics, 34, 49 (2022)
  Q:  What is the typical value determined by Method One?

               __________  +/-  __________
Method Two (based on the distance ladder):
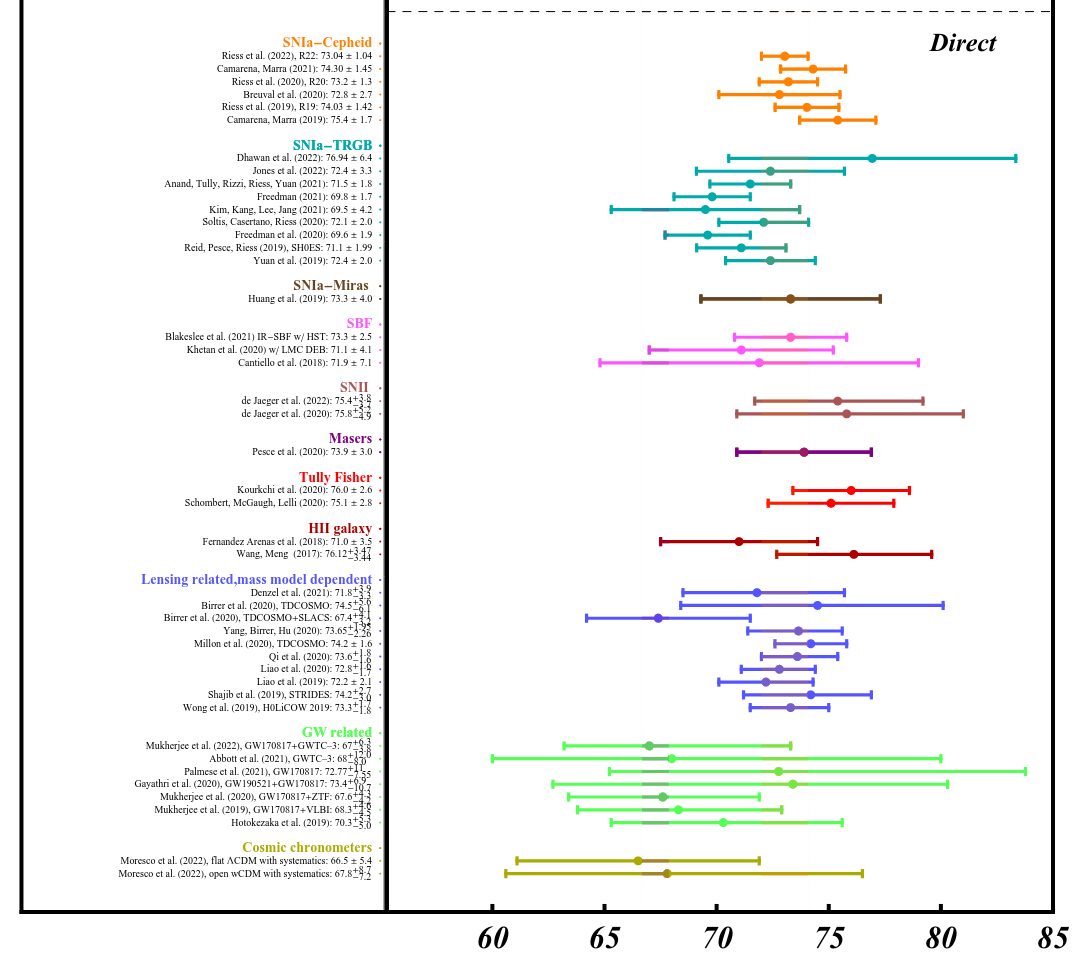
Adapted from Figure 2 of
Cosmology Intertwined: A review of the particle physics, astrophysics, and cosmology associated with the cosmological tensions and anomalies
Abdalla, E., et al., Journal of High Energy Astrophysics, 34, 49 (2022)
  Q:  What is the typical value determined by Method Two?


               __________  +/-  __________


  Q:  Do the two values agree within the uncertainties?
Sigh.
This difference between the values of H0 is the source of the "Hubble tension" which keeps astronomers up at night. In some cases, literally!

Headline from an article in
Scientific American
from September, 2022

Image courtesy of
Astronomy Magazine , updated May 18, 2023

Image courtesy of
Association of American Universities , dated Jan 9, 2025
How could galaxies "break cosmology?" The basic idea is that when we look at very distant galaxies, we are looking back in time, and seeing these objects not long after the Big Bang.
In our local corner of the Milky Way Galaxy, it has been over thirteen billion years since that time of unimaginably high temperatures and densities. That's plenty of time for all sorts of things to happen:
We think steps "a" through "e" took quite some time; perhaps 500 to 1000 million years (Myr), perhaps more. Moreover, simulations indicate that the first galaxies to form were relatively small; collisions and mergers between these original small units created larger, more luminous galaxies -- but that took extra time.
That's the theory, anyway.
Over the past few decades, astronomers have sought to detect and measure the properties of fainter, more distant galaxies. The farther away they are, the longer it has taken light to reach our telescopes ... and so the younger the objects that emitted that light must be. The exact relationship between redshift (a stand-in for distance) and age is rather complex, but you can get some ideas by playing with Ned Wright's Cosmology Calculator.
Use the calculator to fill in this little table:
     Redshift                 Age at redshift (Myr)
----------------------------------------------------------
        0

        1

        3

        5

       10

       12
----------------------------------------------------------
According to some (most?) of the current models of galaxy formation, we might expect to see the first galaxies appear around redshifts 5 to 10 ... but those first galaxies ought to be relatively small; the really big, luminous ones ought to take a bit longer to form.
However, recent observations with JWST have detected some very intriguing objects. They may not look like much,
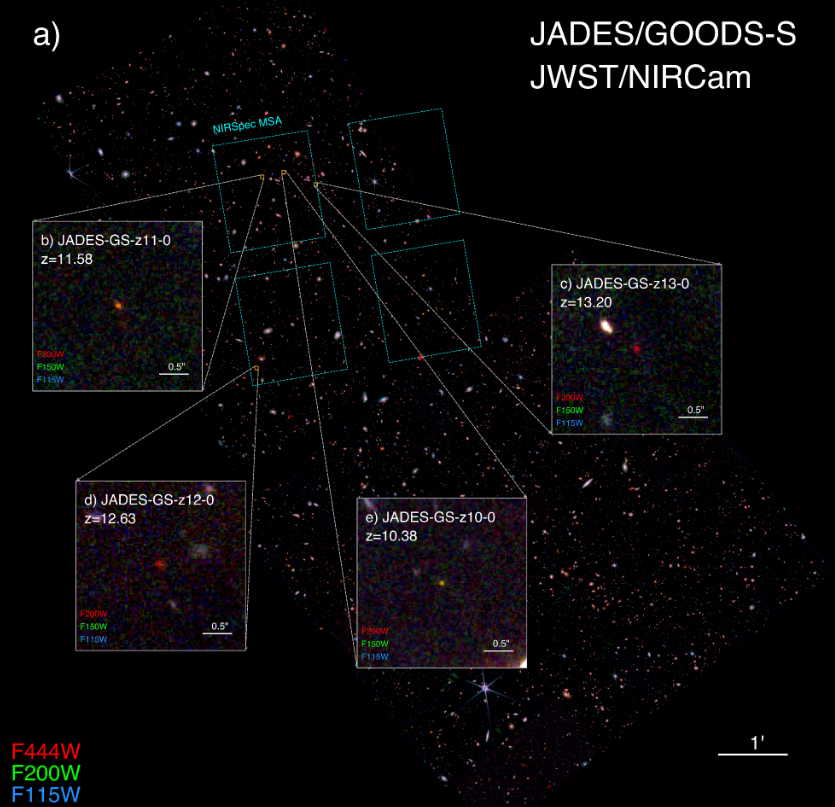
Taken from Figure 1 of
Discovery and properties of the earliest galaxies with confirmed distances
by B. E. Robertson et al.,
submitted to Nature, Dec 2022
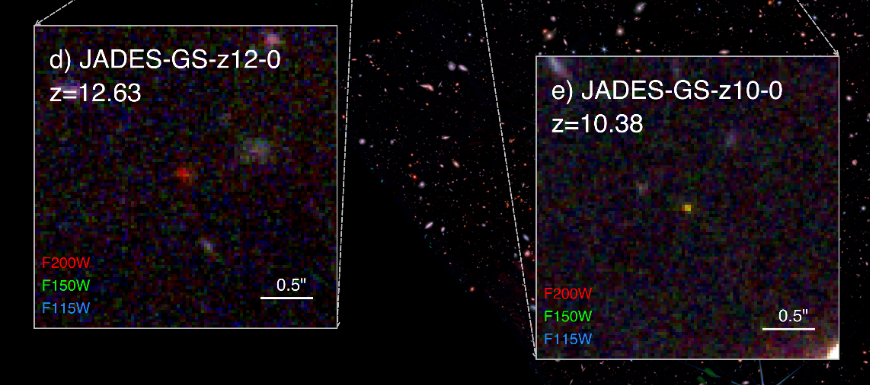
Closeups taken from Figure 1 of
Discovery and properties of the earliest galaxies with confirmed distances
by B. E. Robertson et al.,
submitted to Nature, Dec 2022
but these faint little red blobs of light divulge some fascinating properties.

Abstract of
Discovery and properties of the earliest galaxies with confirmed distances
by B. E. Robertson et al.,
submitted to Nature, Dec 2022
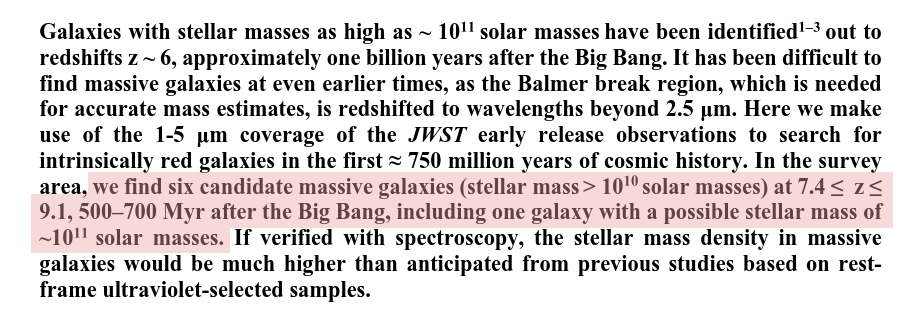
Abstract of
A population of red candidate massive galaxies ~600 Myr after the Big Bang
by I. Labbe et al.,
accepted by Nature, Dec 2022
The bottom line is that recent observations reveal some relatively massive galaxies which appear to have formed very rapidly -- within just a few hundred million years after the Big Bang. That's more quickly than the predictions of most current theories of galaxy formation.
Uh oh?
 Copyright © Michael Richmond.
This work is licensed under a Creative Commons License.