
 Copyright © Michael Richmond.
This work is licensed under a Creative Commons License.
Because astronomers were using optical telescopes and optical detectors (the eye, photographic plates, CCDs) in the early- and mid-twentieth century, they classified galaxies based on the optical light they emitted. But we can now examine galaxies at other wavelengths -- do the galaxies look the same? Could we use the same system to classify them if our instruments operated in another part of the spectrum?
Consider, for example, the infrared (IR) portion of the spectrum. The optical and infrared highlight different features and different types of celestial objects.
What's the physical reason for these changes in sources of radiation -- hot stars, cool stars, warm dust -- at different wavelengths? In all of these cases, most of the photons are created by thermal radiation, also called blackbody radiation. The spectrum of this type of radiation depends on the temperature of the source in the following manner:

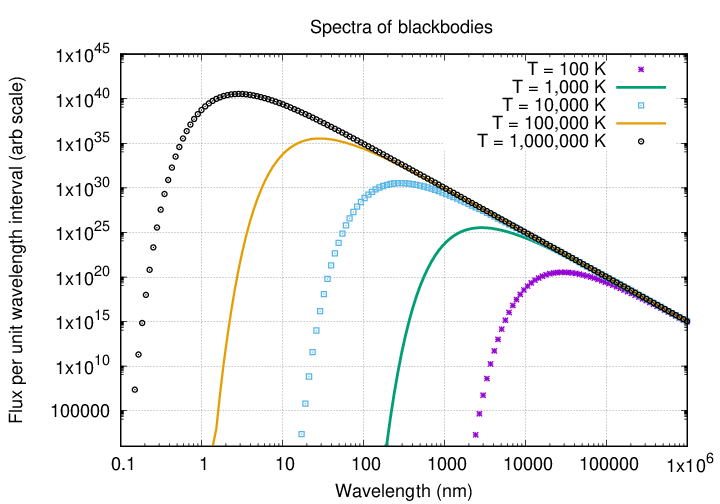
Note that the peak of the spectrum -- the wavelength at which most of the energy is emitted -- varies in a simple way: hot objects emit at short wavelengths, and cool objects at long wavelengths. In fact, the relationship between source temperature and the peak wavelength is

So, for example, a hot star of temperature T = 10,000 K would emit the bulk of its radiation around a wavelength of λpeak = 290 nm, which is in the near-UV portion of the spectrum. In other words, hot stars (much hotter than the Sun) will show up best in the blue portion of the optical.
    Q:  What is the peak wavelength for a cool star of T = 3000 K?
            Which optical filter might show such stars best?


    Q:  Dust clouds can be warmed by starlight to temperatures of
            a few hundreds of degrees; let's use T = 300 K as
            a representative value.  What is the peak wavelength
            for light emitted by such dust?  What portion of the
            spectrum is that?
To explore the effect of wavelength on the appearance of galaxies, let's use the Spitzer Infrared Nearby Galaxies Survey (SINGS) collection of images. The SINGS scientists chose a set of relatively nearby galaxies and collected images in both the optical and infrared portions of the spectrum. You can read all about the project at
In the optical, they acquired images in the B, V, R, and I passbands; as the figure below shows, these range from about 4000 Angstroms (400 nm) in the blue to about 9000 Angstroms (900 nm) in the far red.
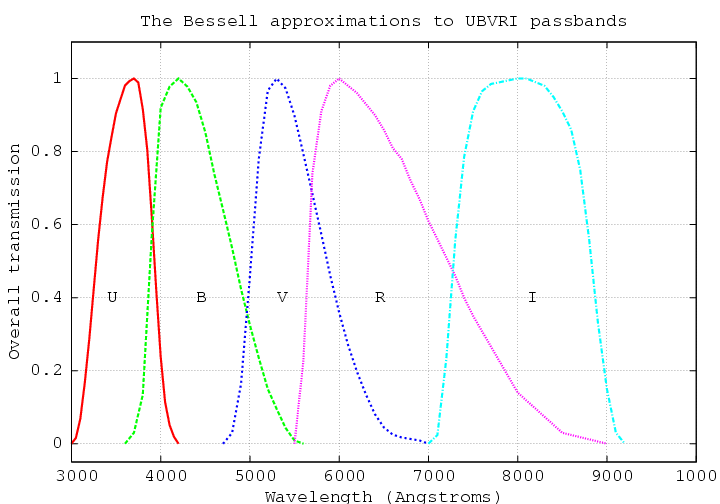
In some cases, they also acquired images taken through narrow filter called "H-alpha", which shows light emitted by hydrogen atoms in gas clouds close to hot young stars.
The SINGS team also used the Spitzer Space Telescope to take images in the infrared. Spitzer had two cameras:
The figure below shows the bandpasses for the IRAC 1, 2, 3, and 4 filters, and the MIPS 24, 70, and 160 filters.

Modified from Figure 1 of
Kennicutt et al., PASP, 115, 928 (2003)
The SINGS team has created a webpage
which allows anyone to access all their optical and infrared data on the set of almost 100 galaxies in their sample. Thanks to the NASA/IPAC Infrared Science Archive, users can not only download all the data, but also display and manipulate it with nothing more than a web browser. Let's give it a try!
If you go to the main SINGS Data Access page
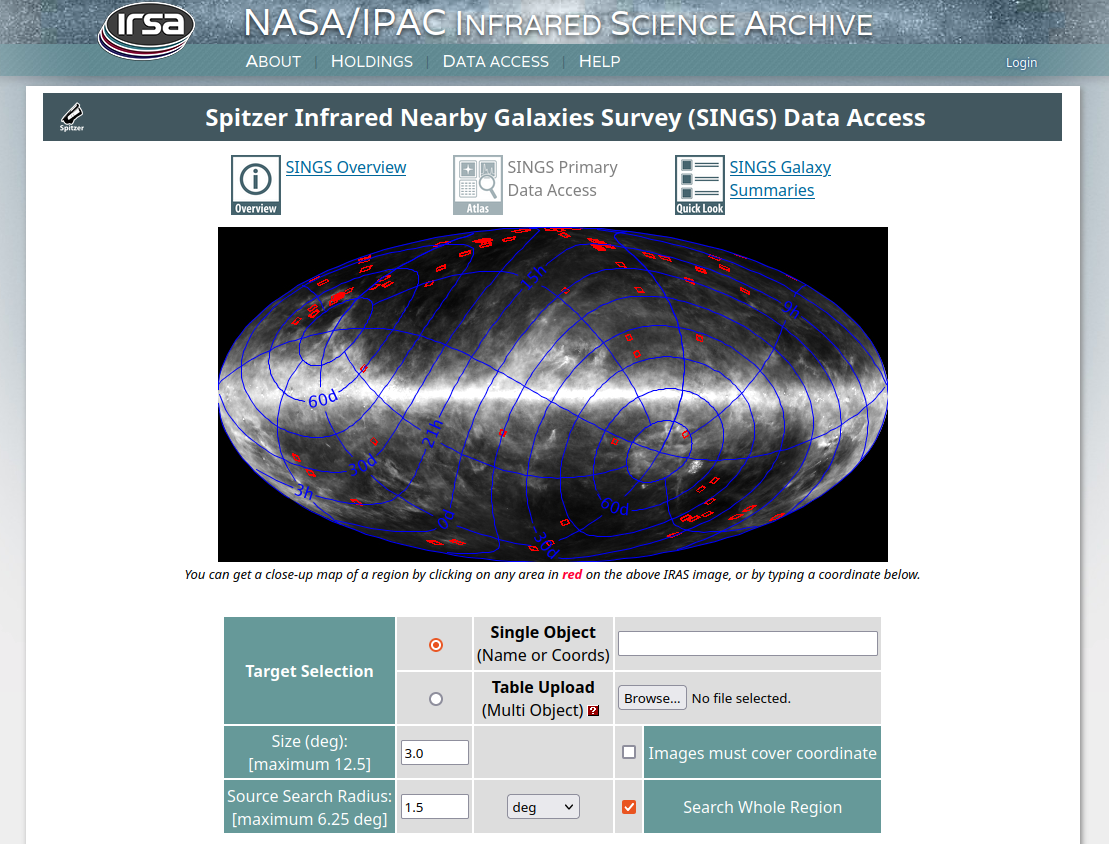
and click on the item SINGS Galaxy Summaries (at top right), you'll see a list of all the targets in the sample. I'm going to choose one called IC 2574. Clicking on its name in the list takes you to a page with a list of all the images of this galaxy. At the top are links to optical images ...
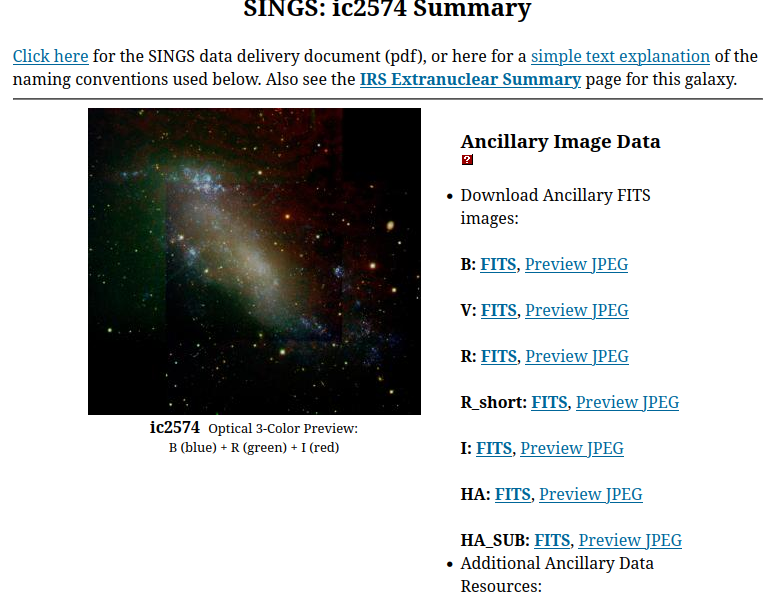
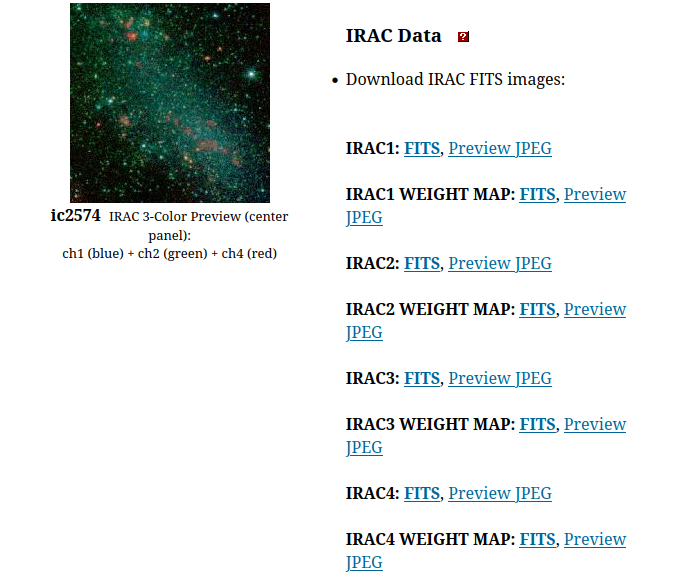
... followed by links to the IRAC near-infrared images ...
... and finally the MIPS mid-infrared images.
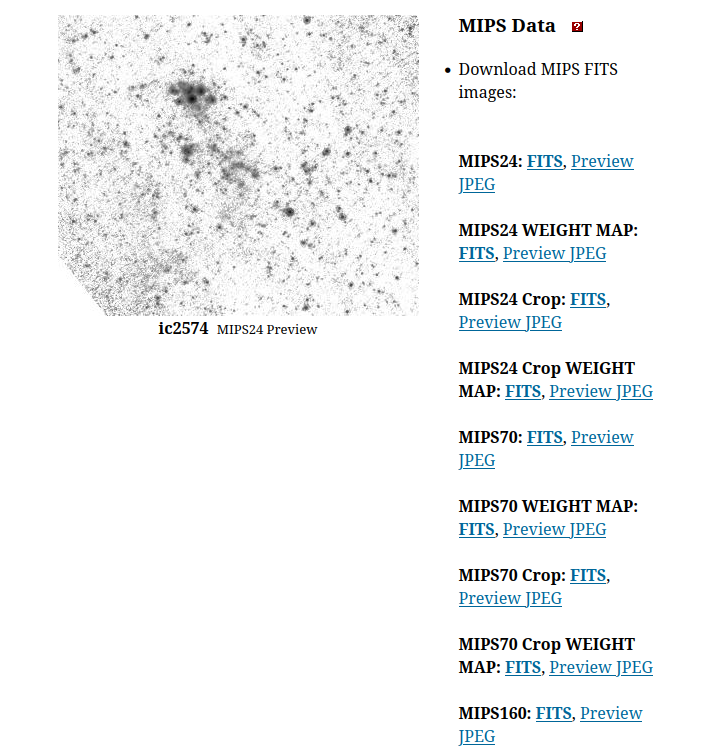
If you wish, you may click on any of these links to download JPEG or FITS versions of these images, then examine them with your favorite image-display tools. If you choose the FITS images, let me recommend the DS9 image viewer:
However, for today's work, I recommend using the tools which are built into the SINGS data archive itself; they run inside a browser and so are quick and easy to use.
I'll start by going to the main SINGS Data Access page and typing the name of my target into the "Single Object" box:
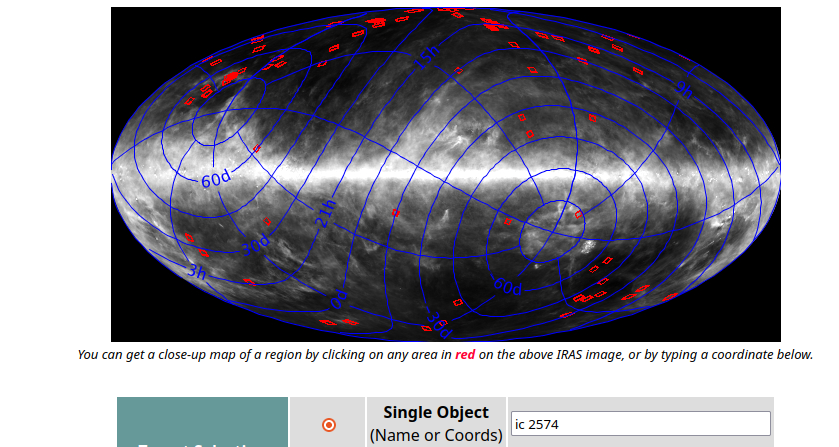
Submitting this request returns a page with information about the data on the target. Scrolling down, we see a table of the images like this:
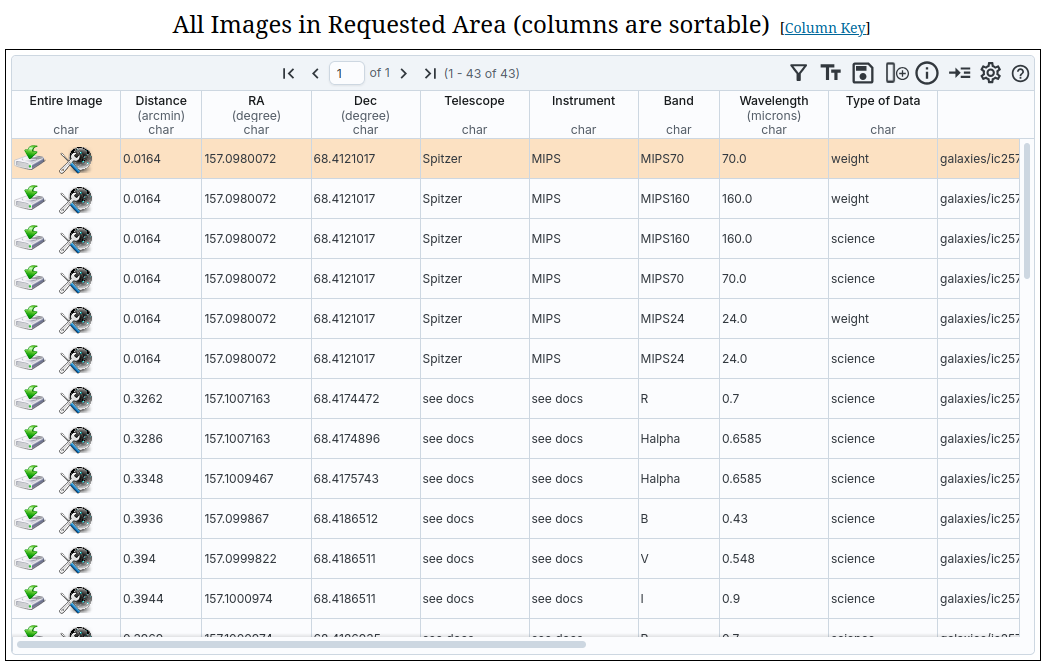
I'll choose one image to start the procedure -- the B-band one. If I click on the icon with the wrench in the B-band row (highlighted in red below) ....
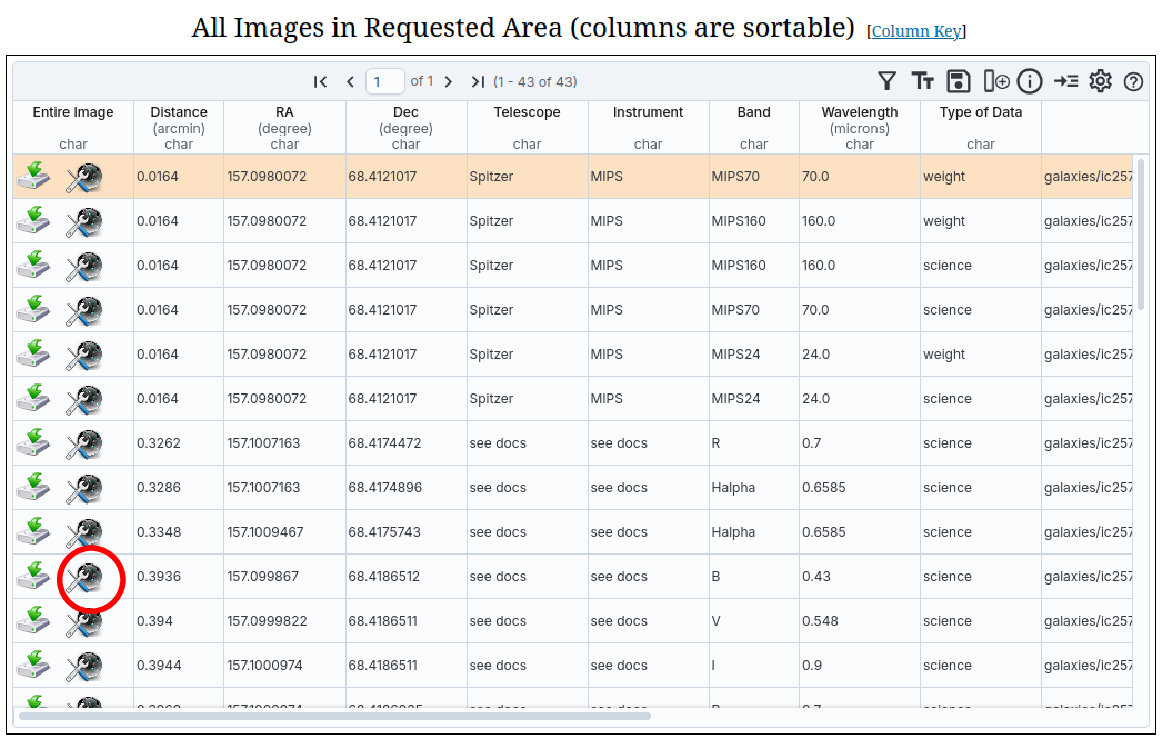
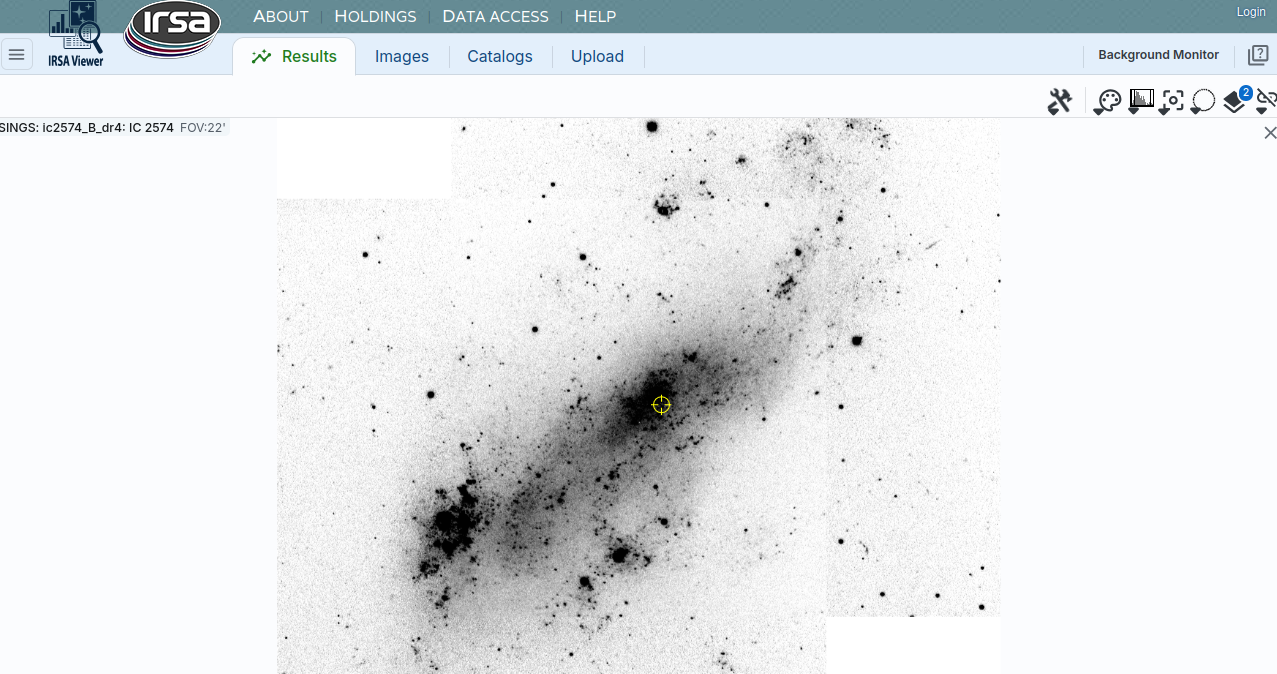
... a new tab opens in the browser with a picture of the galaxy in this optical passband. One can use the icons at top left to zoom in or out in the image, and to pan hither and yon; the icons at the top right provide tools for modifying the colormap (and some other modifications as well).
Going back to the table with the list of all the images for IC 2574, I can click on another filter's wrench icon -- this time, I'll choose the IRAC 1 (= 3.6 microns) "science" image. When I do so, the tab displaying the image now shows the view through both filters at once, side by side.
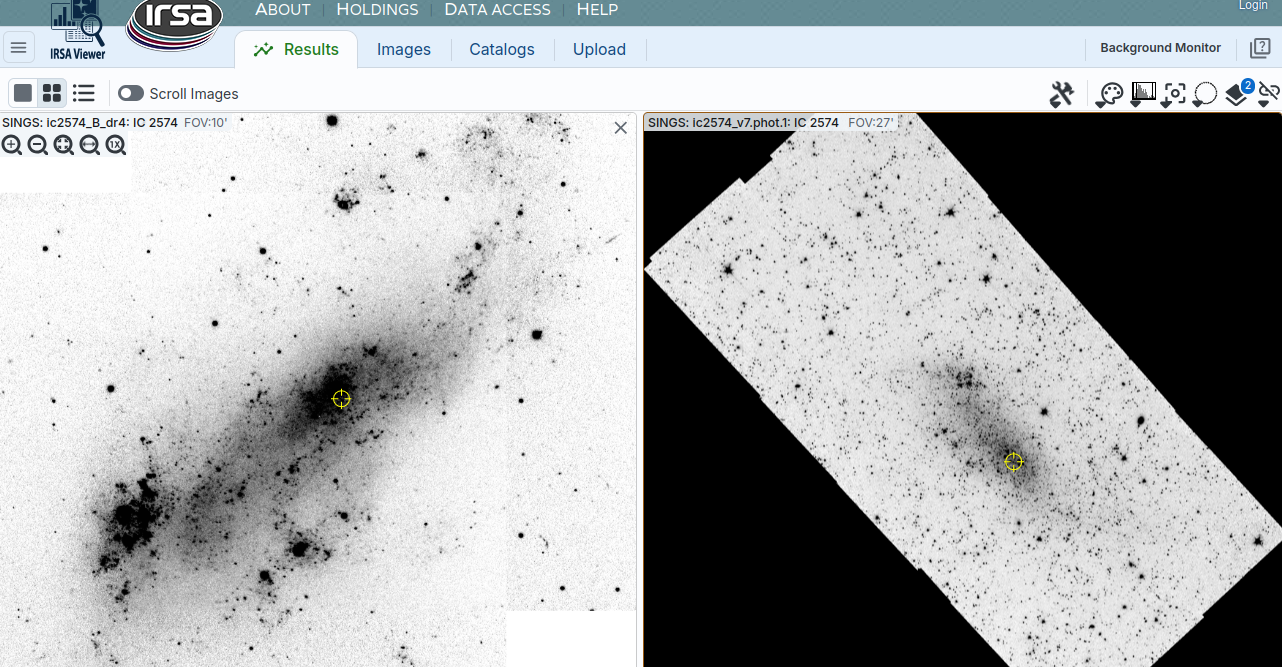
The two images may not be matched properly; they may have different scales, or rotations, or orientations. Fortunately, the right-most icon at top right pops up a window in which one may request the images to be aligned on the target ...
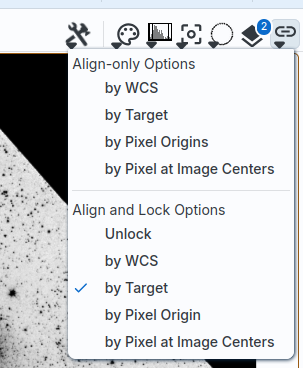
... after which the two pictures are locked together, and may be zoomed, panned, etc. as desired.
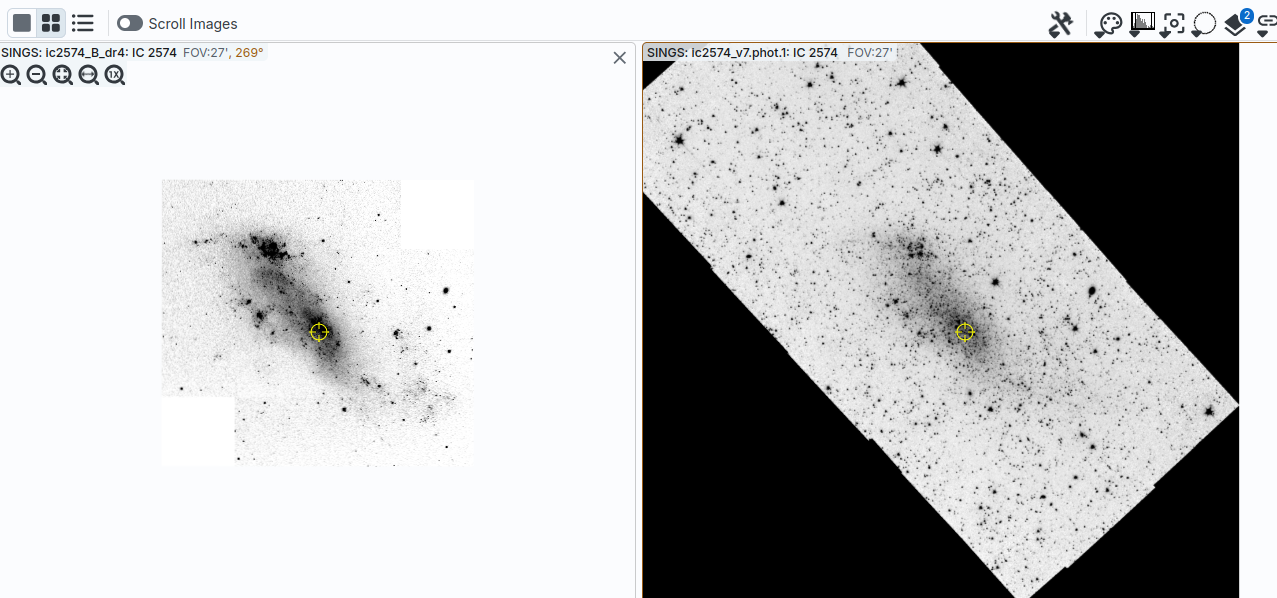
After a bit of playing with the zoom and contrast, one can compare the galaxy in the B-band (left) and near-IR 3.6-micron band (right). What can we learn?
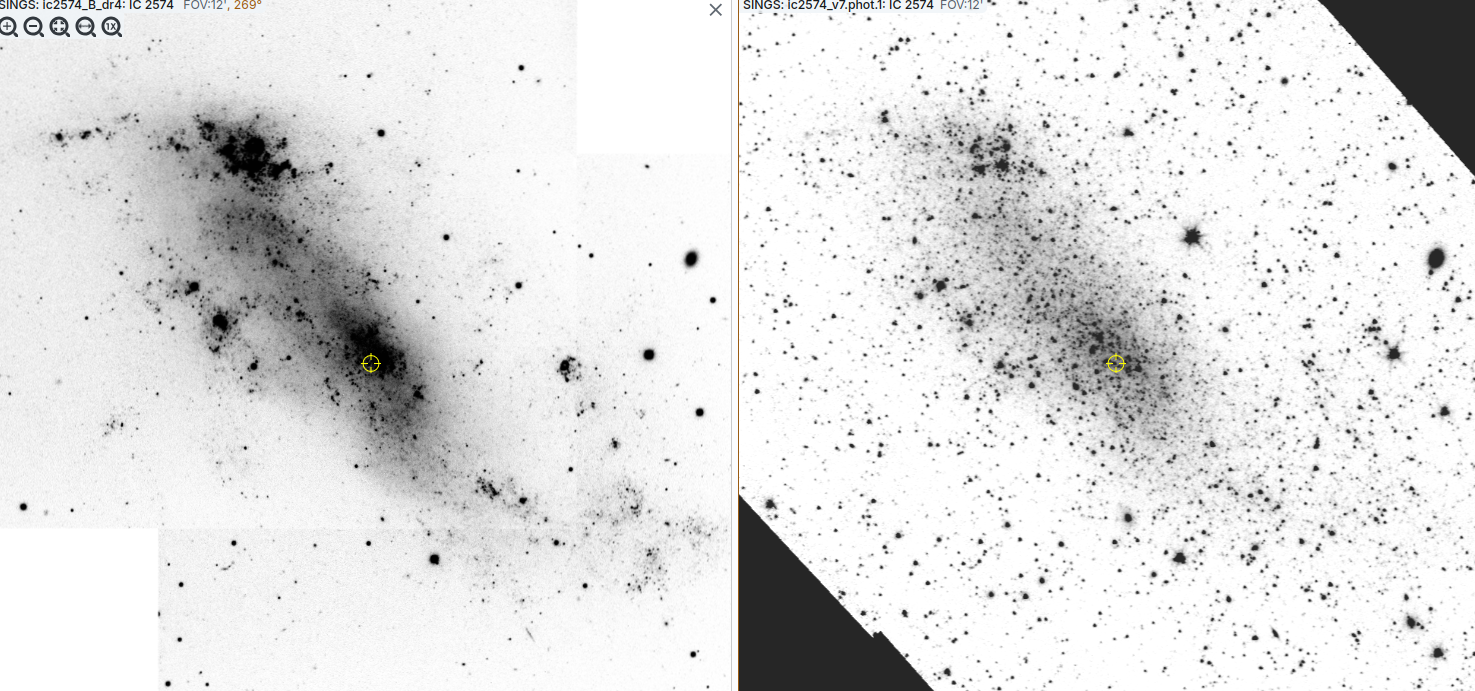
I notice a number of differences:
Suppose I add the MIPS 24-micron image to the display, at the right-hand side of the graphic below.
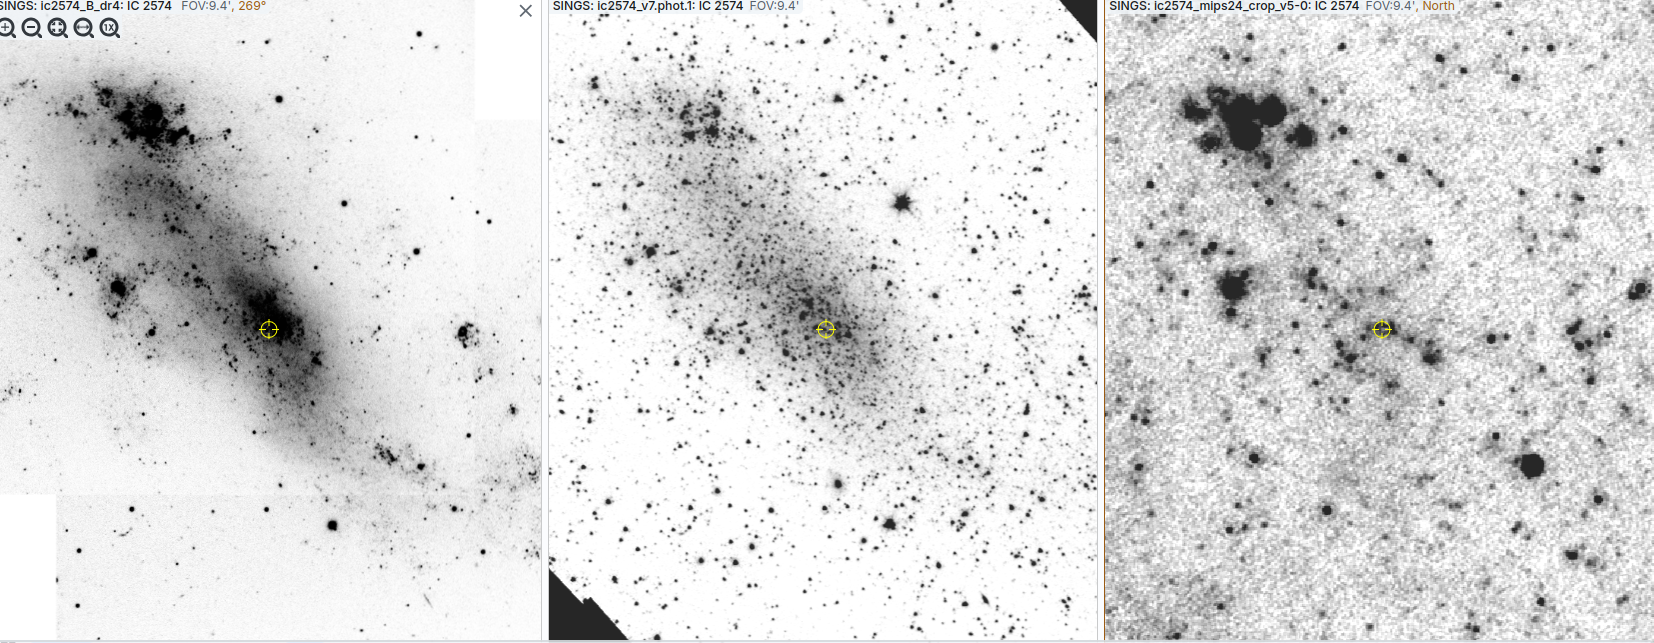
This should give you an idea for the sort of information one can glean from a comparison of images at different wavelengths.
I've demonstrated how one can display images of a galaxy at different wavelengths side-by-side using the tools at the SINGS website. Now it's your turn to do the same. Choose a galaxy from the following list:
  NGC 4552
  NGC 4579
  DDO 154
  NGC 5866
  NGC 7552
  NGC 4631
Do the following, writing down answers to all the questions in the list.
Submit your work to myCourses by the deadline (midnight Mar 5).
 Copyright © Michael Richmond.
This work is licensed under a Creative Commons License.