 Copyright © Michael Richmond.
This work is licensed under a Creative Commons License.
Copyright © Michael Richmond.
This work is licensed under a Creative Commons License.
Now that we know a bit more about the cosmological variables ΩM and ΩΛ, we can go back to the cosmic microwave background to see how it contains clues to the evolution of the universe.
When the COBE satellite made its first measurements of the microwave background, it found that the CMB had _almost_ the same brightness in every direction.

Image courtesy of
NASA / COBE
In other words, the intensity of microwaves was (nearly) UNIFORM from all locations in space. The spectrum of microwaves everywhere was consistent with a blackbody of temperature T = 2.73 Kelvin. The very, very small fluctuations that scientists finally uncovered after removing a model for the dipole (caused by Doppler shift) and for the emission by foreground gas (in our own Milky Way) were just a teeny-tiny fraction of the average intensity.
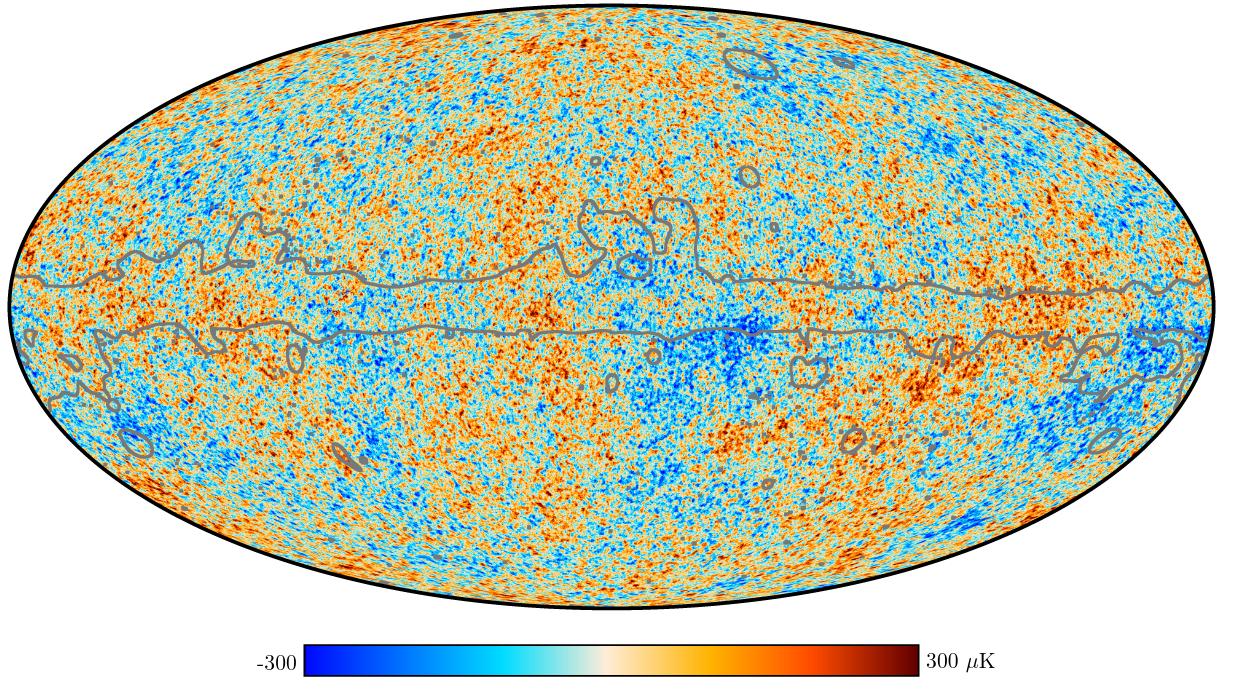
Image courtesy of
ESA and the Planck Collaboration
  Q:  How large are these fluctuations in the microwave background,
           as a fraction of the average temperature?
Yes, the fluctuations are roughly 0.01 percent of the average value. That's very, very, very small. To a very high precision, the CMB is uniform in temperature everywhere.
But that's a problem.
Why? Well, consider a simpler situation. Suppose you walk into a kitchen, and find yourself standing between a refrigerator (to your left) and a pot of boiling water (to your right).
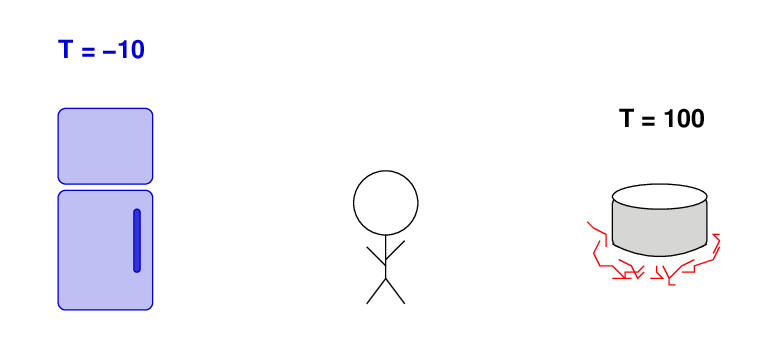
Q: Will you receive the same radiation from all directions?
No, of course not: you measure much more radiation coming from the right than from the left. The "infrared background" in the kitchen will be NON-uniform.
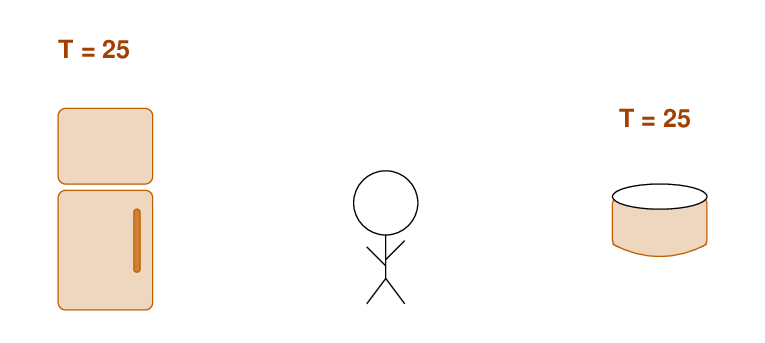
Now suppose that you turn off the heat to the stove, and you unplug the refrigerator and open its doors.
  Q:  What will happen to the temperatures of the pot of
          water and the open refrigerator?

  Q:  Why?
The hot pot on the right will radiate heat, which will travel to the refrigerator and warm it up. Over time, the pot will cool down and the refrigerator will warm up. Eventually, if you wait long enough, the two will come to a single, equilibrium, temperature.
But that levelling of the temperature can only happen if heat from the pot is transferred across the room to the refrigerator, warming it up. That might occur via radiation, which travels at the speed of light; or, in a real kitchen, by conduction via air currents, which transport heat much more slowly.
Cast your mind back to the very early universe. Back then, random fluctuations in the temperature or density of the hot gas would have caused a region here to be a few percent hotter, and a region over there to be a few percent cooler. At the time of decoupling, a region to our right might have been a bit hotter than average -- say, 3120 Kelvin; while a region to our left just a bit cooler than average -- say, 3038 Kelvin. As the universe expanded and the CMB was redshifted, the light from those regions would have travelled outward in all directions. Right now, as we observe the CMB, the light from each region will just be reaching us:

Note that the radiation from the hot region to our right has just reached us (after a voyage of 13.6 billion years); it hasn't had a chance to travel all the way to the cold region to our left yet. There has been no chance for any radiation regions on opposite sides of the sky to reach each other. In other words, areas of the CMB ought to be causally unconnected from each other: light hasn't had a chance to travel from one to the other, evening out the small temperature differences.
So the CMB ought to show much larger variations in temperature than it actually does. The fact that we do NOT see such large variations in temperature is known as the "horizon problem". In a very basic sense, how does the left-hand side of the sky "know" the temperature of the right-hand side of the sky?
Is a puzzle.
The most widely accepted solution to this puzzle is the idea of inflation. Long, long ago, just after the Big Bang, when the universe was still extremely hot and extremely dense, for some reason, the universe started to "inflate:" space expanded much more quickly than normal. When I write "much more quickly", I mean "exponentially more quickly:" space itself increased in size so quickly that it carried all the matter and radiation with it at speeds that were much faster than the speed of light.
Imagine that the same sort of inflation occured within our kitchen. We'll add a second observer to the kitchen, one who is originally enclosed within the pot of water (don't worry, he has a hat).

As inflation begins, objects (including observers) are carried away from each other.
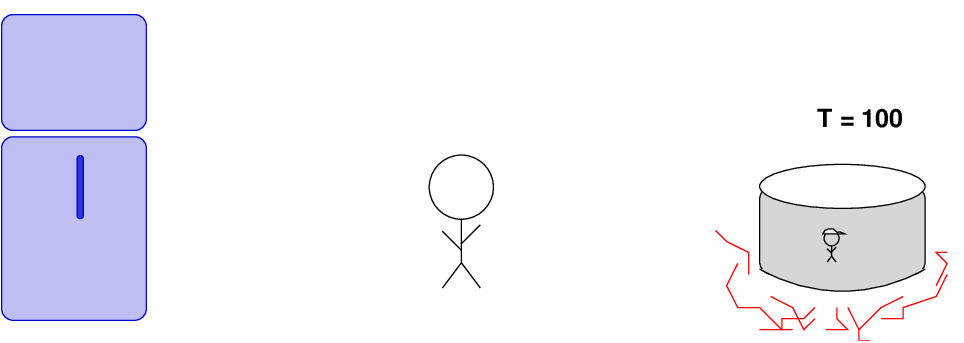
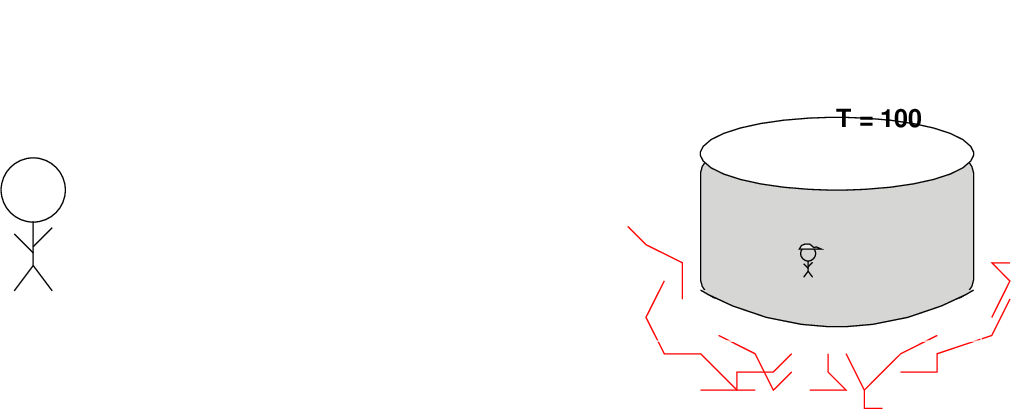
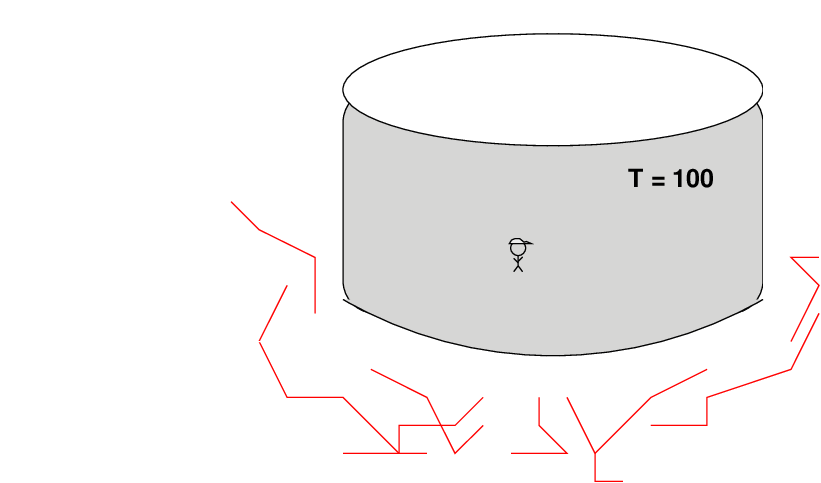
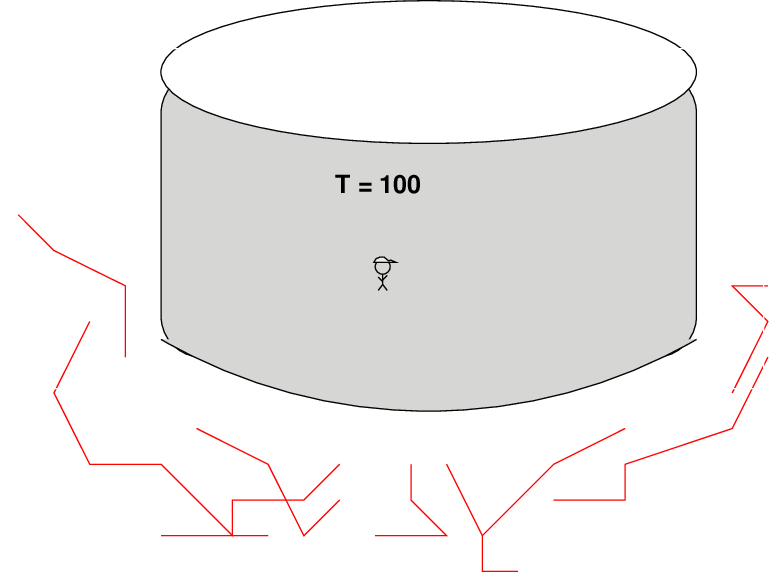
The observer-with-a-hat would find himself isolated in a now-giant volume which was ORIGINALLY a very small region of space, small enough that light could travel across it and bring all the material to a single temperature. All the regions which had different temperatures would be shoved far away from him, so far away that he couldn't see them any more. His entire visible "universe" would now be a very uniform temperature.
This inflation can be seen in many of the schematic diagrams of the history of the universe, as a very sharp increase in size just after the Big Bang.
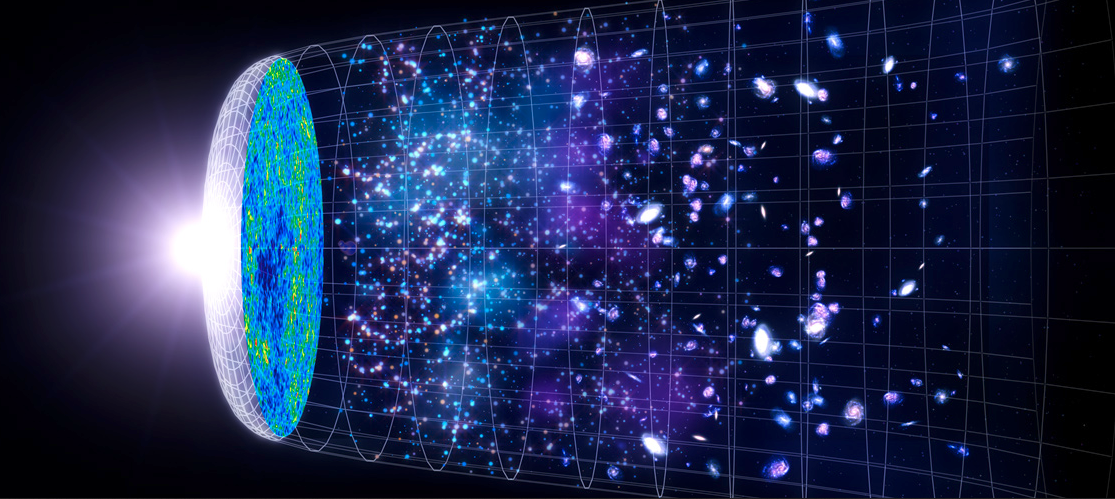
Image courtesy of
NASA's Goddard Space Flight Center.
You may recall that the total energy density of the universe
determines the large-scale curvature of space.
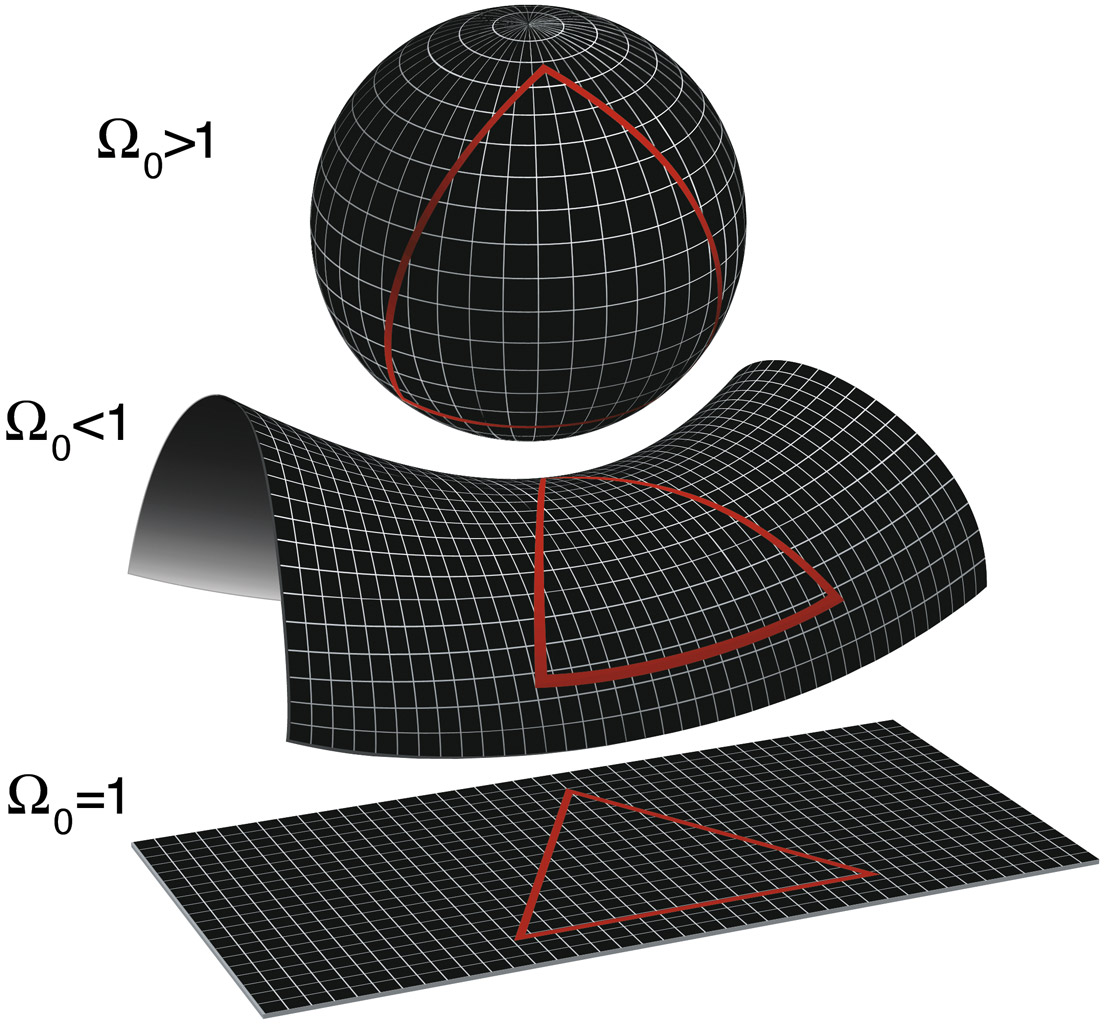
Images courtesy of
NASA / WMAP Science Team
As we saw last time, using supernovae (or other "standard candles") to try to determine the value of ΩΛ is very difficult. Is there any other way to find out the value of this mysterious cosmological constant?
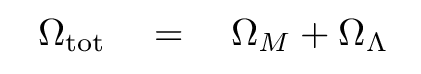
Indeed there is! The CMB provides a good method for finding the total energy density Ωtot; and once we know that, we can subtract away our best estimates of ΩM in order to yield a value for ΩΛ.
All we have to do is to measure the small fluctuations in the CMB very carefully, at high enough angular resolution that we can determine the location of each little hot or cold spot precisely. The Planck satellite did a very nice job of that.
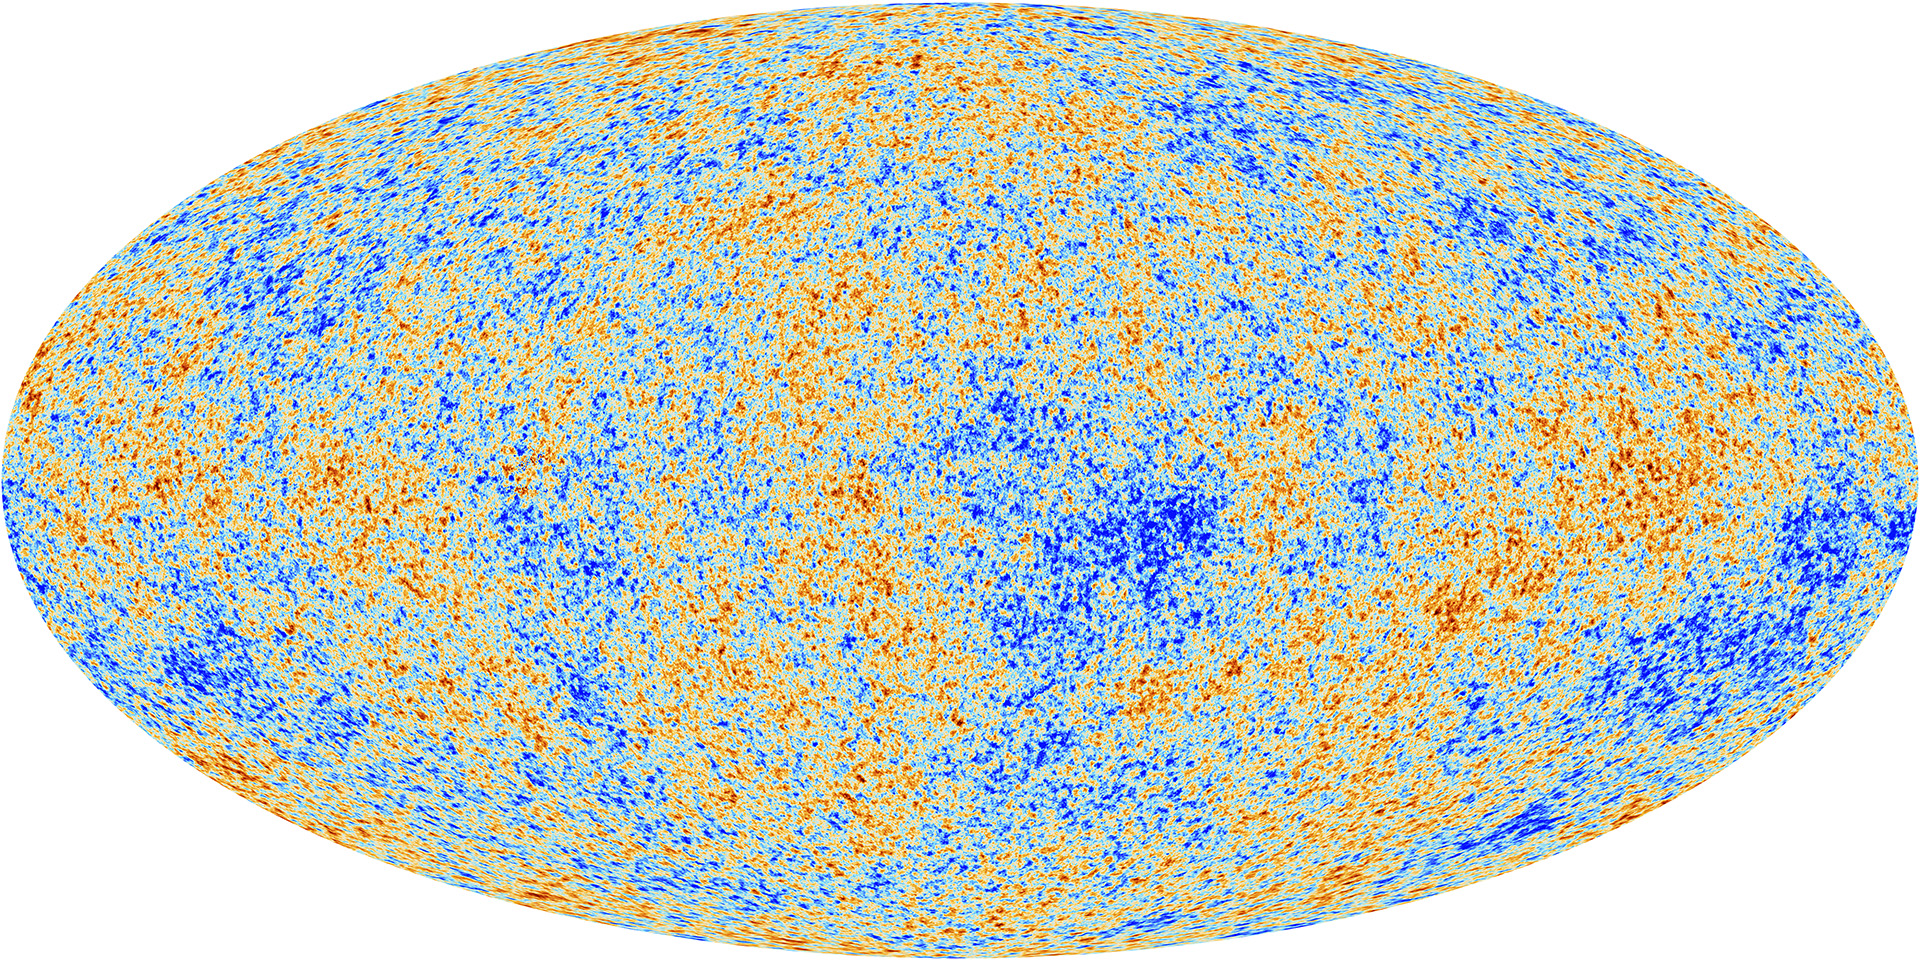
Image courtesy of
ESA/Planck Collaboration
The light emitted from the hot gas in the early universe had to travel billions of light years to reach us here on Earth. As the light rays moved through space over such large distances, they would follow geodesics (shortest paths) in that space; if the space happened to be curved in some way, the light rays would follow that curvature, modifying our eventual view of the hot and cool spots. Click on the image below to watch a short animation illustrating the process.
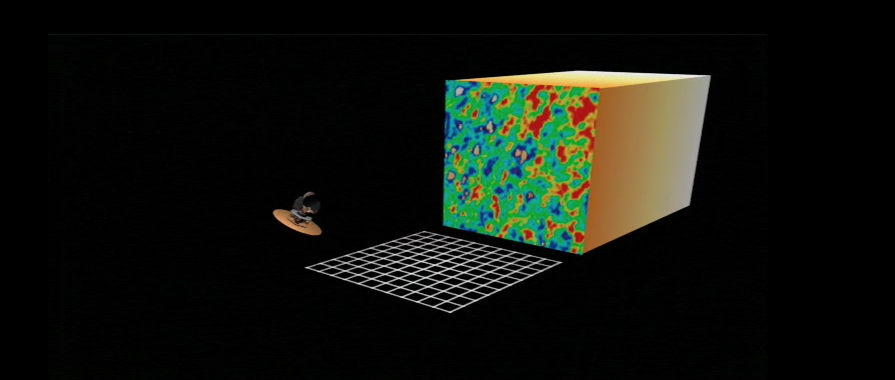
Image and movie courtesy of
NASA / WMAP Science Team
The angular size of these spots will depend on the curvature of space.
One way to measure the angular size of the spots is to compute the power spectrum of 2-D CMB image, which quantitatively expresses variation on different size scales. The angular size of the FIRST peak in the power spectrum is very sensitive to the curvature of space.
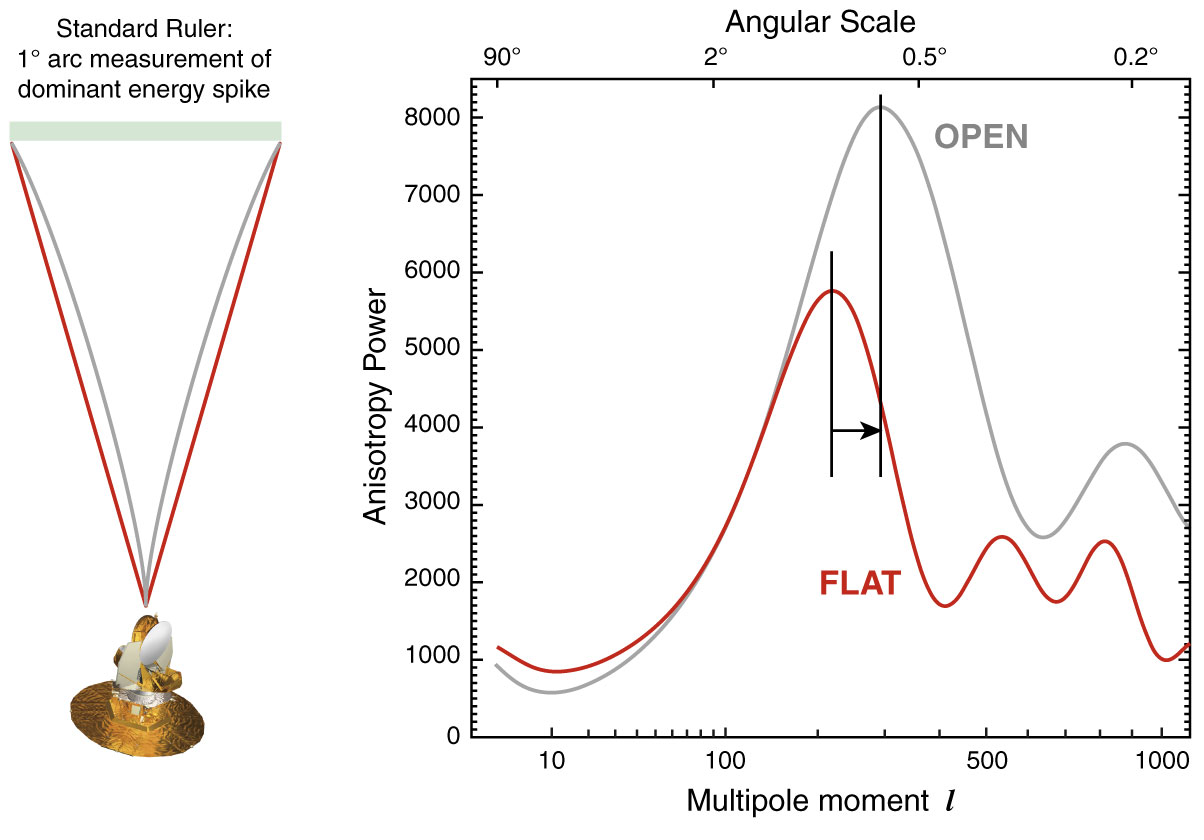
Image courtesy of
NASA / WMAP Science Team
And what do we find? In the figure below, the measurements are shown as red circles, and a model with ΩM = 0.315 and ΩΛ = 0.685 as a green line.
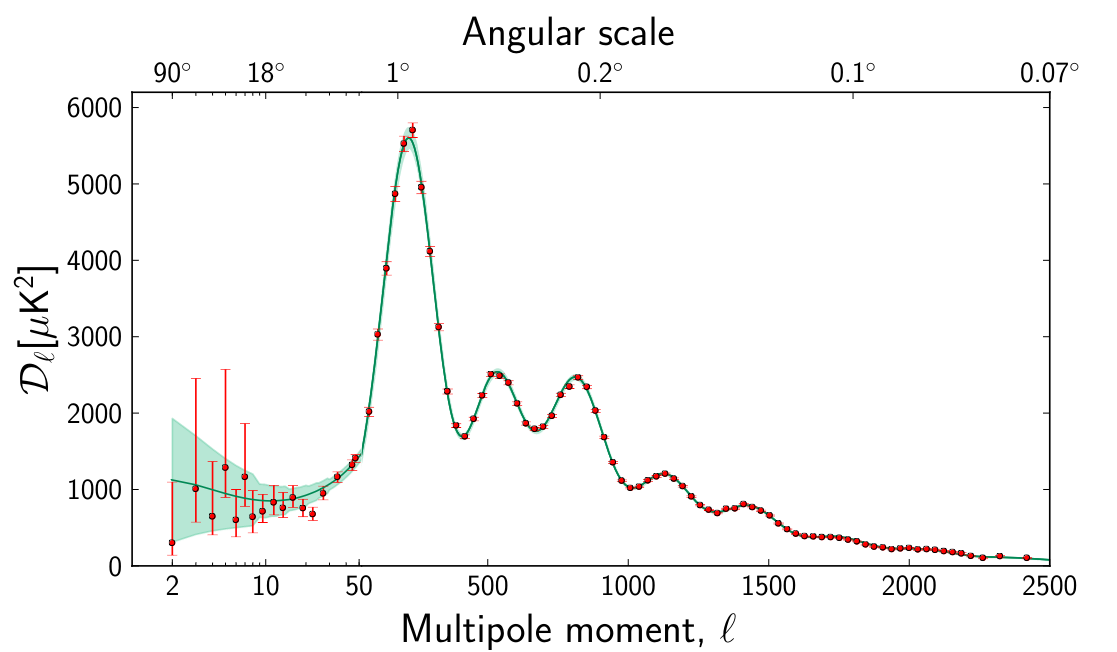
Figure 20 taken from
Planck collaboration, A&A, 571, 1 (2014)
  Q:  What is 0.315 + 0.685?


  Q:  What does that imply about the curvature of the universe?
The bottom line is that the position of the first peak in the CMB power spectrum is strong evidence that the universe is geometrically flat on very large scales.
So the location of the first peak in the CMB power spectrum is related to the overall curvature of space. But it's not the only peak that matters. According to our theory of acoustic oscillations of the plasma in the early universe, we should see other peaks, too; and the locations of those other peaks should have very particular values.
The basic theory that the fluctuations in the CMB are due to acoustic oscillations in the hot, dense, plasma filling space -- cycles of compression and expansion, powered by sound waves travelling through the plasma -- makes a very clear prediction.
The prediction, therefore, is that we should see NOT ONLY many hot (or cool) spots separated by some particular angle in the CMB, corresponding to the distance d (which turns out to be about 1 degree); but that we should also see a bunch of hot (or cool) spots which are separated by EXACTLY HALF of that distance, d/2.
  Q:  If this idea of acoustic oscillations is correct, then where
           else -- at what other angular separation -- should see a peak
           in the power spectrum of the CMB?
Figure 20 taken from
Planck collaboration, A&A, 571, 1 (2014)
Well, look at that. The is a second, smaller peak in the power spectrum at an angle which is exactly half that of the first peak.
In fact, the theory of acoustic oscillations predicts that there should additional peaks corresponding to regions of space which have gone through more cycles of expansion and contraction, (1.5 cycles, 2.0 cycles, 2.5 cycles, etc.). Those additional peaks should appear at angles which are integral fractions of the angle of the first peak. And that's what we see.
So, another thing we can learn from the CMB: the theory of acoustic oscillations is supported by more evidence.
So the location of the second (and third, and fourth, and successive) peaks in the CMB power spectrum is strong evidence in favor of acoustic oscillations in the early universe. But that's not all the second peak can tell us!
It turns out the the AMPLITUDE of this second peak has a strong connection to the amount of baryonic matter in the universe. To be more precise, the amplitude of the second peak RELATIVE TO the amplitude of the first and third peaks can tell us about the baryonic content of that early plasma.
Remember that, back before decoupling, the plasma was filled with a number of different items:
Before decoupling, all of these particles interacted with each other via different forces: all of them pulled on each other via gravity, and all but the dark matter also collided with each other via the electromagnetic force. There was also a special force shared by the baryonic matter alone -- the strong nuclear force.
All of these forces and interactions contributed to the properties of each little region of space: its pressure and temperature and density. It turns out, for reasons that are too complex for me to explain, that acoustic oscillations were affected in a particular manner by the fraction of all the material which was baryonic matter. As Wayne Hu explains in one of his cosmology tutorials, a larger fraction of baryonic matter will enhance the first and third peaks of the power spectrum, while decreasing the relative amplitude of the second peak. (Click on image to animate)

Animation courtesy of
Wayne Hu's excellent "Intermediate Guide to the Acoustic Peaks and Polarization"
By examining the relative amplitudes of the first, second, and third peaks of the observed power spectrum,
Figure 20 taken from
Planck collaboration, A&A, 571, 1 (2014)
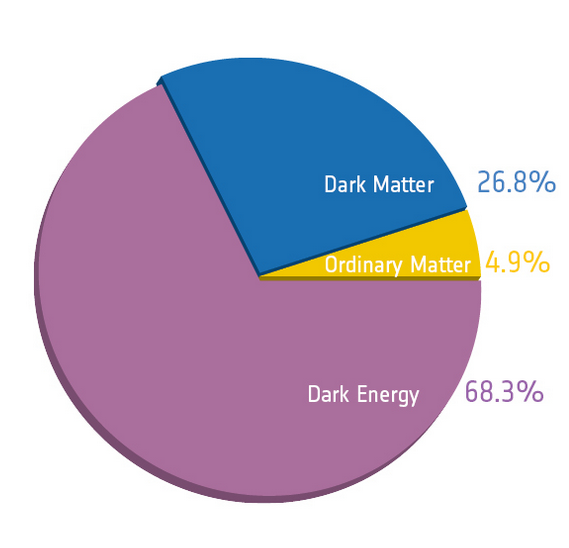
the Planck collaboration was able to determine that the fraction of the critical energy density contributed by baryonic matter is Ωbaryon = 0.049.
Let's review all the various items that contribute to this energy density.
Copyright © Michael Richmond.
This work is licensed under a Creative Commons License.