 Copyright © Michael Richmond.
This work is licensed under a Creative Commons License.
Copyright © Michael Richmond.
This work is licensed under a Creative Commons License.
Today, we take a walk through the history of measurements of the sky at wavelengths of a few millimeters. We'll concentrate on pictures of this radiation over the entire sky -- maps, in other words. That's only a portion of the story, of course, but we'll discuss power spectra next time.
In the nineteen fifties, Bell Laboratories was trying to figure out how to send information more effectively across long distances. One possibility was to transmit data via radio waves, bouncing them off balloons floating high in the atmosphere. Bell Labs built a big radio transmitter/receiver in Holmdel, New Jersey, to test this idea.
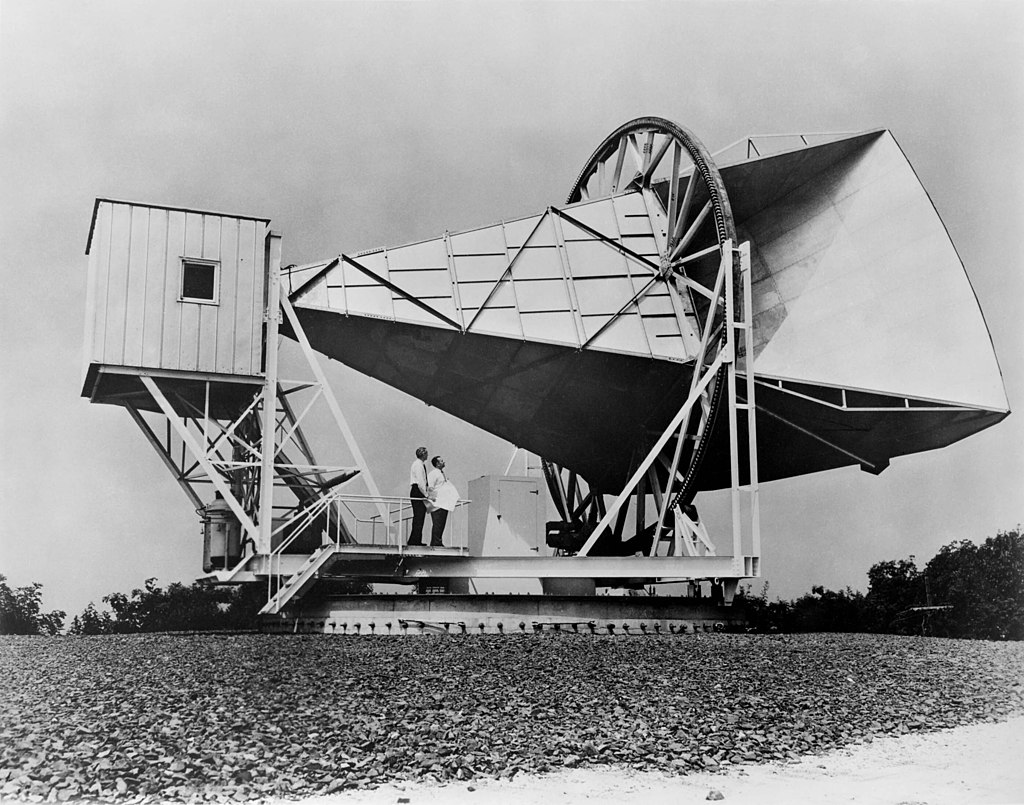
Image of Holmdel antenna courtesy of
Wikipedia
and
NASA
Several years after it was built, a rival company launched a set of satellites, which proved much more effective for radio transmission. The balloon idea was scrapped, and the radio horn was turned over to a pair of scientists for astronomical research.
Arno Penzias and Robert Wilson started to use the antenna to study radio emission from the Milky Way in 1962. They soon discovered that there was an annoying source of noise, like static, which contaminated their measurements. It didn't seem to be related to manmade sources of radio waves, or the Sun, or any planet, or any celestial source they could identify. In desperation, Penzias and Wilson scared away the pigeons which were nesting in the antenna, and scraped out all the guano (eeeewwwww), hoping that it might be the source of the static. But they couldn't get rid of the noise.
Meanwhile, just a short distance away, in Princeton, New Jersey, physicist Robert Dicke and his colleagues had a theory about the evolution of the universe. Their theory predicted that the universe should be filled with faint radio waves, coming from all directions. They called this the cosmic microwave background. In the early sixties, the scientists at Princeton started to build radio antennas and receivers to look for this radiation.
In 1965, Penzias came across an article by Dicke, and realized that the "static" in the Bell Labs antenna might be this cosmic microwave background. The two groups got together, shared their results, and published a pair of papers in the Astrophysical Journal. Penzias and Wilson described their measurements of the "static" with their antenna, and the Princeton scientists interpreted their measurements in terms of their theory.
Penzias and Wilson were awarded the Nobel Prize in Physics in 1978 for their discovery. Dicke received nothing. Oh, well.
Can we see the microwave background from the surface of the Earth? Hmmm.
   The spectrum of the CMB looks like a blackbody with a temperature
   T = 2.73 Kelvin.

      Q:  What is the wavelength of the peak of this spectrum?
Look at this graph of the transmission of the Earth's atmosphere. Could we see the peak of the spectrum from the ground?
![]()
Data provided by
CSO Atmospheric Transmission Interactive Plotter
Yes, we can see some of radiation around the peak wavelength, but we certainly can't see shorter wavelengths. Moreover, the transmission varies on short timescales (hours and even minutes) due to changes in the humidity of the air, so making a reliable map from the ground is very difficult. For this reason, astronomers have placed a number of special microwave telescope into space in order to the study the CMB.
The first dedicated multi-year space mission was the COsmic microwave Background Explorer = COBE, launched by NASA in 1989.
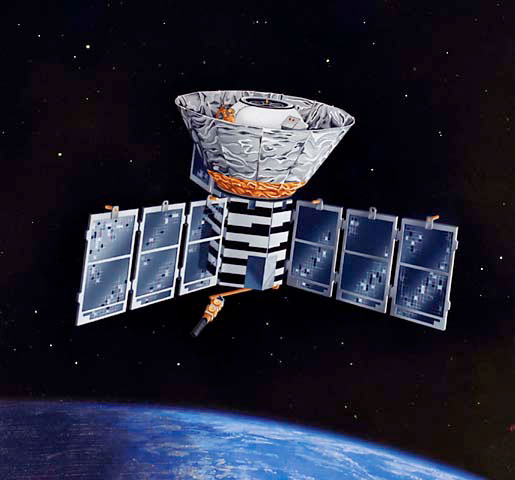
Image courtesy of
NASA / COBE Science Team
It spent 4 years in orbit around the Earth measuring microwaves from the entire celestial sphere; eventually, its liquid helium coolant ran out and it had to cease operations, But during that time it made the first very detailed maps of the microwave background, and measured the spectrum of the radiation, too.
Let's look very briefly at the spectrum of the radiation, as determined by COBE's FIRAS instrument. Is the spectrum really consistent with that of blackbody radiation? Judge for yourself: in the graph below,
Q: Can you tell the difference between theory and observations?

Image courtesy of
NASA / COBE Science Team
Now, there really is a small difference, as one can see by subtracting the theory from the observations and examining the residuals.
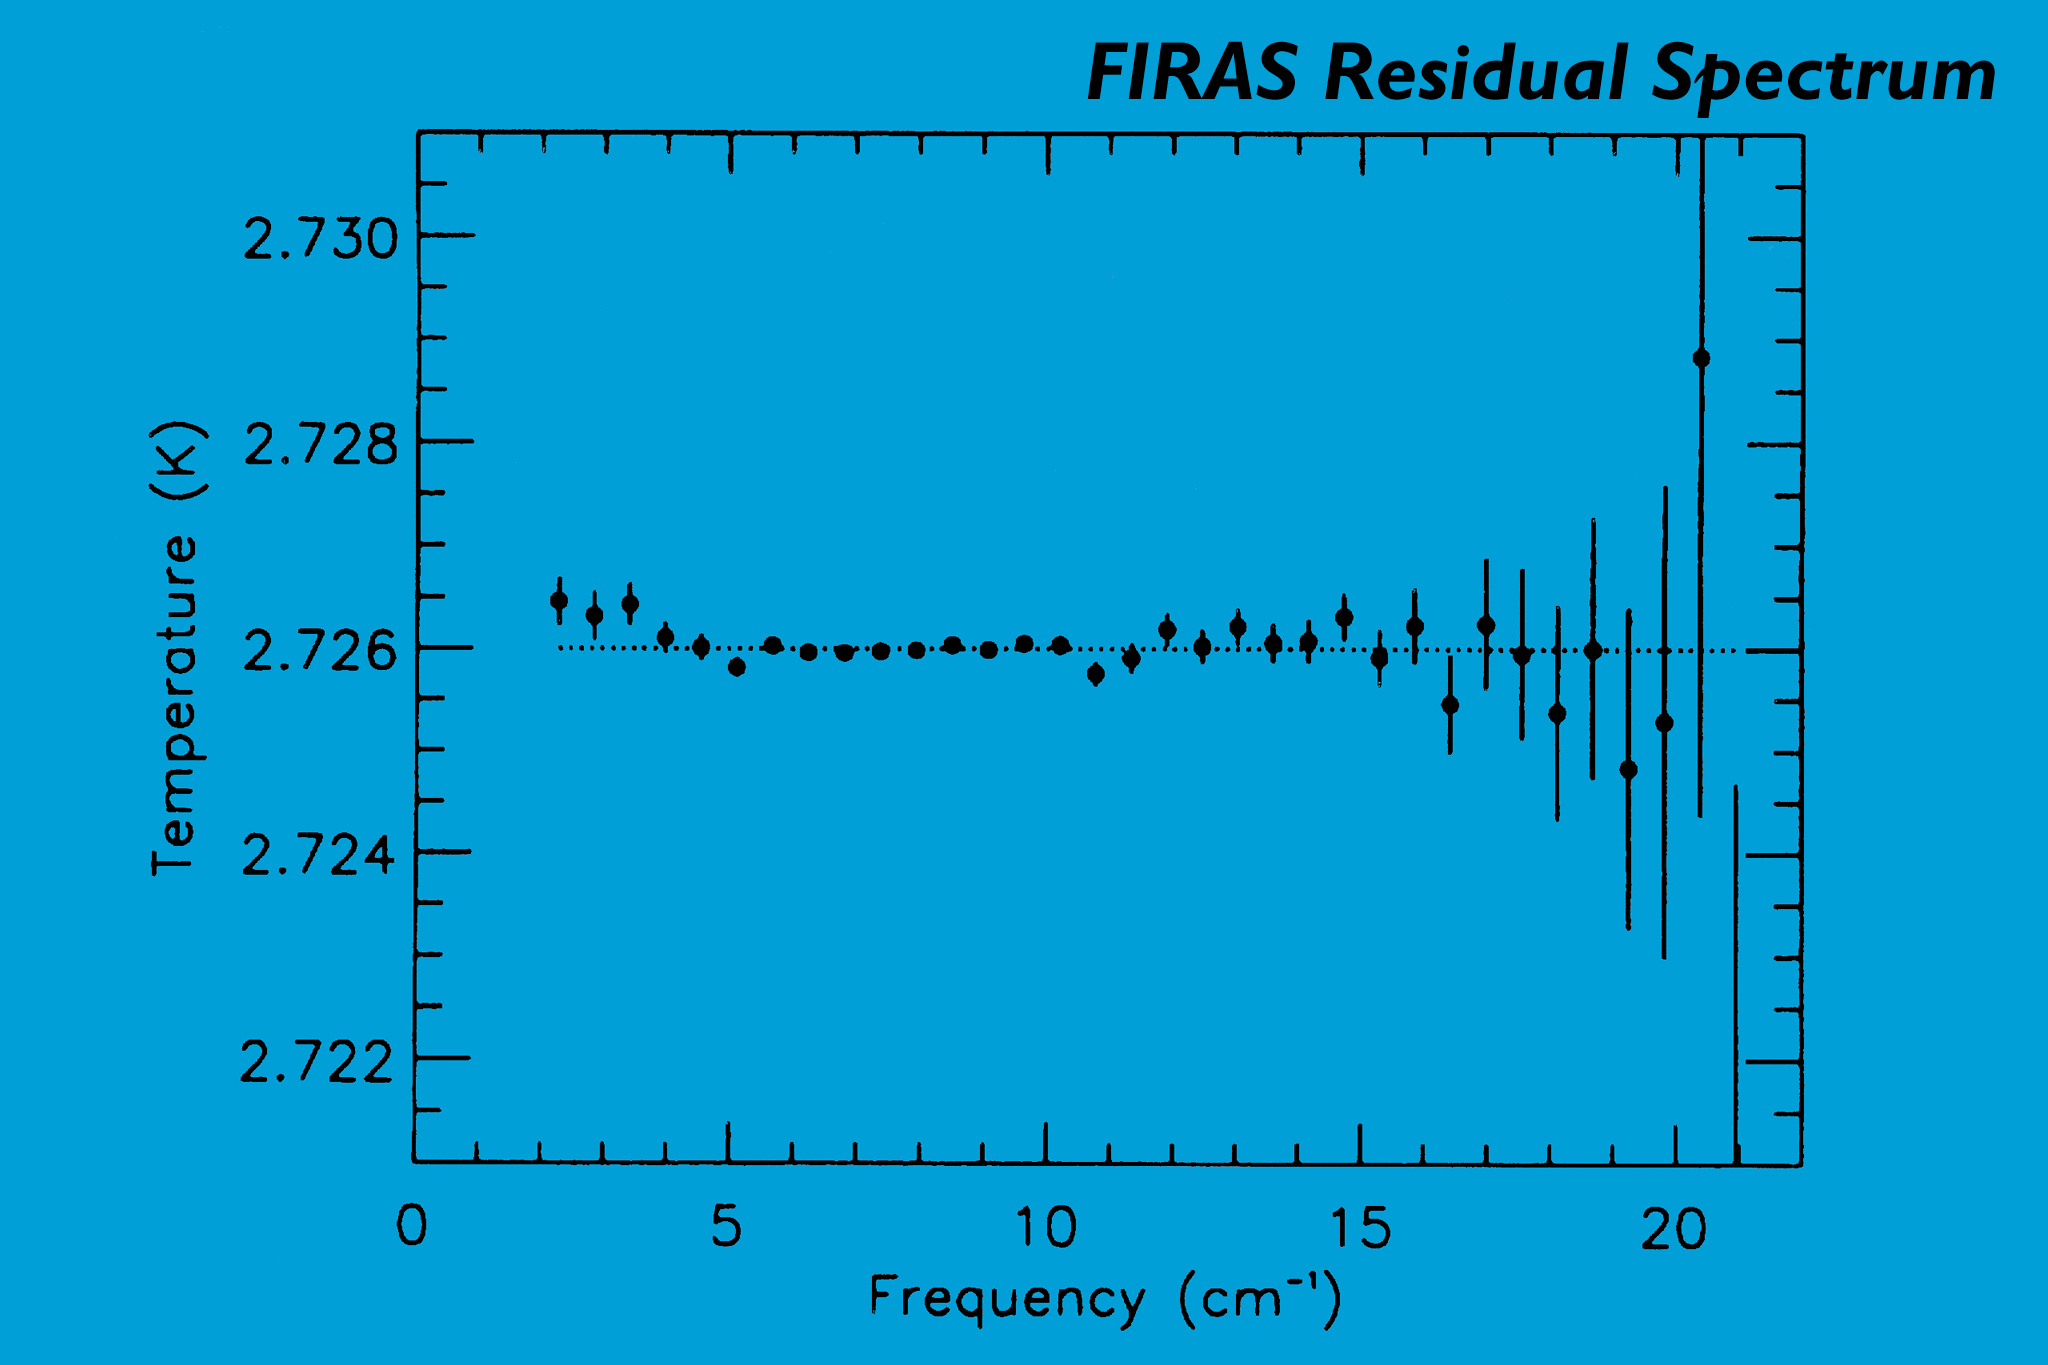
Image courtesy of
NASA / COBE Science Team
Okay, enough about the spectrum of this radiation; let's look at some of the maps. The pictures below are based on data collected by one of COBE's instruments, the Differential Microwave Radiometer (DMR). We'll start with the "raw" data, and work our way down to the cosmic background contribution.
Image courtesy of
NASA / COBE Science Team
Note how small the variations in brightness are in the bottom image: 18 micro-kelvin = 0.000 018 Kelvin, compared to the raw maps brightness of 2.73 Kelvin. These are VERY small variations in intensity.
   Q:  Does the pattern in the bottom panel look familiar?  Have you
           ever seem a similar pattern in pictures of the astronomical
           sky?
Yes, of course you have. This map (and almost all the maps you'll see of the CMB) are drawn in galactic coordinates, so that the plane of the Milky Way Galaxy runs right across the middle of the picture. So, what the bottom panel shows us is NOT the "cosmic" microwave background, but the microwaves emitted by gas in our own Milky Way Galaxy.
Arrgh.
In order to see the more subtle features due to the very distant background, we need to make a model of the radio emission from gas in our Galaxy and subtract that from this picture. For that reason, the instruments on COBE were designed to acquire data over a range of different frequencies (or wavelengths). By comparing the images at different wavelengths, and computing how radio emission from gas in our Milky Way was likely to change with frequency, astronomers could make a reasonable model of the galaxy's contributions at any frequency.

Image courtesy of
NASA / COBE Science Team
The bottom panel in the graphic below shows the COBE map after a model of the dipole, and a model of the Milky Way's emission, have been removed. That bottom panel FINALLY shows us the pattern of microwaves reaching us from the far, far, reaches of the universe.

Image courtesy of
NASA / COBE Science Team
The center of the map suffers too much from contamination by the Milky Way for us to trust the measurements left after the model was subtracted, so it must be left blank. Rats. But the sky above the plane, and below the plane, can be seen clearly and reliably. The pictures below show the northern and southern halves of the celestial sphere.

Image courtesy of
NASA / COBE Science Team
What do we see?
The takeaway is that some of the gas filling the universe soon after the Big Bang was a little bit denser (those are the hot spots) than average, and some regions were a little bit less dense.
Since COBE, two other space missions devoted to the cosmic microwave background have been launched.
Each took advantage of advances in detector and telescope technology to make improved maps of the CMB, focusing in particular on better spatial resolution.
Let's consider WMAP first. One of the major improvements over the COBE results is due to its much more sophisticated detectors. The COBE instruments were basically one pixel: they recorded the intensity of radiation in a region about 7 degrees in diameter. WMAP's detectors were slightly more numerous, consisting of between one and four "pixels" on the focal plane (depending on the frequency). The important point is that the optics focused light into a much narrower beam: instead of covering a 7-degree diameter region on the sky, the detectors on WMAP measured radio waves from a region about about 0.5 degrees!
As a result, the maps made by WMAP show much smaller details; and, as a bonus, the sensitivity has improved by a factor of about 45, too. Compare these all-sky maps from COBE to those of WMAP.

Image and movie courtesy of
NASA/WMAP Science Team
  Q:  Does the WMAP data confirm the reality of the large-scale
          brightness variations detected by COBE?
Yes, very nicely. One can see the same large region of "darker-than-average" near the center, and the same large region of "brighter-than-average" at the right-hand edge of the celestial equator.
WMAP also measured the polarization of the microwaves, which can provide additional information about the physical properties of the early universe.
Just as WMAP was finishing its nine-year mission in space, the European Space Agency lauched its own CMB satellite, called Planck.

Image courtesy of
ESA
On the focal plane of Planck was a sizeable array of detectors: the large ones measure long wavelengths (27 - 77 GHz = 11.1 - 3.9 mm), and the smaller ones short wavelengths (84 - 1000 GHz = 3.6 - 0.3 mm). These instruments, together with the sophisticated optical elements, allowed Planck to reach a spatial resolution even higher than that of WMAP: at the highest frequencies (shortest wavelengths), the satellite's FWHM was 4.6 arcminutes = 0.077 degrees.
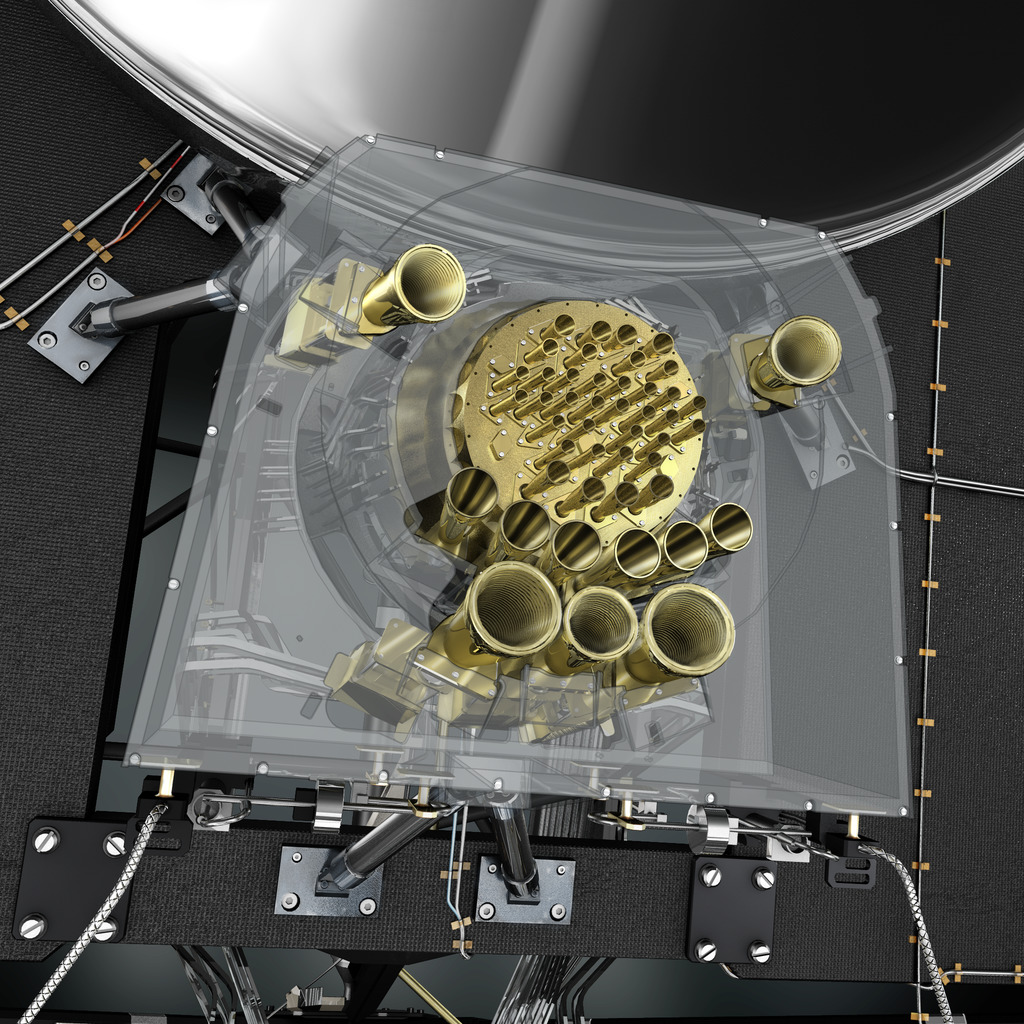
Image courtesy of
ESA/AOES Medialab
Like all their predecessors, Planck's scientists had to perform a series of complicated reductions to remove all the "foregrounds" and "contaminations" in the data. After subtracting the large dipole pattern, their all-sky images over a wide range of wavelengths looked like this:
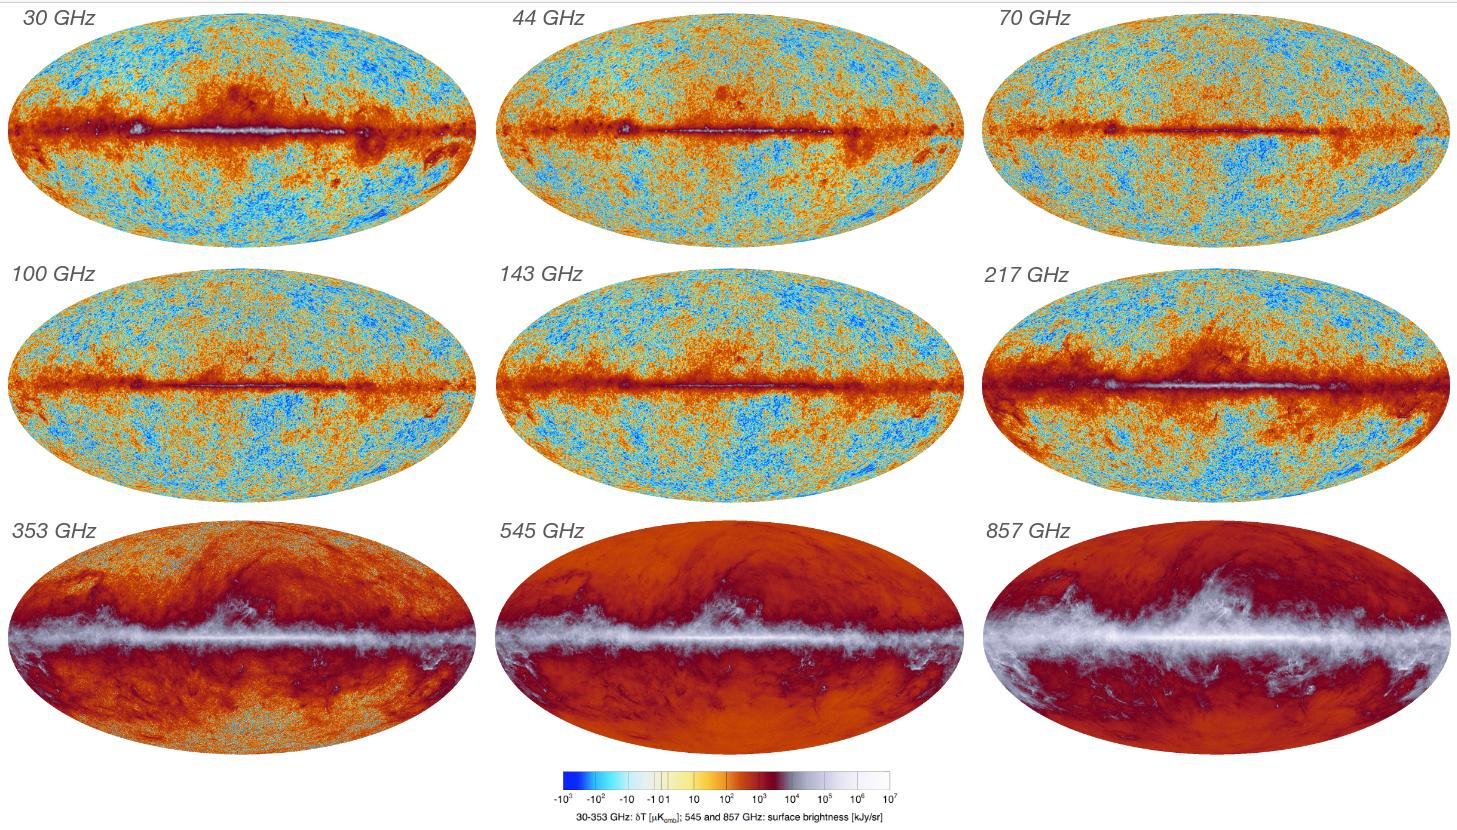
Image courtesy of
ESA and the Planck Collaboration
The Planck team then made a model of radio emission from the Milky Way and subtracted that, leaving the very faint features of the cosmic microwave background.
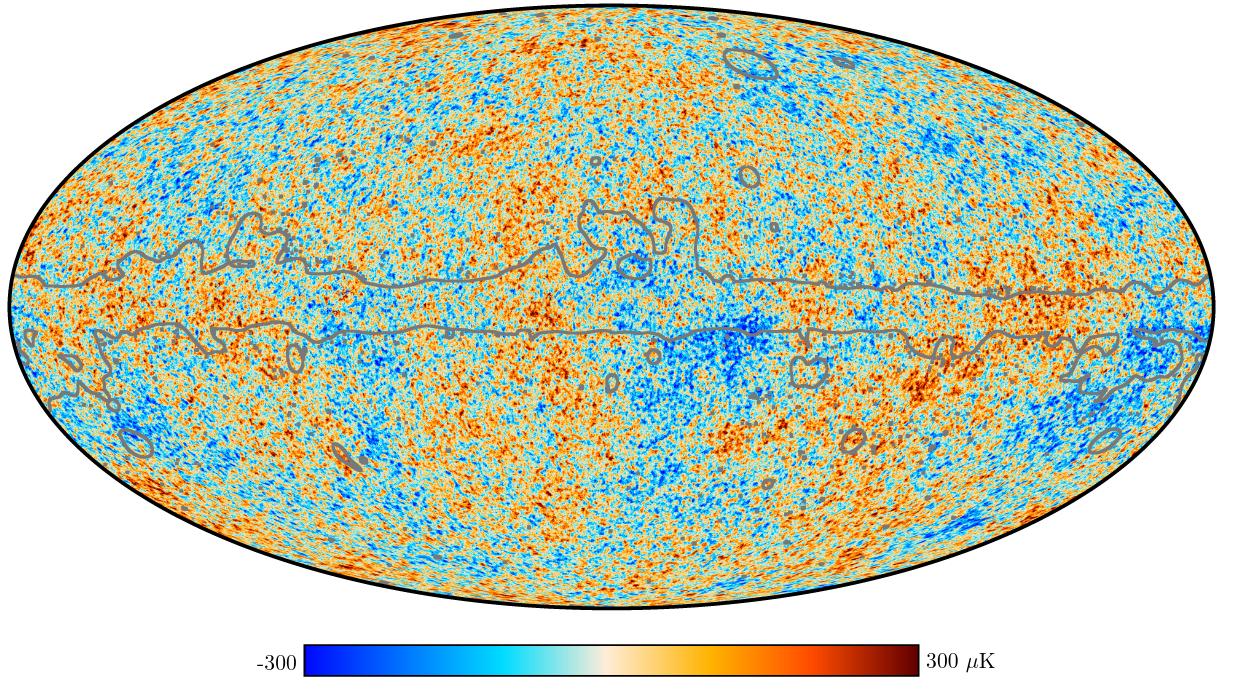
Image courtesy of
ESA and the Planck Collaboration
  Q:  Do you still see a region of lower-than-average brightness
            near the center of the map?
Yes, it's still there.
The technology used to detect microwaves has advanced rapidly over the past decade, pushing researchers to find ways to use it quickly -- without waiting years and years for another satellite mission to be approved and built and launched. Building and testing new instruments on the surface of the Earth is much, much cheaper, and much faster as well. There have been quite a few ground-based CMB experiments in the recent past; you can find a list in
We'll look at just one of these projects, the Atacama Cosmology Telescope (ACT), which just ended its 15-year operational lifetime in 2022. As its name suggests, the ACT is located high on the plateau of the Atacama Desert in Chile, at an altitude of 5190 meters.
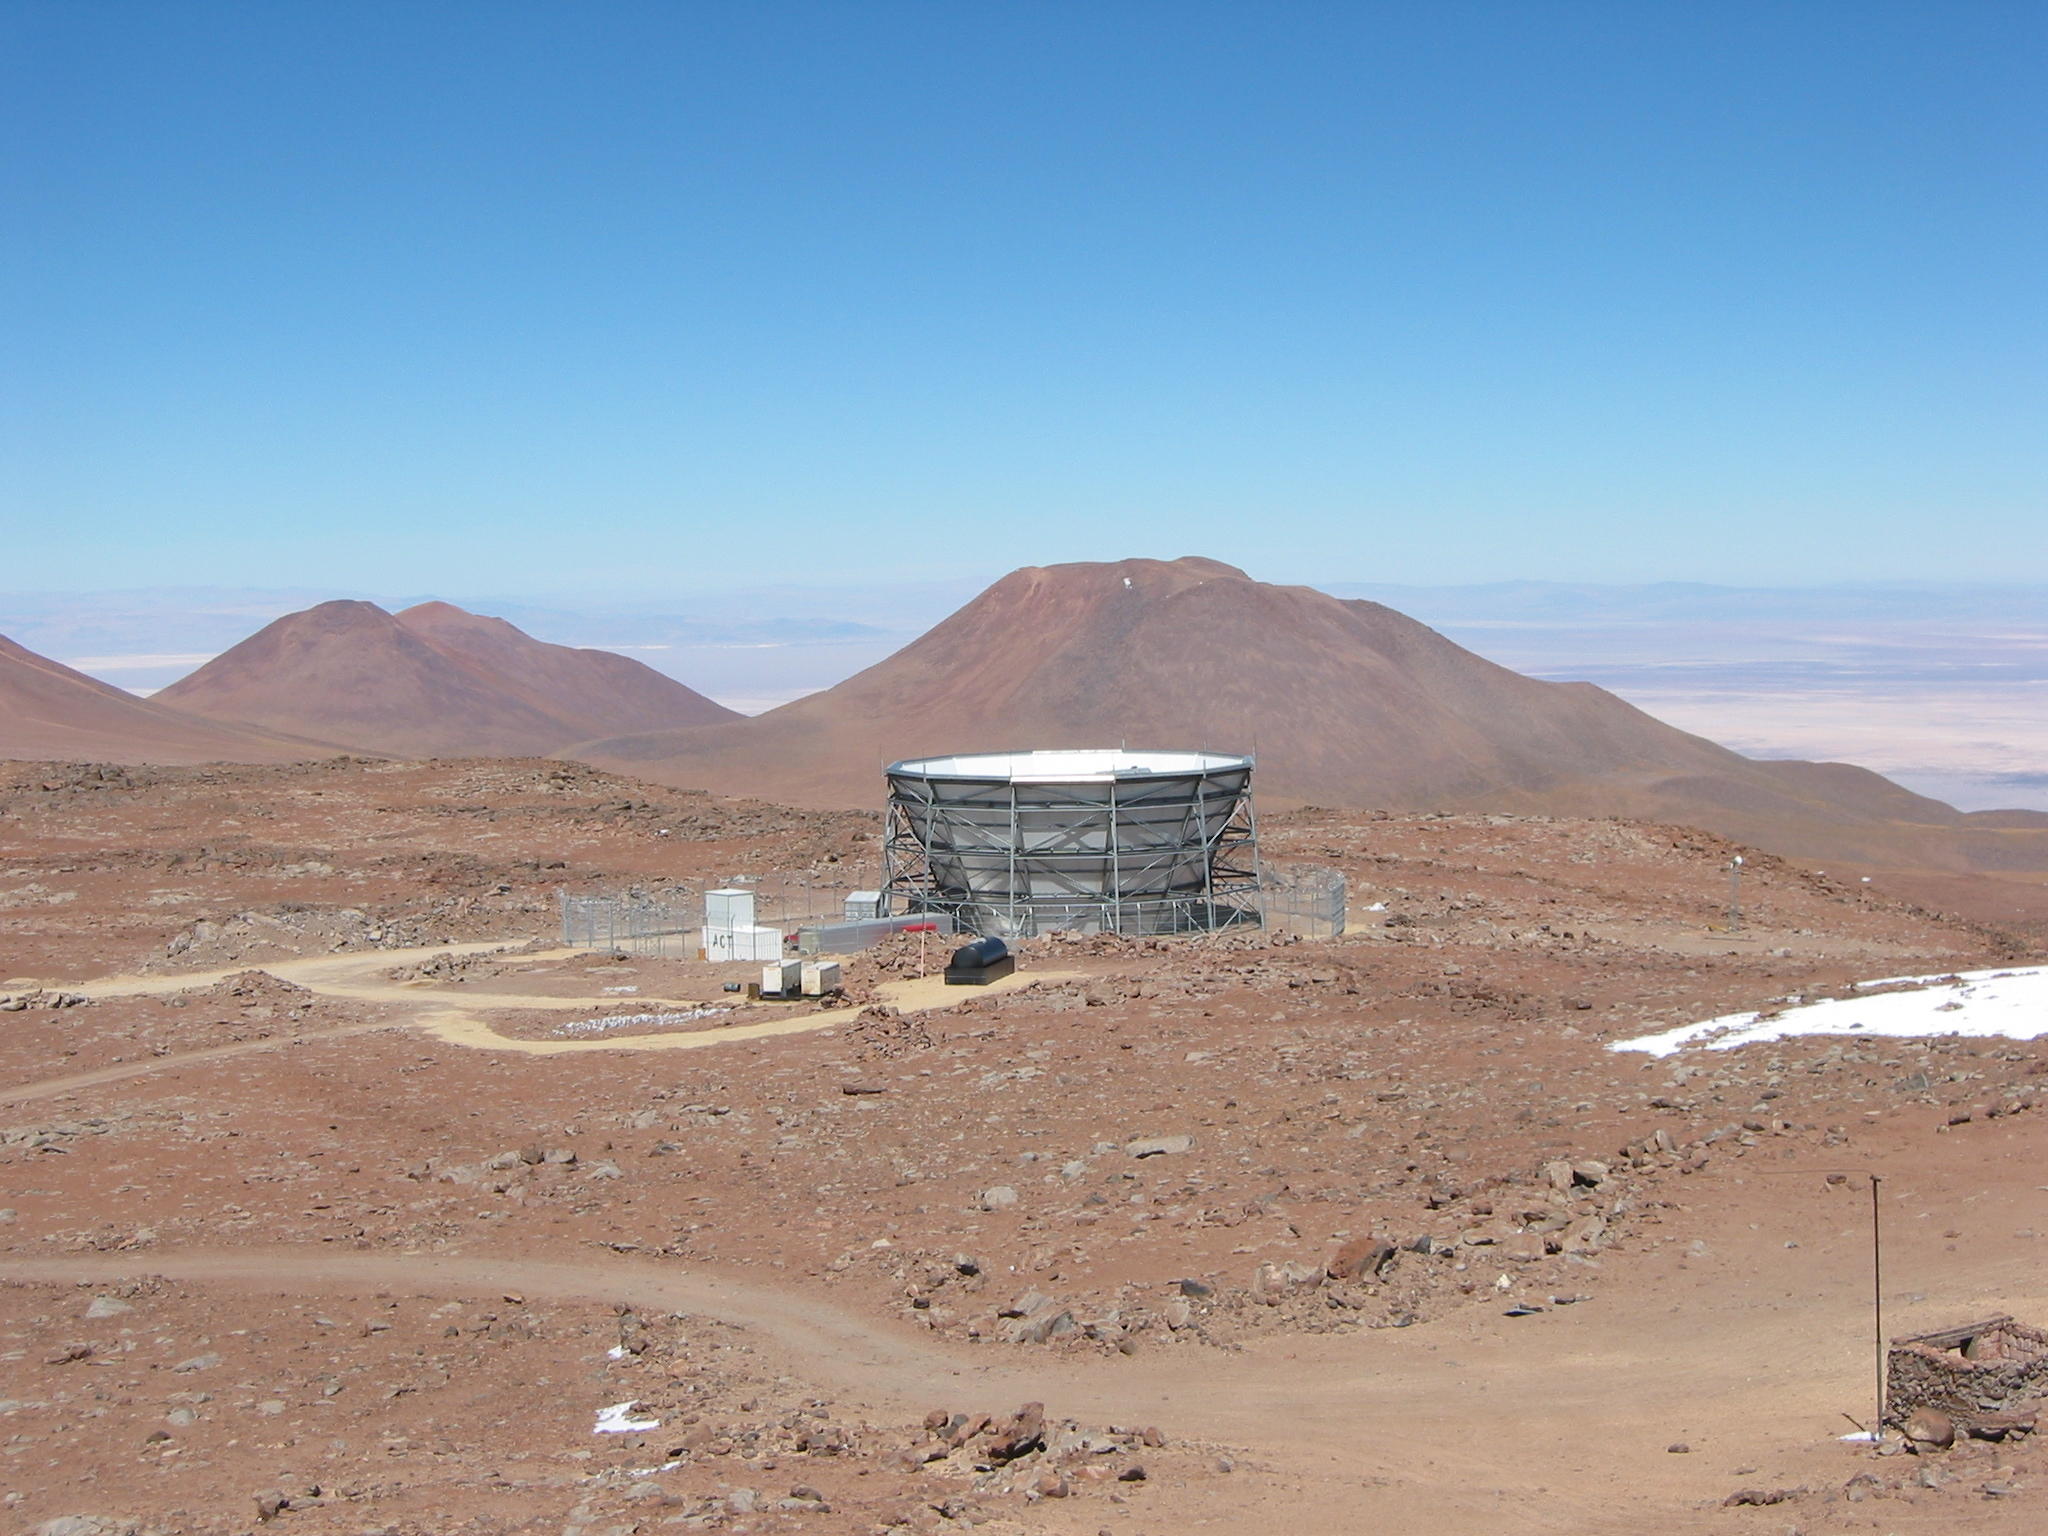
Image courtesy of
NIST
Q: Why is this telescope located in such a remote and dangerous environment?
To avoid as much water vapor as possible, of course.
The telescope is surrounded by a set of exterior walls, or baffles, in order to prevent it from seeing radiation from the ground around it.

Image courtesy of
Debra Kellner
That baffle reminds me a lot of COBE's baffles!
Image courtesy of
NASA / COBE Science Team
Inside the baffles is the telescope itself, which has a diameter of 6 meters.
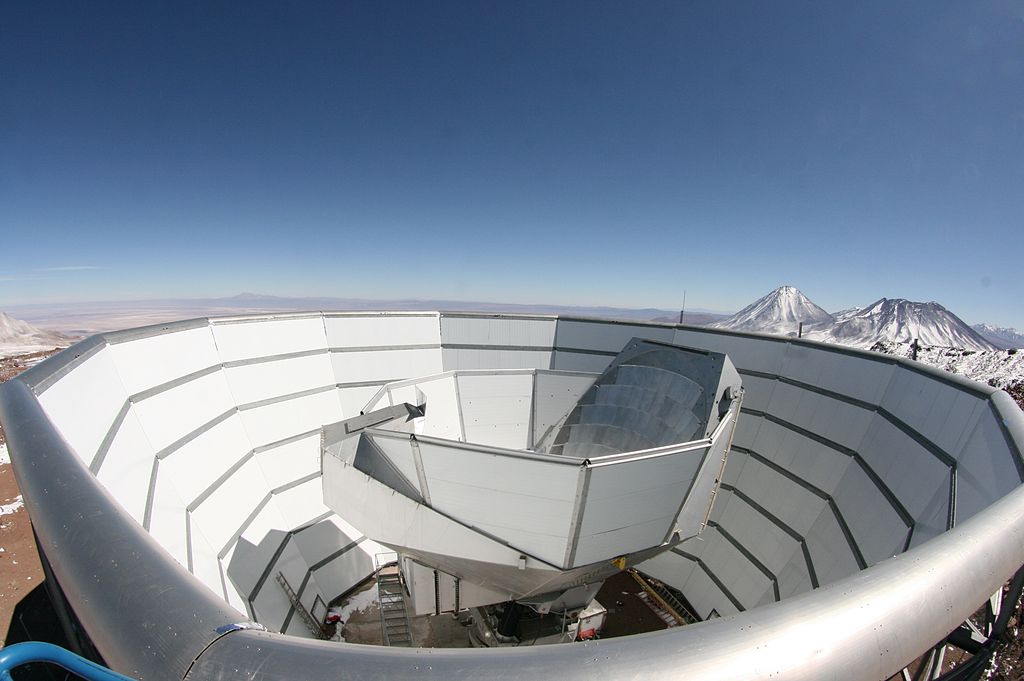
Image courtesy of
Wikipedia and M. Devlin
The final camera mounted inside the ACT was the AdvACT, which had a very large number of detectors arranged in a large mosaic.
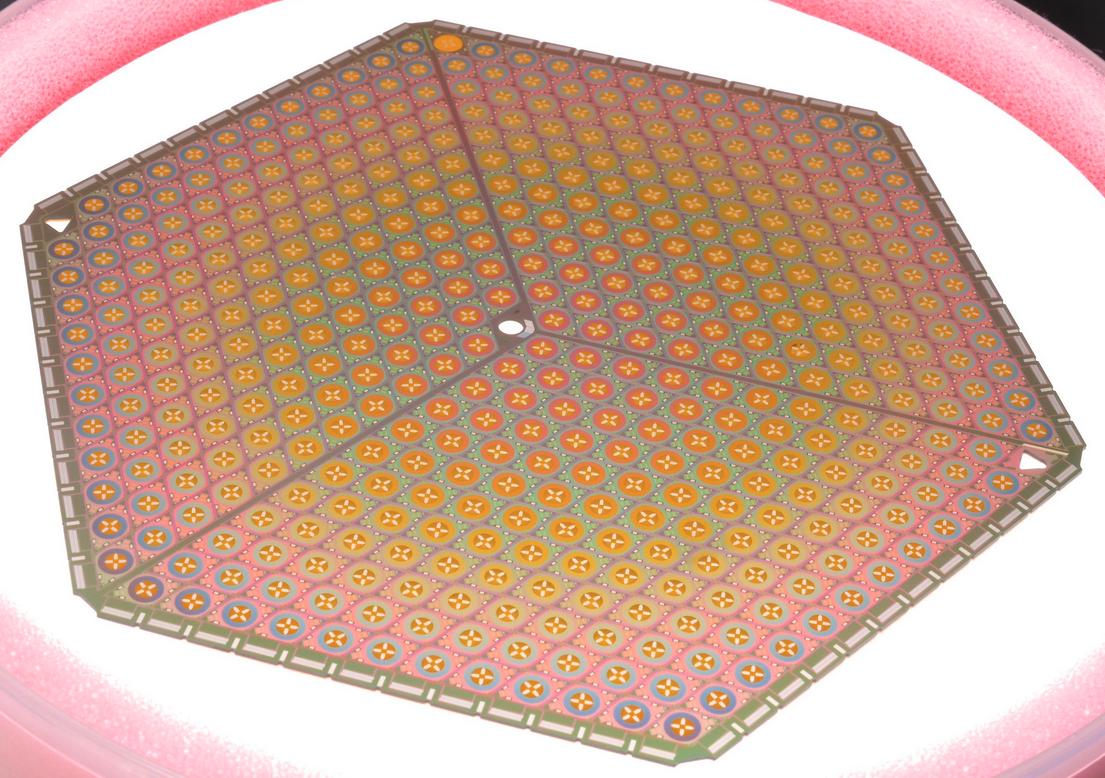
Image courtesy of
NIST
The ACT is considerably larger than any of the space-based CMB telescopes, and so has a small diffraction limit and higher spatial resolution: the images have a FWHM of just about 1 arcminute = 0.017 degrees! The mosaic of detectors allows it to record data from large regions of the sky quickly. It wasn't able to cover the entire sky from its fixed location ...

Image taken from
Mallaby-Kay et al., ApJS 255, 11 (2021)
... but it does provide unprecedented detail in those regions. The map below shows a region of sky roughly seven by five degrees -- an area which would be just one unresolved blob in the images from COBE.

Image taken from
Mallaby-Kay et al., ApJS 255, 11 (2021)
Recently (March, 2025), the ACT team released a set of papers with the final versions of its completed survey data. The image below shows a section of the sky 225 x 16 degrees (3600 square degrees). The color map ranges from +500 microKelvin in red to -500 microKelvin in blue.
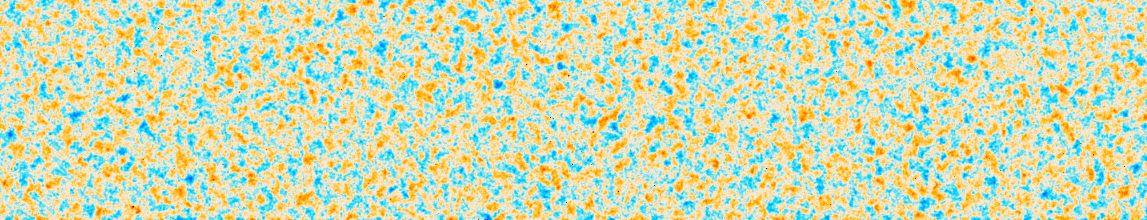
Image taken from Figure 20 of
Naess, S., arXiv:2503.14451 (2025)
Copyright © Michael Richmond.
This work is licensed under a Creative Commons License.