 Copyright © Michael Richmond.
This work is licensed under a Creative Commons License.
Copyright © Michael Richmond.
This work is licensed under a Creative Commons License.
Today, we'll take a trip down memory lane, recounting the accumulated puzzles concerning unusual galaxies and associated objects which gradually built up during the twentieth century. The end will be a cliffhanger; you'll have to wait until our next meeting for the solution.
In the early twentieth century, astronomers surveyed the skies with ever-larger telescopes and ever-more-sensitive photographic emulsions, creating archives and catalogs of tens of thousands of galaxies. Most of them were, well, just giant collections of billions of stars, usually arranged in either elliptical or spiral shapes. M81 is a good example.
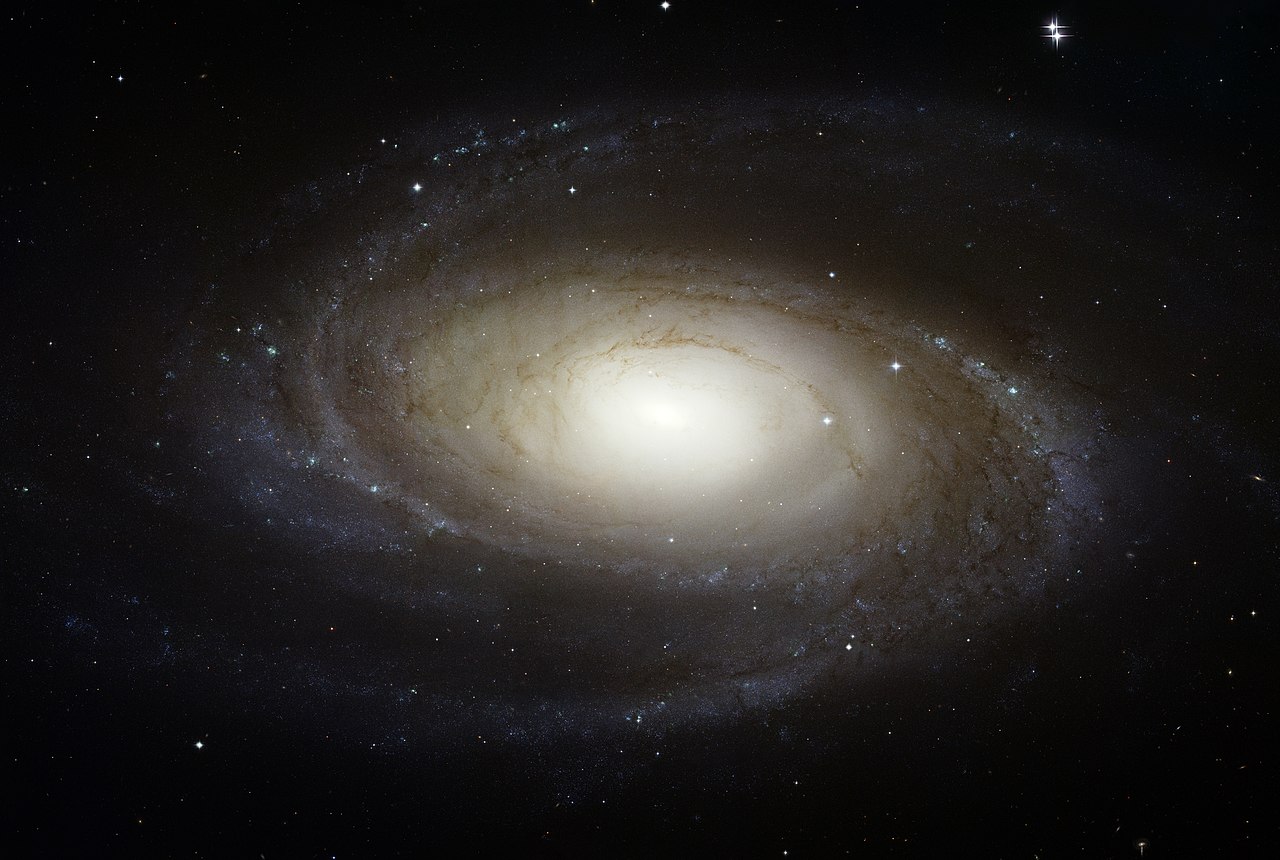
Image of M81 courtesy of
NASA, ESA, and The Hubble Heritage Team (STScI /AURA)
However, every now and then, astronomers would find a galaxy that stood out from its neighbors for one reason or another. Some scientists made a habit of "collecting" these unusual objects.
Carl Seyfert, for example, noticed that a very small fraction of spiral galaxies showed emission lines which indicated environments full of high energy.
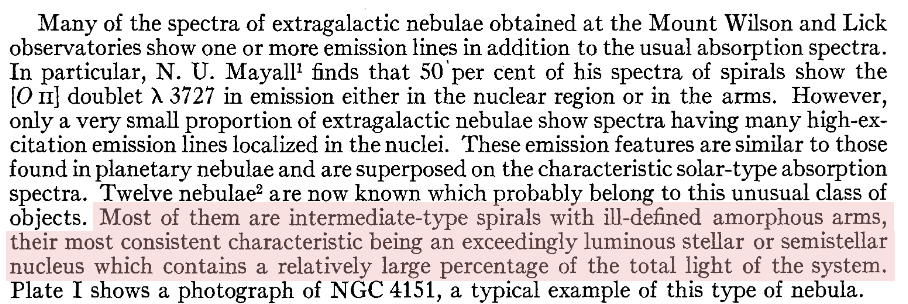
From the first paragraph of
Seyfert, C. K., ApJ 97, 28 (1943)
One of the first in his list is NGC 4151.
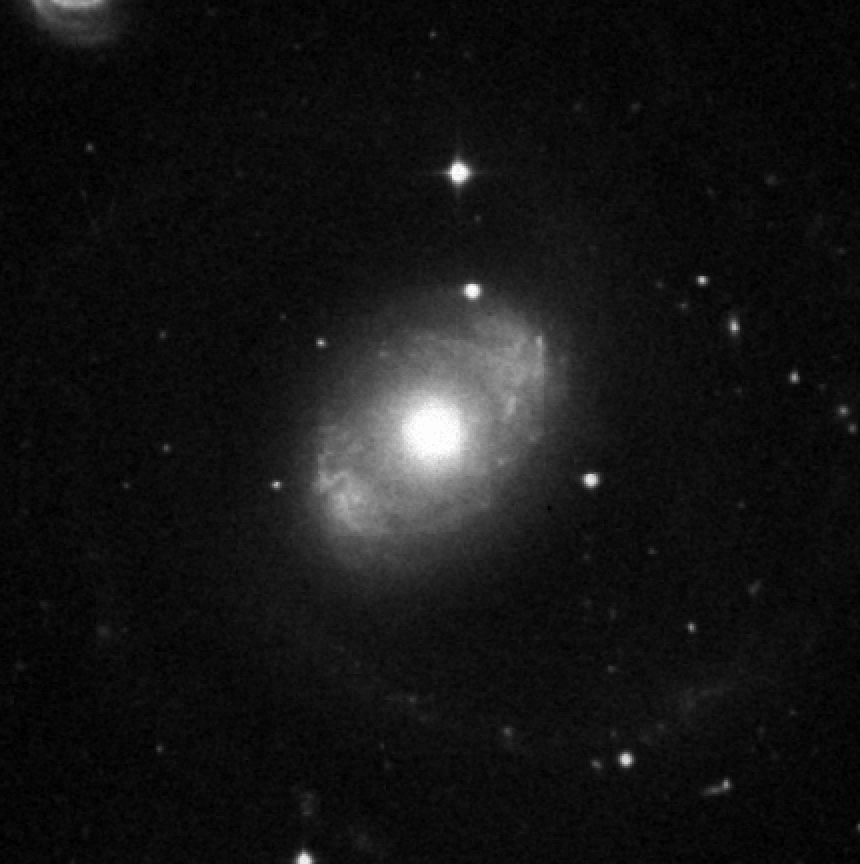
Image of NGC 4151 from the blue plates of DSS2
Composite image of NGC 4151 from the SDSS
Another "collector" was Benjamin Markarian. Starting in the 1960s, he made a catalog of galaxies which emitted a large amount of blue and near-ultraviolet light. In order to find them, he placed an objective prism in front of his telescope: a giant slab of glass slightly thicker on one side than the other.
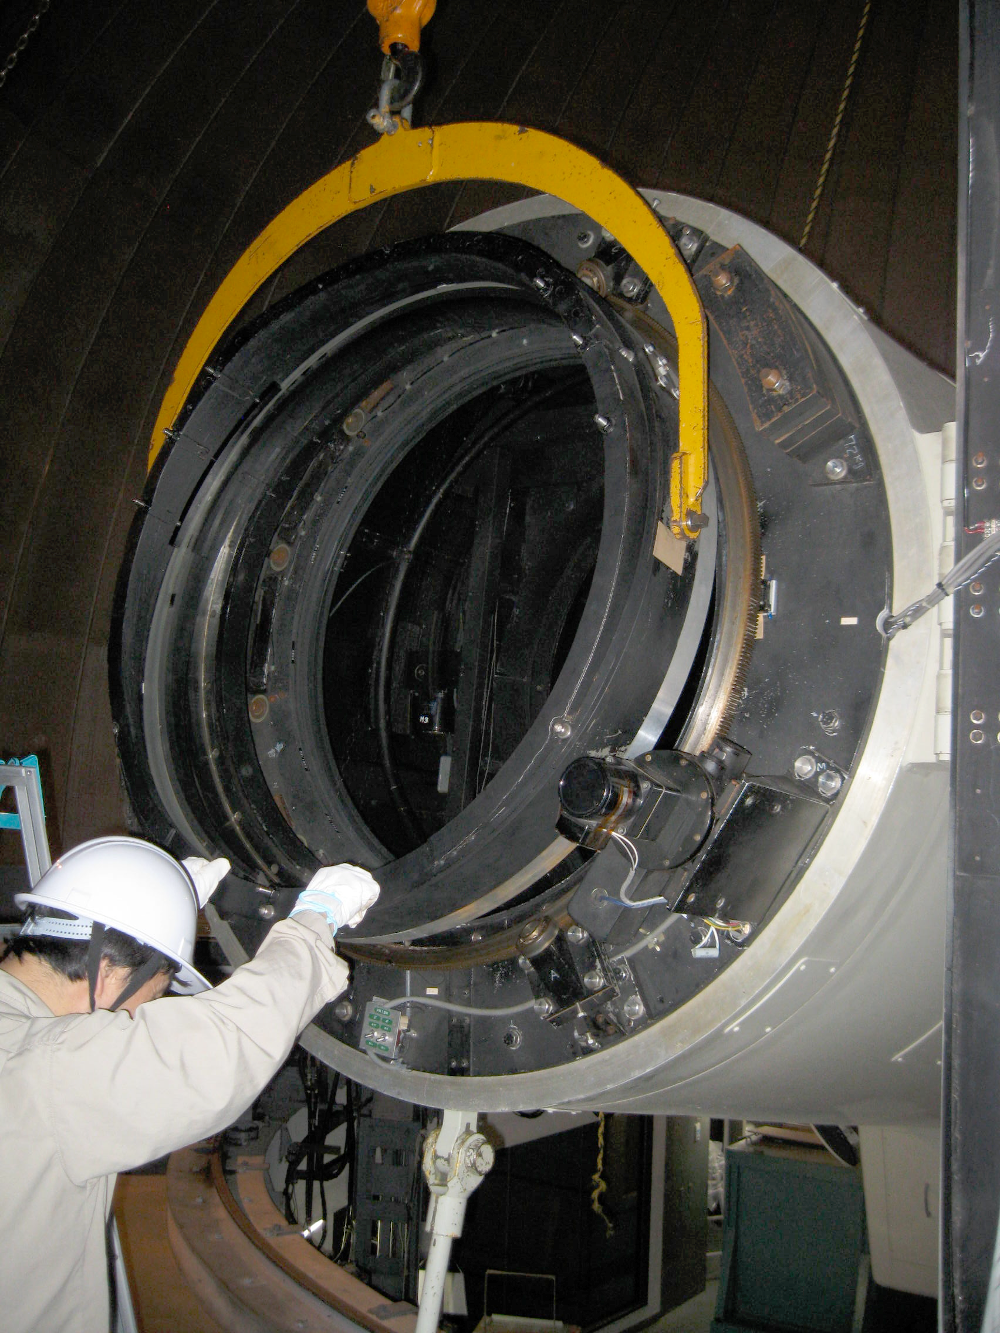
Image of objective prism of the Kiso Schmidt telescope courtesy
of Michael Richmond
The prism broke up the light of all the stars and galaxies into little spectra, allowing him to search very quickly for any objects with an unusual amount of light at the short-wavelength end.
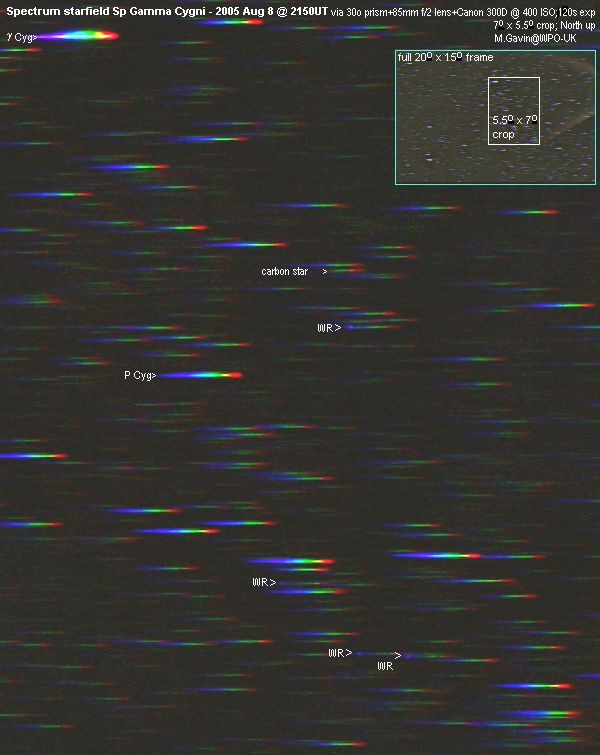
An example of an objective-prism plate,
courtesy of
M. Gavin
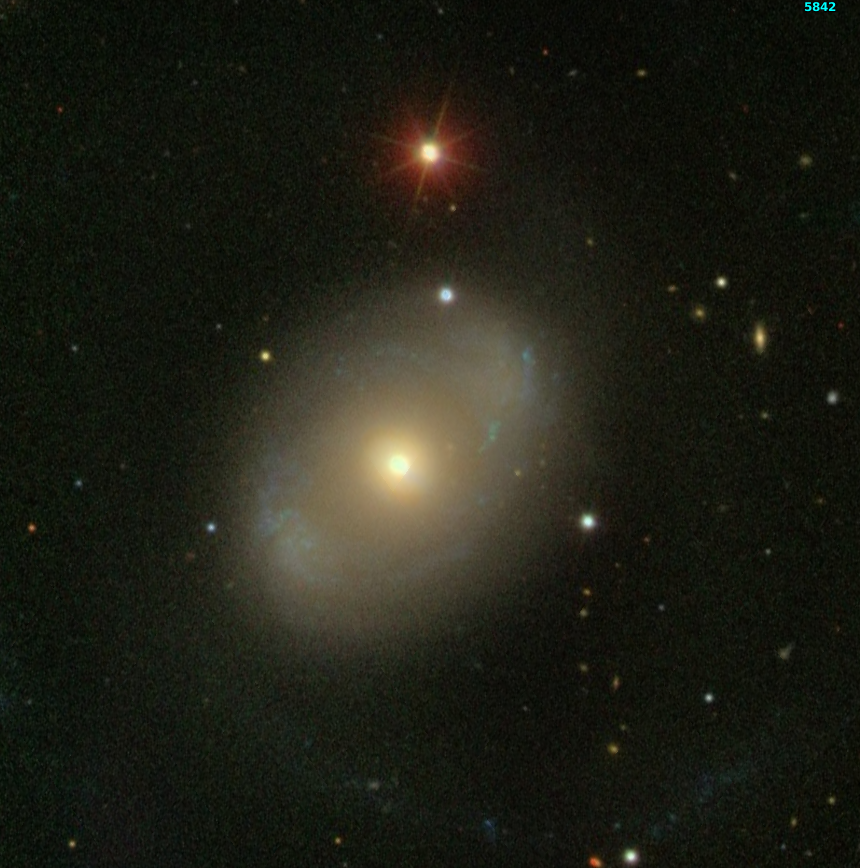
Over the next decade and a half, Markarian added over 1500 galaxies to his catalog. Many of them appear in an ordinary photograph to be ordinary galaxies, like this one: NGC 449.
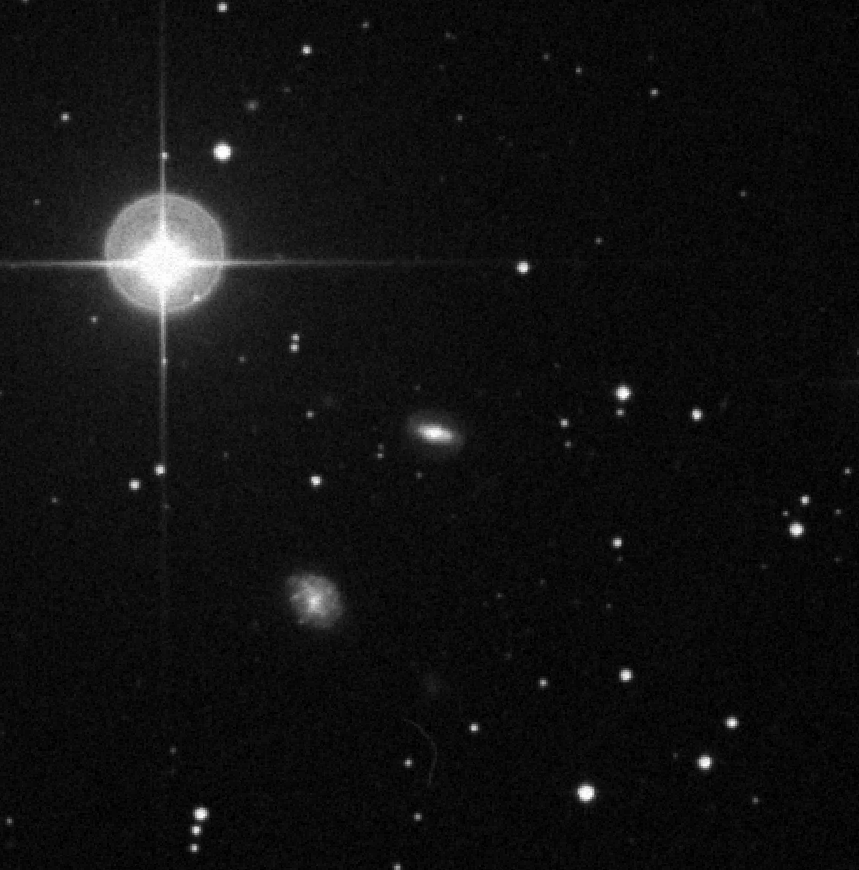
Image of NGC 449 from the blue plates of DSS2
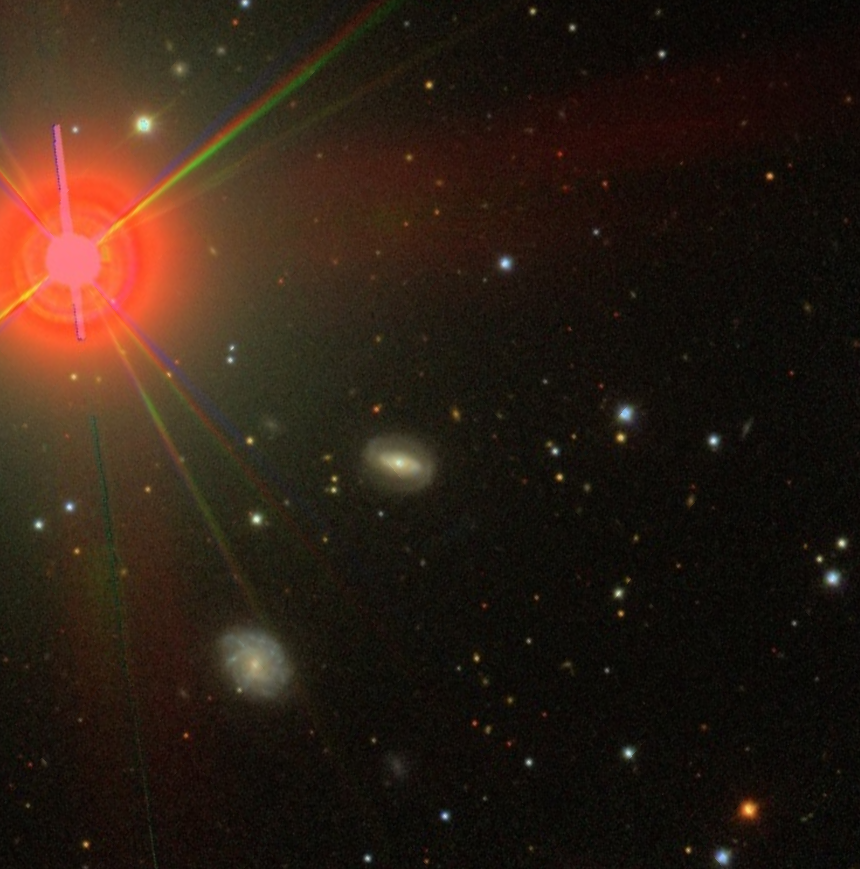
Composite image of NGC 449 from the SDSS
Hmm. A small fraction of galaxies have very bright nuclei, which produce lots of blue and near-UV light, as well as emission lines indicating gas subjected to very high energies. Interesting.
Long before astronomers had figured out that some of the "nebulae" in the sky were independent galaxies beyond our Milky Way (which happened in the 1920s and 1930s), they had been monitoring hundreds of stars which showed changes in brightness.
  Q:  Can you name two reasons why a star might
           appear to vary in brightness?
I hope that you remembered eclipsing binary systems, and pulsating stars such as RR Lyrae and Cepheids.
Well, among the thousands of variable stars which were studied enough to be given official names, some seemed a bit anomalous. They didn't show periodic variations, but instead a semi-random wandering up and down in brightness.

Figure 7 taken from
Howard et al., AJ 127, 17 (2004)
Among the stars which fell into this category are
  Choose one of the objects in the list above and look at the
     image of it provided by SIMBAD -- just click the link.

  What does it look like?
Here's a photograph of one of them, taken by the Second Palomar Sky Survey. It looks like ... a star.
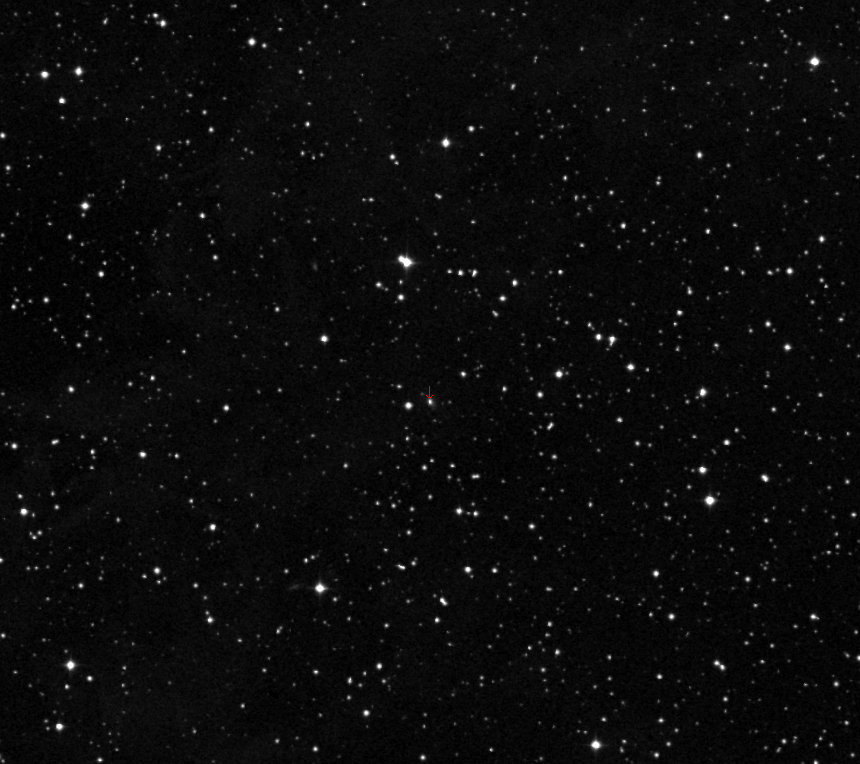
Long exposures with big telescopes eventually revealed that some of these "variable stars" showed a bit of "fuzz" around their edges.
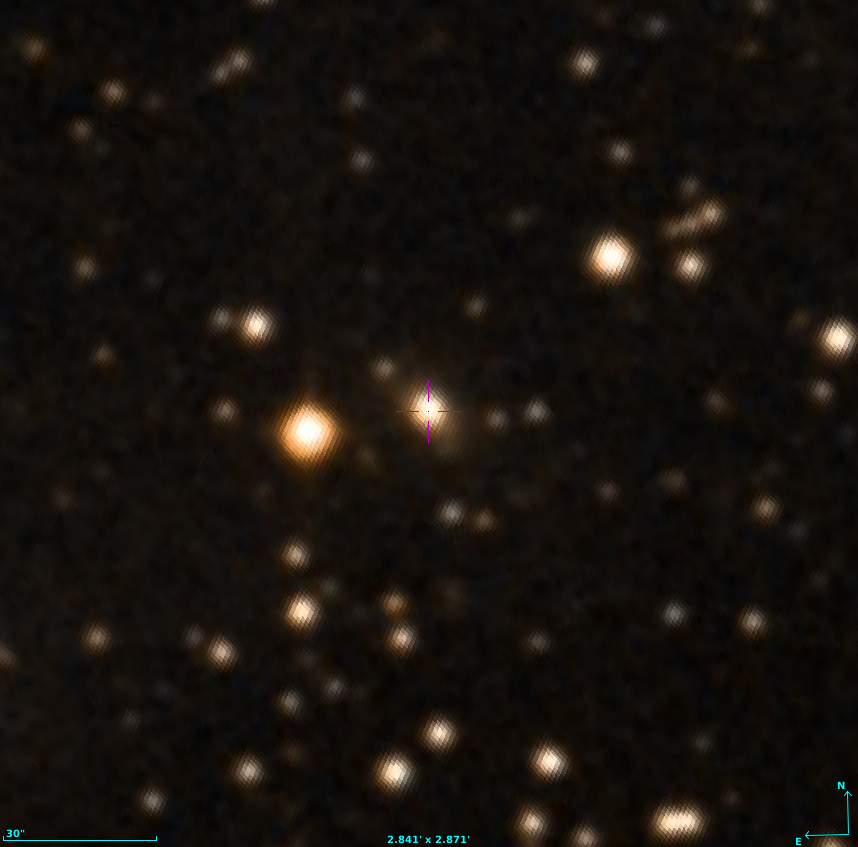
So, were they really stars, or something else?
After World War II, some scientists modified the radar equipment developed during the war into radio telescopes. One of the most enthusiastic groups of this new field, "radio astronomy", were centered in Cambridge, England. They constructed a very simple telescope made of four fixed elements.
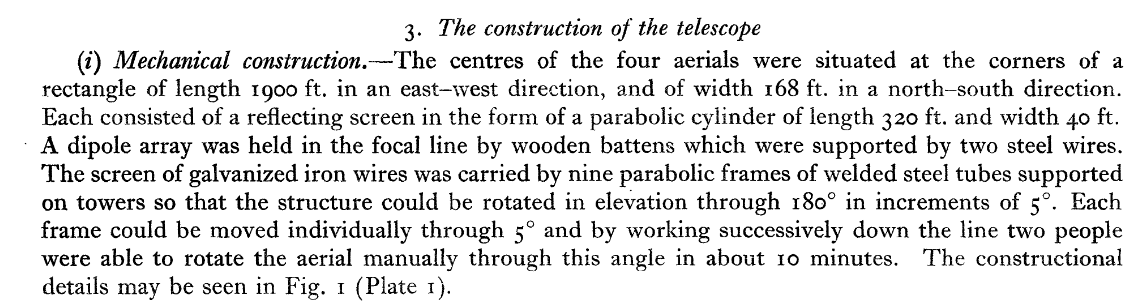
Text taken from
Ryle and Hewish, MmRAS 67, 97 (1955)
Rather than moving their telescope to follow objects as they wheeled across the sky, the Cambridge group simply looked up and recorded the intensity of radio waves as objects drifted past their field of view.
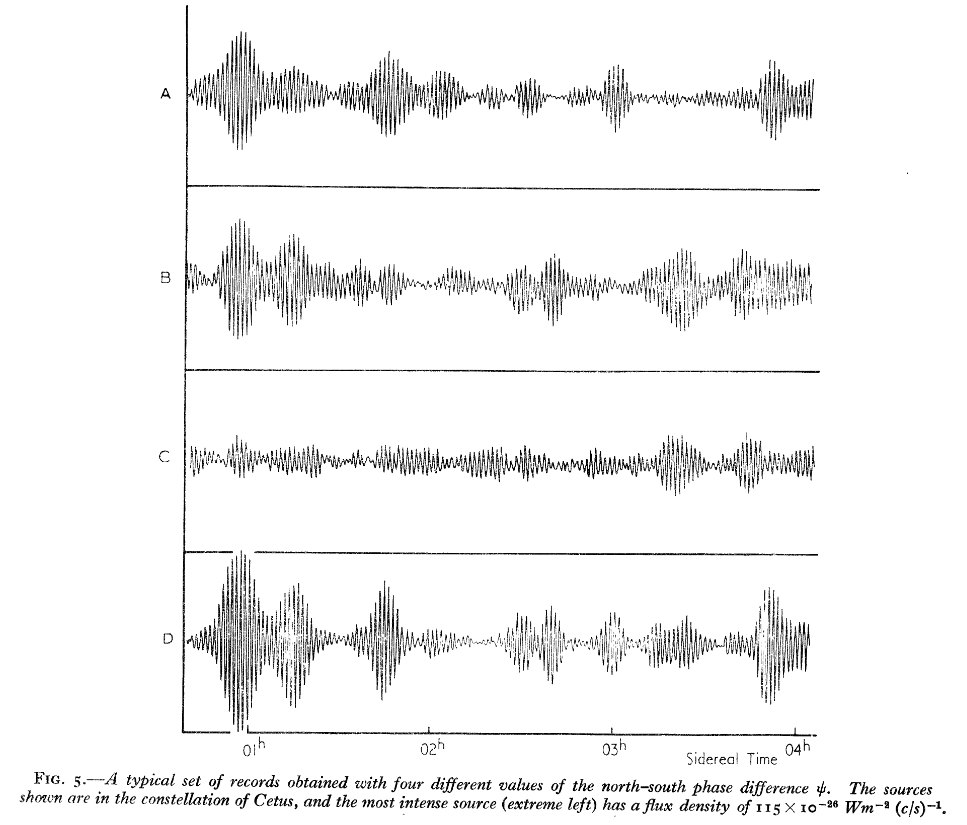
Figure 5 taken from
Ryle and Hewish, MmRAS 67, 97 (1955)
By noting the time of each signal, they could figure out roughly where it was located in the sky. Note the uncertainty in the location indicated by the figure below: several degrees in the East-West direction, and much more than than in the North-South direction.
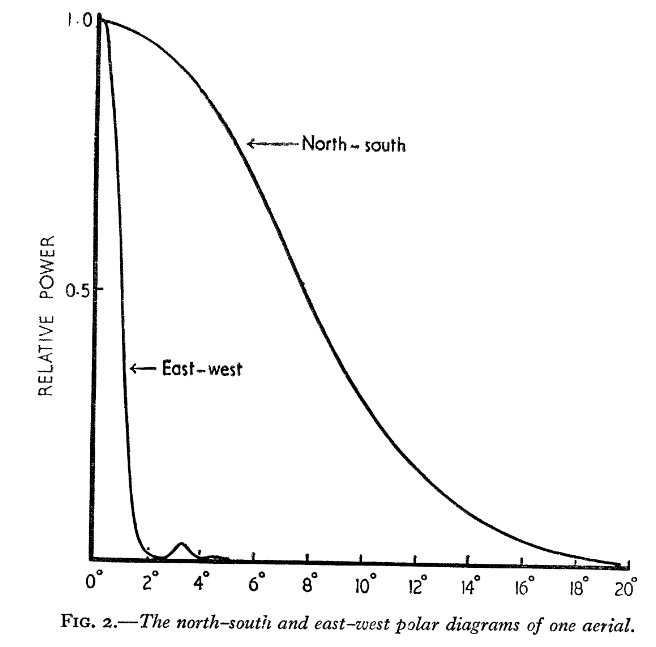
Figure 2 taken from
Ryle and Hewish, MmRAS 67, 97 (1955)
Why do radio telescopes have such trouble determining the exact location of a source? Why can't they measure a position as precisely as a small, backyard, optical telescope?
The problem is diffraction. When we use a telescope (or other optical instrument) to focus rays of light, the interference of waves from one side of the telescope with waves from the other side of the telescope creates a blurry pattern. The sharpness of images created with the telescope is limited by this diffraction pattern.
Quantitatively, the angular resolution θ of a telescope of diameter D which focuses light of wavelength λ is given roughly by the formula
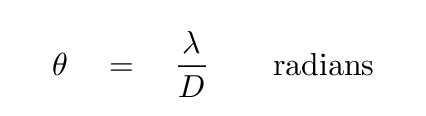
It is often useful to convert the result to arcseconds, since ground-based optical telescopes typically have resolutions of some fraction of one arcsecond.
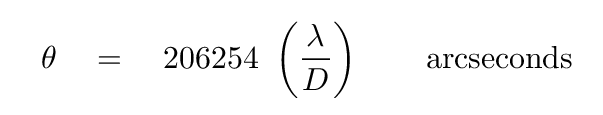
           Q:  Compare the angular resolution of these two telescopes:


                              diameter D (m)      wavelength λ (m)
                ------------------------------------------------------------

                  optical          1.0                  500 x 10-9

                  radio           64.0                  0.7

                ------------------------------------------------------------
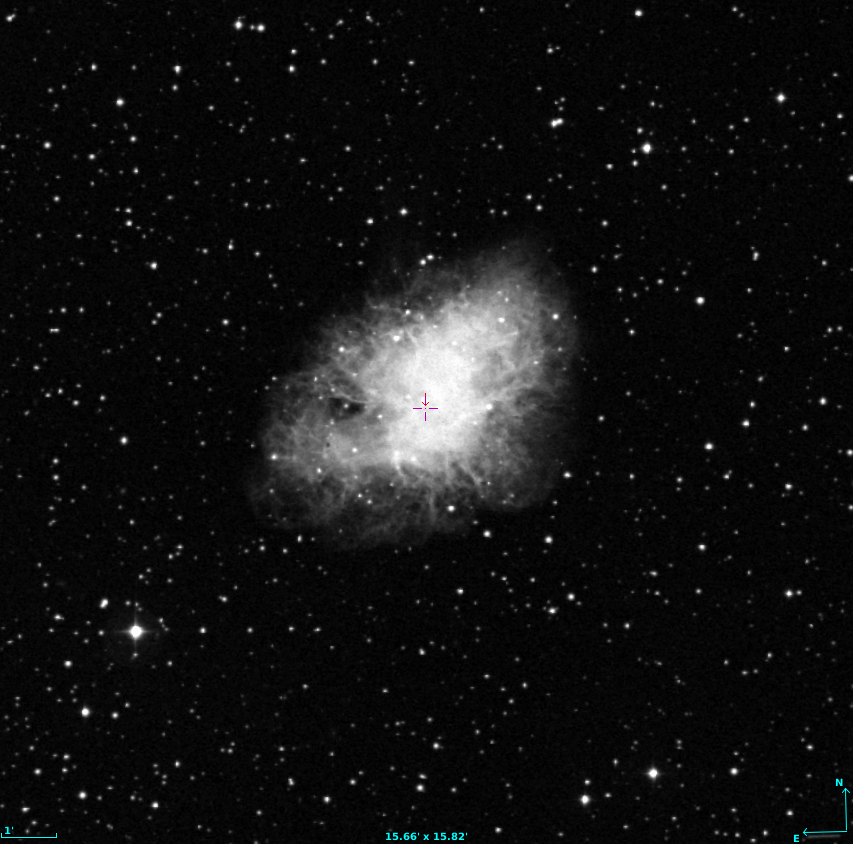
Now, ordinary stars emit almost all of their energy in the UV, visible and near-infrared portions of the spectrum; they are simply hot objects at temperatures of thousands of degrees emitting blackbody radiation. It's a very well understood process. Astronomers didn't expect stars to produce much radio emission, and indeed, stars did not. The brightest sources in the sky were clearly NOT stars. For example, the brightest source, 3C 461, was the expanding cloud of very hot gas created by an exploding star several centuries ago. The third-brighest source, 3C 144, was another, very familiar, supernova remnant: the Crab Nebula.
But some of these radio sources did not appear
to line up with any big, bright, obvious
cloud of gas or galaxy.
Just what were they,
and WHERE were they?
For example,
consider the object 3C 273.
As far as the radio telescope could determine,
(disclaimer: the discussion which follows has been simplified considerably)the source lay somewhere within this circle of diameter roughly 1.5 degrees.
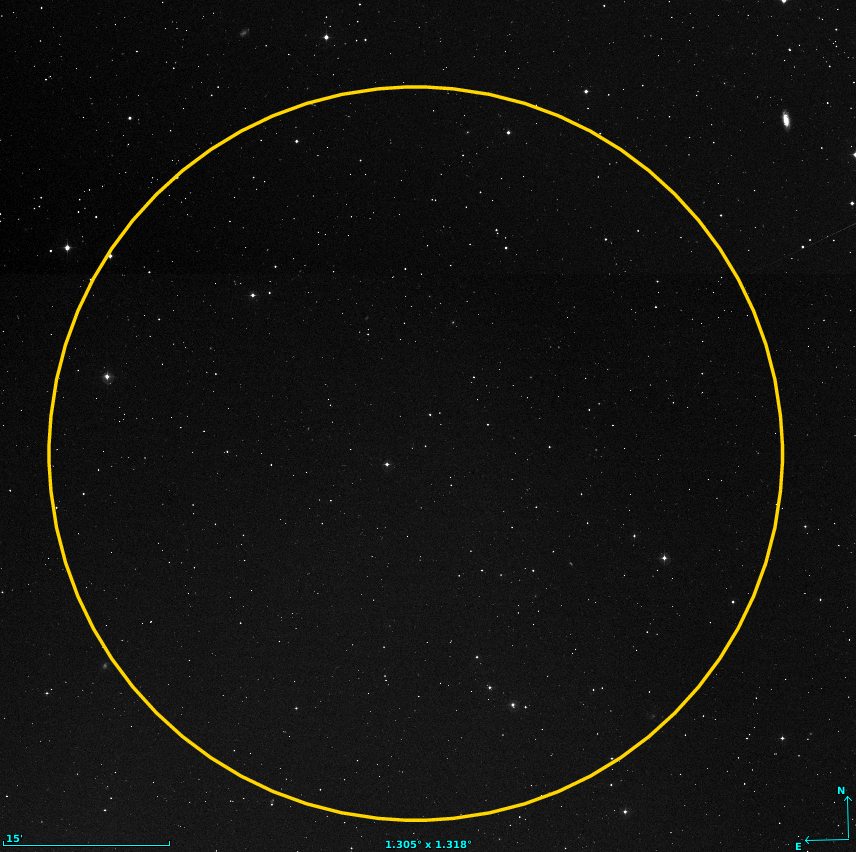
  Q:  How many objects might the astronomers have to check
          in order to find the optical counterpart to 3C 273?
Fortunately, some very clever astronomers realized that there was a method to pin down the exact location of this radio source much more precisely: use the Moon! By a nice coincidence, as the Moon travels through our sky, it occasionally happens to pass directly in front of this source. In 1962, astronomers in Australia used the big radio dish at the Parkes Observatory to observe 3C 273 as the Moon first covered it up, and then revealed it.
The recordings of the change in intensity vs. time showed a sharp disappearance, then a rapid re-appearance. Well, there were signs of two sources, very close together -- but each one could be located by this method.

Taken from Figure 1 of
Hazard, Mackey, and Shimmins, Nature 197, 1037 (1963)
Using their knowledge of the Moon's position, Hazard et al. were able to determine that the two sources, "A" and "B", must lie within these tiny error boxes: the entire diagram is just twenty arcseconds across.

Taken from Figure 2 of
Hazard, Mackey, and Shimmins, Nature 197, 1037 (1963)
How much of an improvement is this? See for yourself. The two components lie within the red box at the center of this figure.
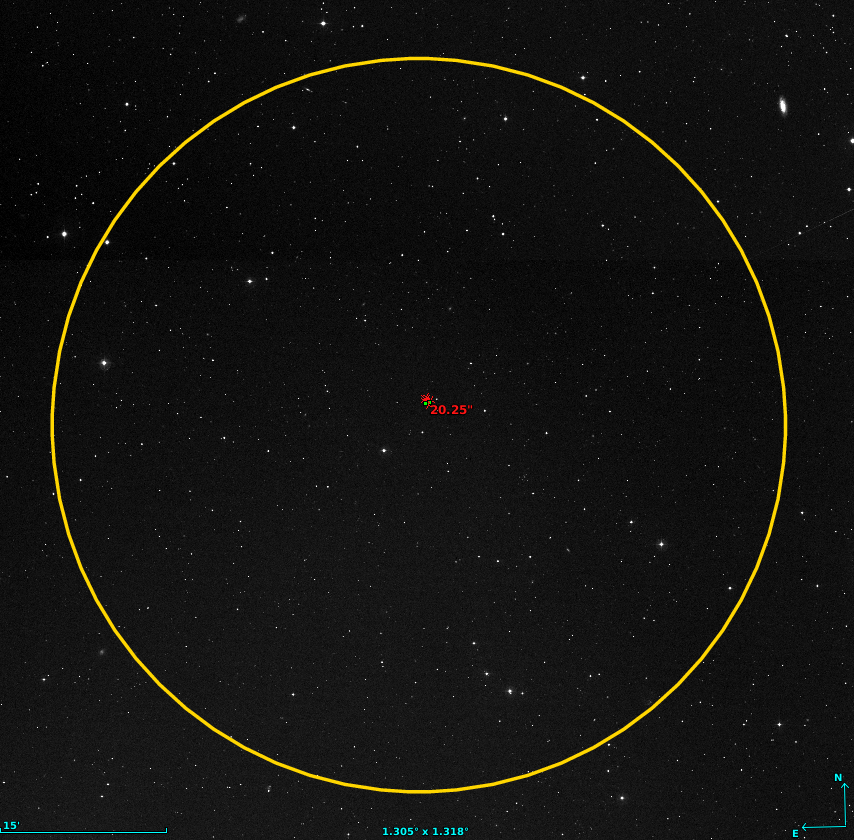
Astronomers could now zoom in and figure out exactly which optical source corresponded to the radio emitter.

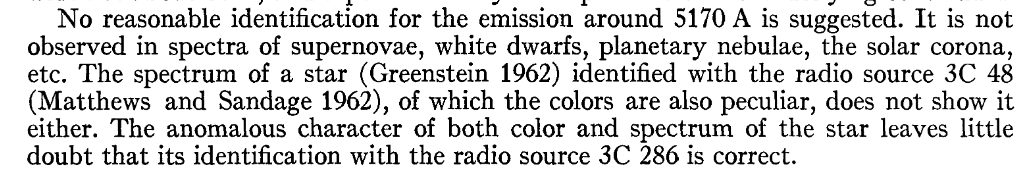
The paper describing this precise position based on lunar occultation measurements includes the following passage in its conclusion:
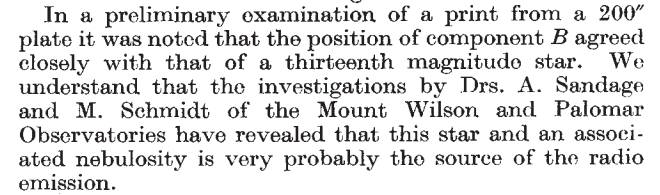
Taken from conclusion of
Hazard, Mackey, and Shimmins, Nature 197, 1037 (1963)
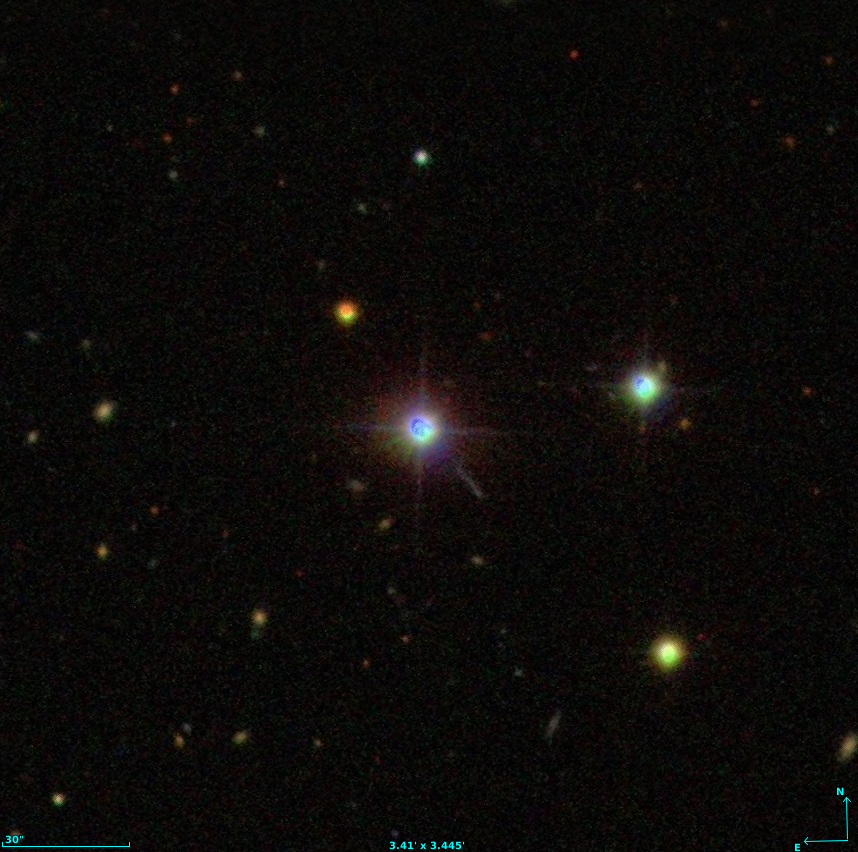
Subsequent images showed that one of the components looked like an ordinary star, while the other was coincident with a thin "finger" of light that appeared to be aligned with the first component. Very strange!
This weird object generated quite a bit of heated debate.
    "It's just a star!"


               "No, it's a radio source.  It can't be a star."


    "Sure it can!"


               "But it also has a 'finger' sticking out of it."


    "Well, okay.  It's at least sort of a star."


               "Sort of a star?  That sounds imprecise and un-scientific."


    "How about 'quasi-stellar'?"


               "Sure!  We can call it a quasi-stellar radio source."


      Q:  What would be a good quick, short abbreviation for
                 quasi-stellar radio source?
Yes, 3C 273 and several similar objects were dubbed "quasars", and the name has stuck ever since.
But what WERE they?
X-rays, unlike radio waves or optical photons, are unable to pass through the Earth's atmosphere. Therefore, we can't study X-ray emission from celestial objects from the ground. Starting in the 1960s, however, scientists began to shoot X-ray telescopes (BRIEFLY) into space using sounding rockets. During the first few years of looking through this new window, astronomers were able to identify some of the strongest X-ray sources in the sky with galaxies.
For example, one of the first X-ray sources to be identified was the giant elliptical galaxy M87. It looks like a big clump of stars in the optical ...

... and appears a roughly similar size in this X-ray image taken by the Chandra spacecraft.

(Pssst. If you take a short-exposure optical image, and zoom way in to the center of the galaxy, you might notice something a bit strange)
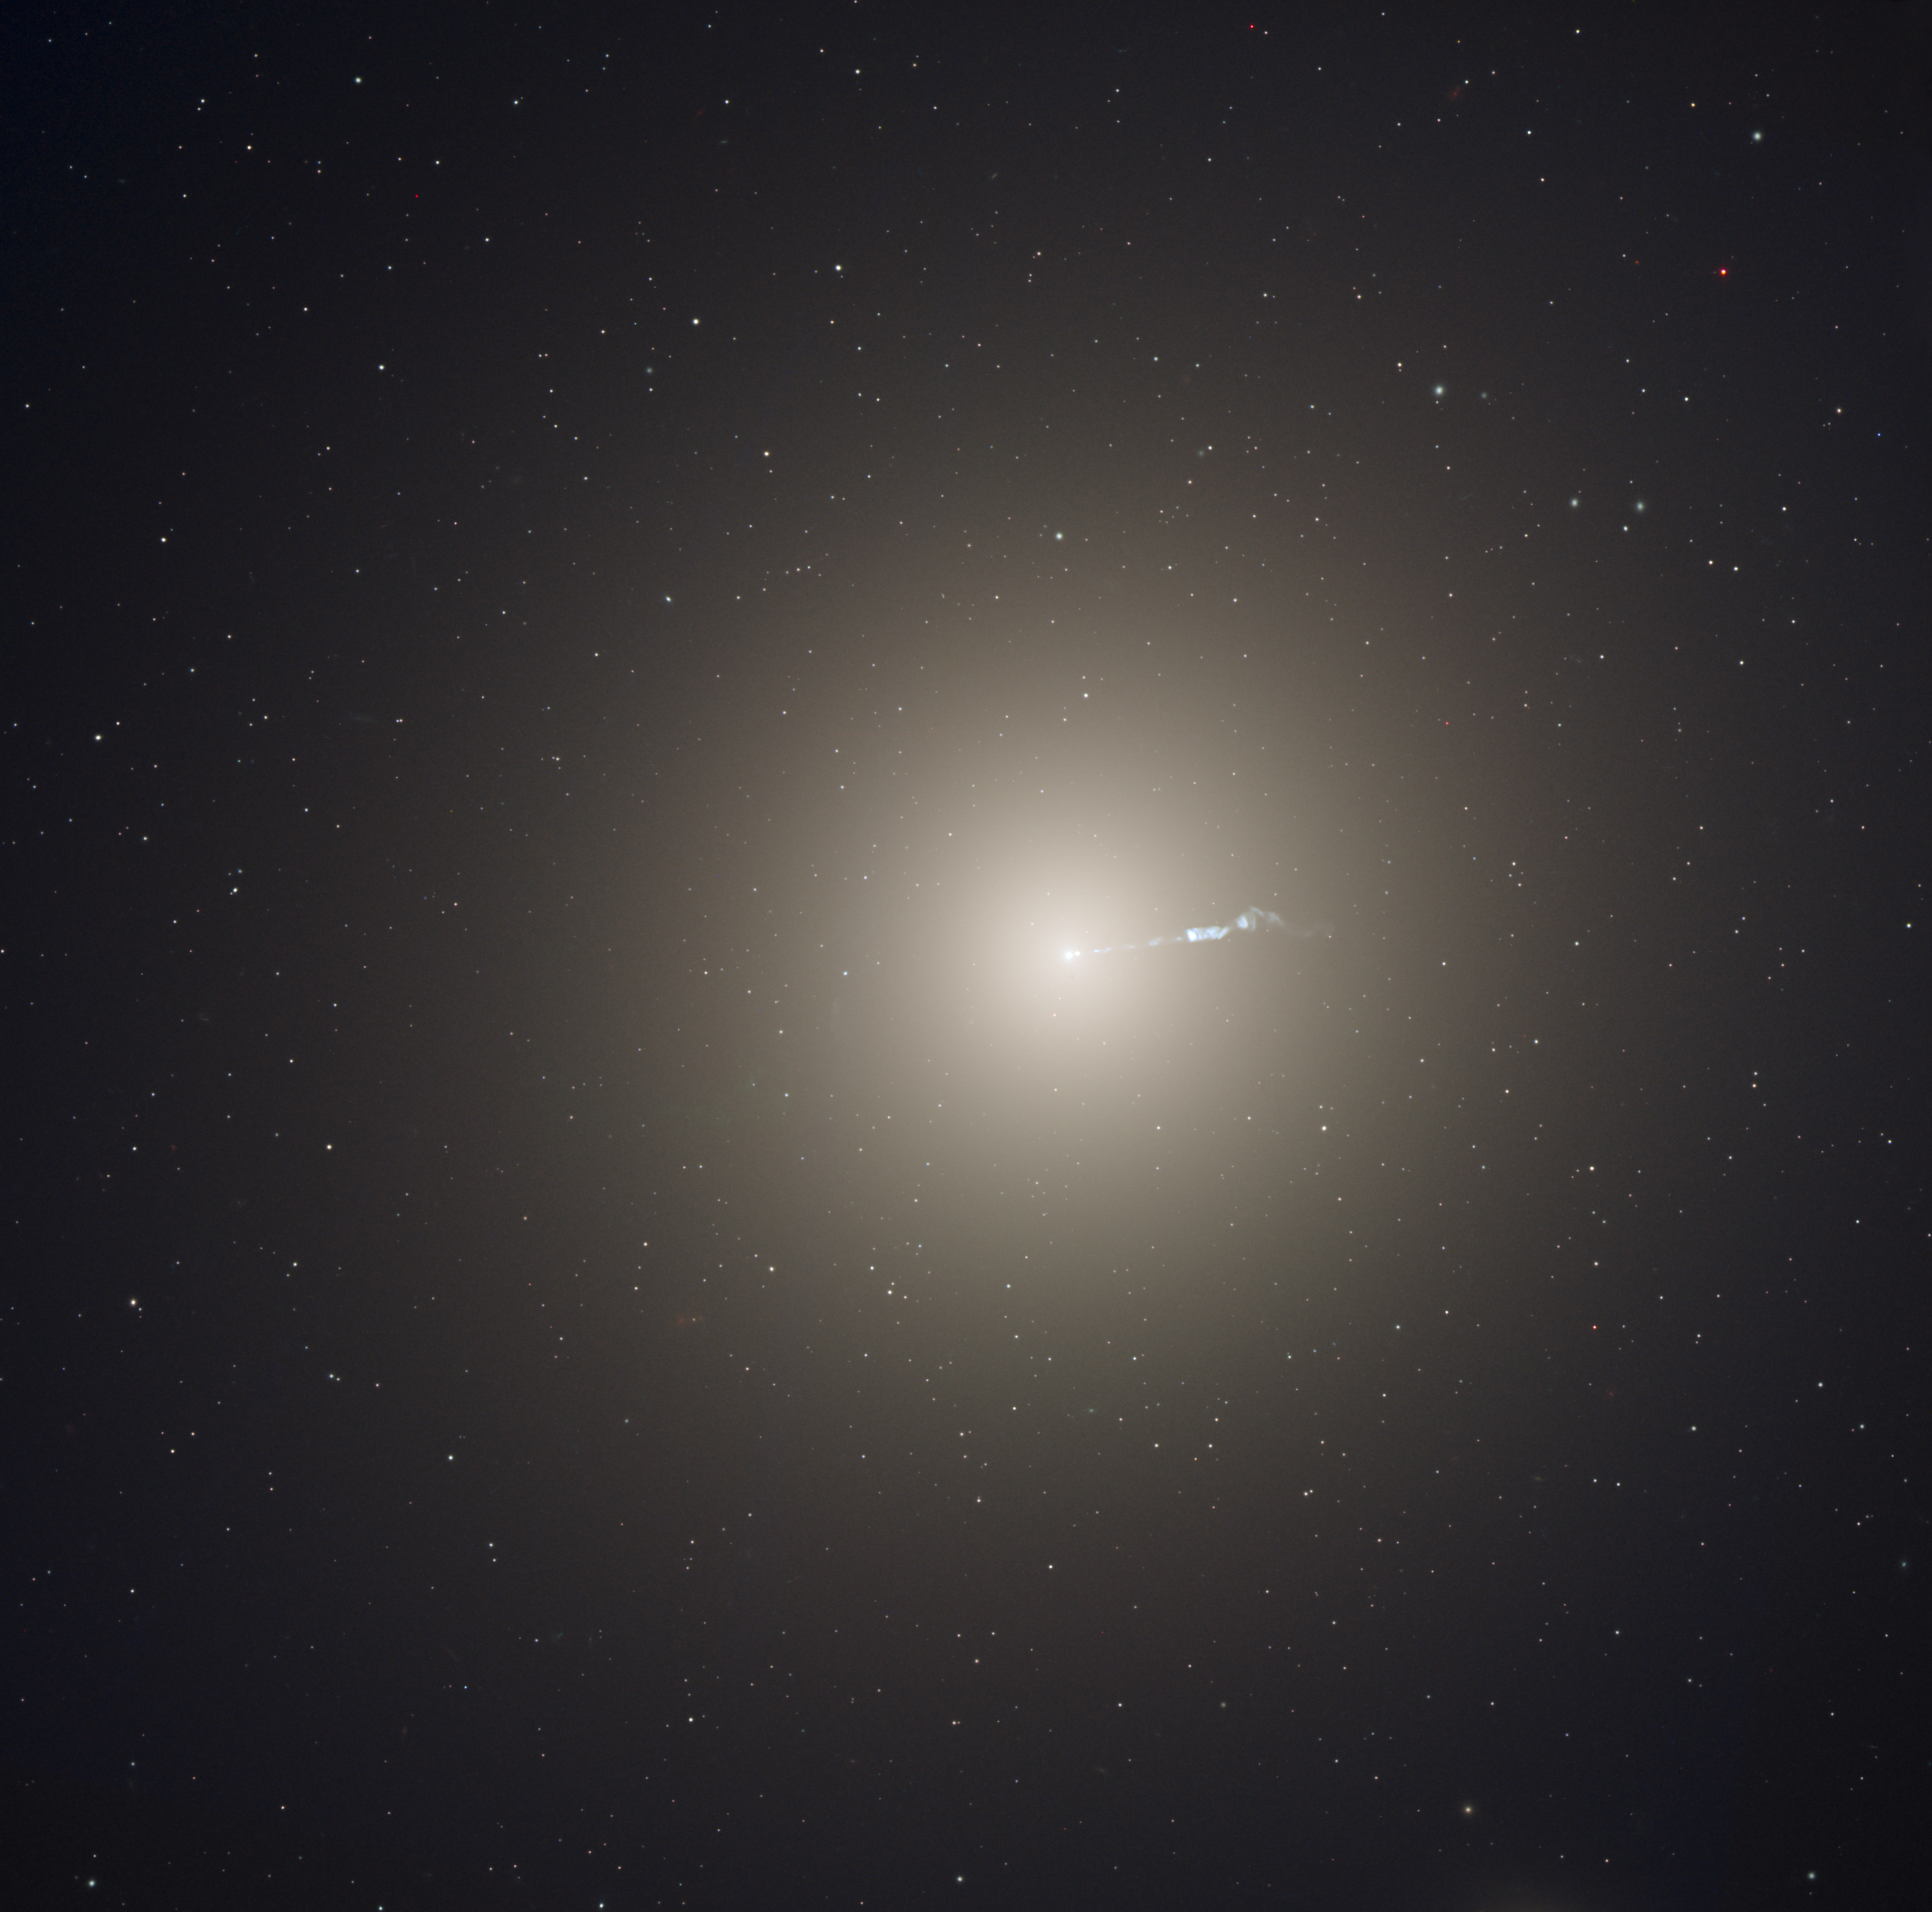
Optical image of M87 courtesy of
NASA, ESA and the Hubble Heritage Team (STScI/AURA);
Acknowledgment: P. Cote (Herzberg Institute of Astrophysics)
and E. Baltz (Stanford University)
The fact that a galaxy was producing X-rays was ... surprising. Why? Well, galaxies are made of stars, right? And stars are just hot balls of gas, which shine so brightly IN THE OPTICAL because of thermal, or blackbody, radiation. The point is that most of the blackbody radiation produced by an object depends on its temperature: the hotter the object, the shorter the wavelength at which it emits most of its energy.
In fact, there's a simple relationship between the temperature of an object and the wavelength at which its emission reaches a peak.

What's the problem? Well, use this relationship to compute the temperature at which an object will produce most of its energy in the optical, and in the X-ray, regime.
                              optical                  X-ray
     -------------------------------------------------------------

       wavelength (m)         5 x 10⁻⁷               1 x 10⁻¹⁰

       temperature (K)


    --------------------------------------------------------------
There are plenty of stars with temperatures in their outer atmospheres is 6000 Kelvin, or 10,000 Kelvin, and even a few with temperatures as high as 30,000 Kelvin. But there are no ordinary stars with temperatures close to even one million Kelvin, let alone thirty million (yes, there are a handful of very young neutron stars with such high temperatures, but they are extremely rare).
What in the world could be the source of all these X-rays?
As soon as the Parkes lunar occultation measurements allowed astronomers to determine the positions of quasars accurately, they began to study the new star-like objects intensively. Astronomers at CalTech used the big 100-inch and 200-inch telescopes at Mount Wilson and Mount Palomar to acquire spectra of the objects, hoping to see familiar patterns of emission and absorption lines of hydrogen, iron, magnesium, etc.
They did see some spectral features ...

Spectrum of 3C273, courtesy of
CSIRO
... but those lines weren't in the right places. It didn't seem possible to match up these emission lines with those produced by any known elements.
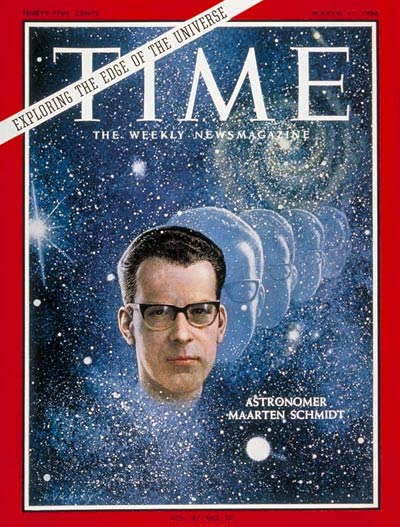
Marten Schmidt wrote in July, 1962:
Taken from
Schmidt, ApJ 136, 684 (1962)
What was going on? Were these mysterious objects full of some new and unknown elements?
After about six months of puzzling over the optical spectra of several quasi-stellar radio sources, Marten Schmidt had a sudden insight.

Text taken from
Discovery of Quasars
by Marten Schmidt (NRAO workshop, 1983).
As a reward for his hard work and solution of this puzzle, Schmidt was given quite a reward:
The Good News: The lines visible in the spectra of these objects were those of familiar elements, such as hydrogen and oxygen. The reason no one had recognized them was because they had been red-shifted by such large amounts.
Spectrum of 3C273 and comparison, courtesy of
CSIRO
The enormous redshifts indicated that these objects were
Let's calculate one consequence of this very large distance.
   The V-band apparent magnitude of 3C 273 is m = 14.83.

   The redshift of 3C 273 is z = 0.16.

   Use Ned Wright's cosmology calculator to find the luminosity distance DL.
       to 3C 273.

   Use DL to compute the distance modulus (m - M).

   Use the distance modulus to compute the absolute magnitude M of 3C 273.
For comparison, the Andromeda Galaxy, which contains hundreds of billions of stars, has an absolute magnitude of MV = -21.5.
Q: Which produces more light, 3C 273 or the entire Andromeda Galaxy?
So that's ... puzzling. We don't see a giant ball of billions of stars when we take pictures of 3C 273. What is creating all that light?
Wait -- it gets even worse. Remember that some quasars were mistaken for variable stars? Well, let's look at a light curve of another quasar, 3C 279. Look for some of the short-term variations in brightness.
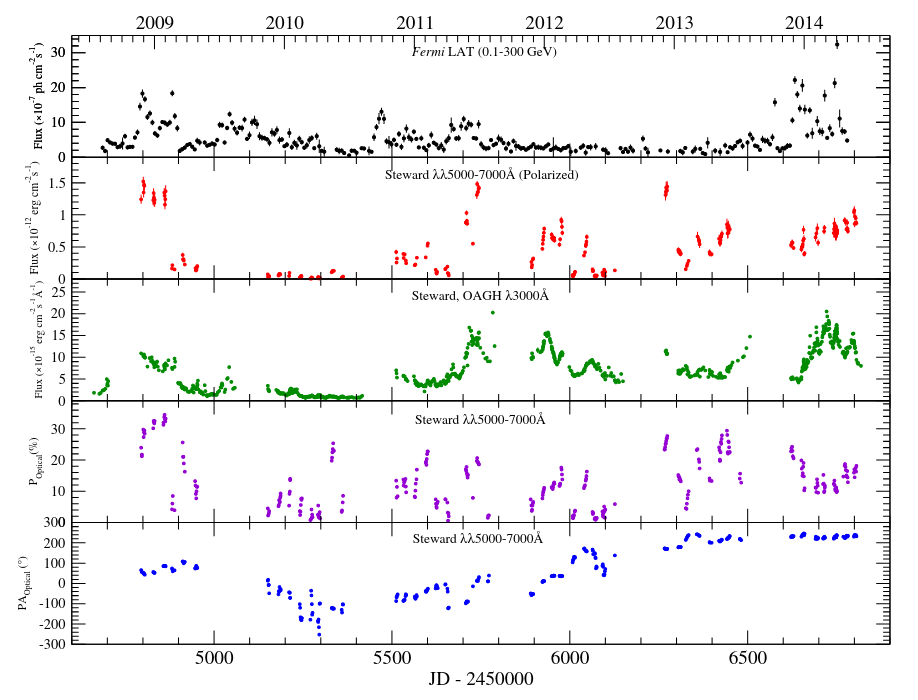
Figure 4 taken from
Patino-Alvarez et al., MNRAS 479, 2037 (2018)
   Q:  How quickly can this object change in brightness by a significant
            factor?  By, say, a factor of two?
There appear to be some events in which the quasar brightens (or fades) by factors of two over the course of just 10 or 20 days.
Why is that important? In order for an object to change its luminosity significantly, pretty much all of its area has to brighten (or dim). If the object is spread out over a large area -- say, 100 light-years across -- then the light from the near side will reach us first, and the light from the far side will be delayed by the amount of time it takes light to cross the object; in this case, variations would be spread out over something like 100 years.
But if quasars can vary on timescales of just a few days, then all of their light-emitting machinery must be packed into a region which is only ... a few light-days across.
   Q:  How long does it take light to cross our Solar System,
            from the Sun to Pluto (which is about 60 x 1011 m away)?


   Q:  How long does it take light cross our Milky Way Galaxy?


   Q:  How large is the region emitting light in a quasar?
How can quasars produce more light than an entire galaxy, in such a tiny region?
Copyright © Michael Richmond.
This work is licensed under a Creative Commons License.