Copyright © Michael Richmond.
This work is licensed under a Creative Commons License.
Copyright © Michael Richmond.
This work is licensed under a Creative Commons License.
Last time, we investigated the manner in which stars in a self-gravitating collection can interact with each other. We found that for stars in the disk of the Milky Way,
At the end of that class, we defined the relaxation time, which is the time it takes for the many weak gravitational perturbations to become significant:

By the way, I made a small mistake in my notation in that lecture. The convention is to define the constant Λ as the ratio of the minimum and maximum distances for weak encounters,
but in my lecture notes I wrote that Λ was equal to the natural log of that ratio. Whoops. I've fixed the equation on those previous pages, and show it correctly in the equation for relaxation time here as well.
Now, if one makes a few approximations, one can write the relaxation time in a manner which is often more convenient to use. First, we need to define the crossing time: the time it takes a star to move through the cluster at a typical speed:

It is possible to show that the two-body relaxation time can be written as the product of the crossing time and the number of stars in the cluster, N, like so:

Let's adopt this equation and apply it to several different types of stellar clusters.
Just to make sure that this new way of writing the relaxation time yields the same, or at least very similar, results, let's revisit our calculation of stars moving in the disk of the Milky Way.
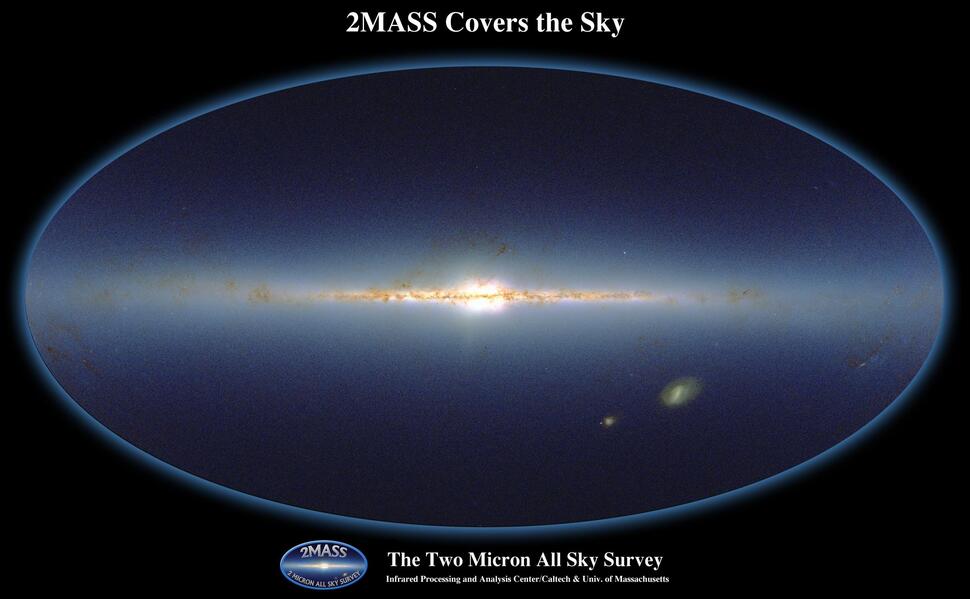
2MASS images of Milky Way courtesy of
M.F. Skrutskie (UMass; Principal Investigator, 2MASS), J.M. Carpenter (Caltech), R. Hurt (IPAC/Caltech)
The important properties of stars in the disk are (to some reasonable approximation)
   Q:  What is the crossing time?
         Express your result in years.


   Q:  What is the relaxation time?
         Express your result in years.
Now, we can compare the relaxation time of this system to its age, which is roughly the same as the age of the universe: 13.7 Gyr. If the relaxation time is shorter than the age, then we can expect that the initial velocities and positions of the stars should have been modified enough that they should have become rather homogeneous.
Q: Should stars in the disk of the Milky Way be "relaxed"?
Good. That agrees with the result we found last time, using a slightly different expression for the relaxation time.
Open clusters, as you may recall, are relatively young (millions of years) systems of thousands of stars usually found in the disk of the Milky Way. We'll consider two examples: the Pleiades and M35.
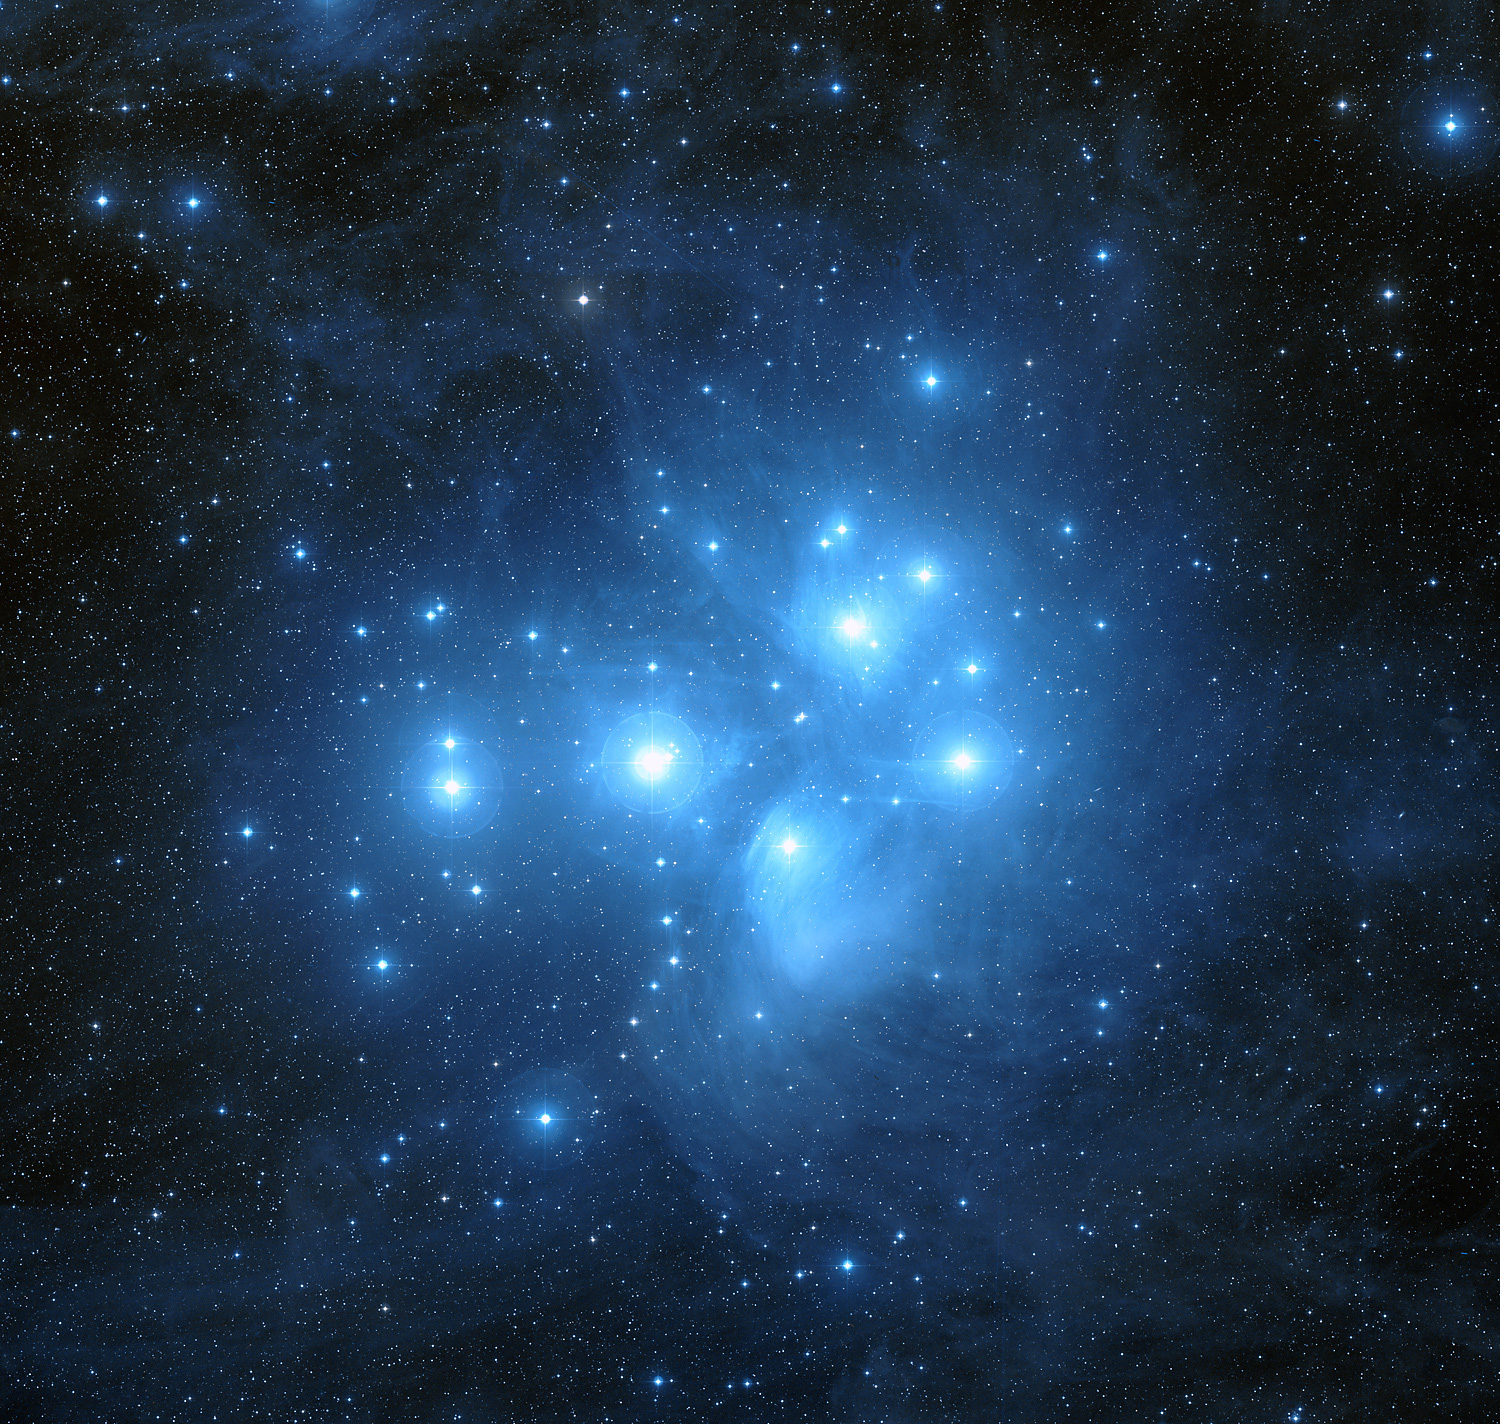
Image of M45 courtesy of
Davide De Martin & the ESA/ESO/NASA Photoshop FITS Liberator
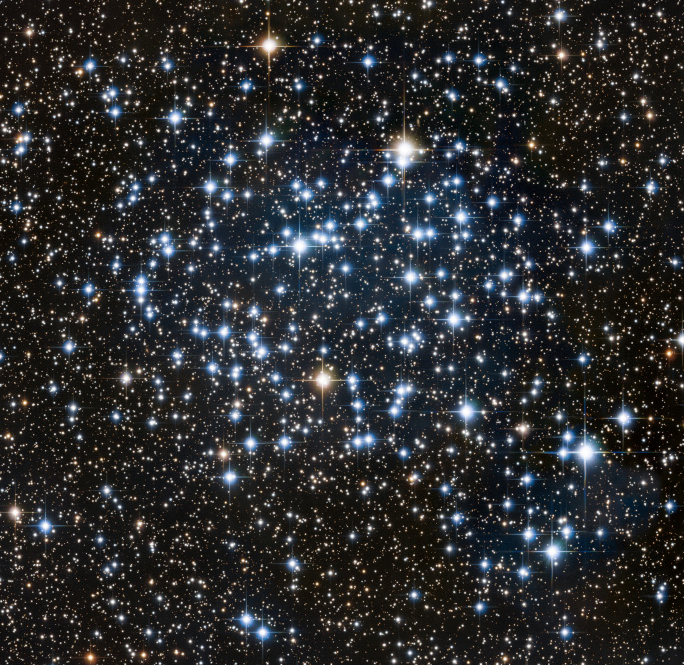
Image of open cluster M35 (slightly cropped) courtesy of
Astronomy Picture of the Day,
Evan Tsai
and LATTE: Lulin-ASIAA Telescope
   Cluster              Pleiades                 M35
 -------------------------------------------------------------

   Velocity               1800 m/s              650 m/s

   Radius                 2 pc                  5.2 pc
                          6.2 x 10¹⁶ m          1.6 x 10¹⁷ m

   Number of stars        1236                  2050

   Age                    100 Myr               200 Myr

 -------------------------------------------------------------
Have these open clusters existed long enough for the many small gravitational interactions between their stars to have "relaxed" their motions? For each one, compute the crossing time, and then use it and the equation below to calculate the relaxation time.
Let's examine a pair of globular clusters, which contain MANY more stars than open clusters, packed rather more densely. These clusters are also much OLDER than open clusters, which should have allowed the stars within them to experience many more weak encounters over their lifetimes.
We'll consider two objects again, both of which can be seen with a small telescope from the Rochester area: M13, and M15.
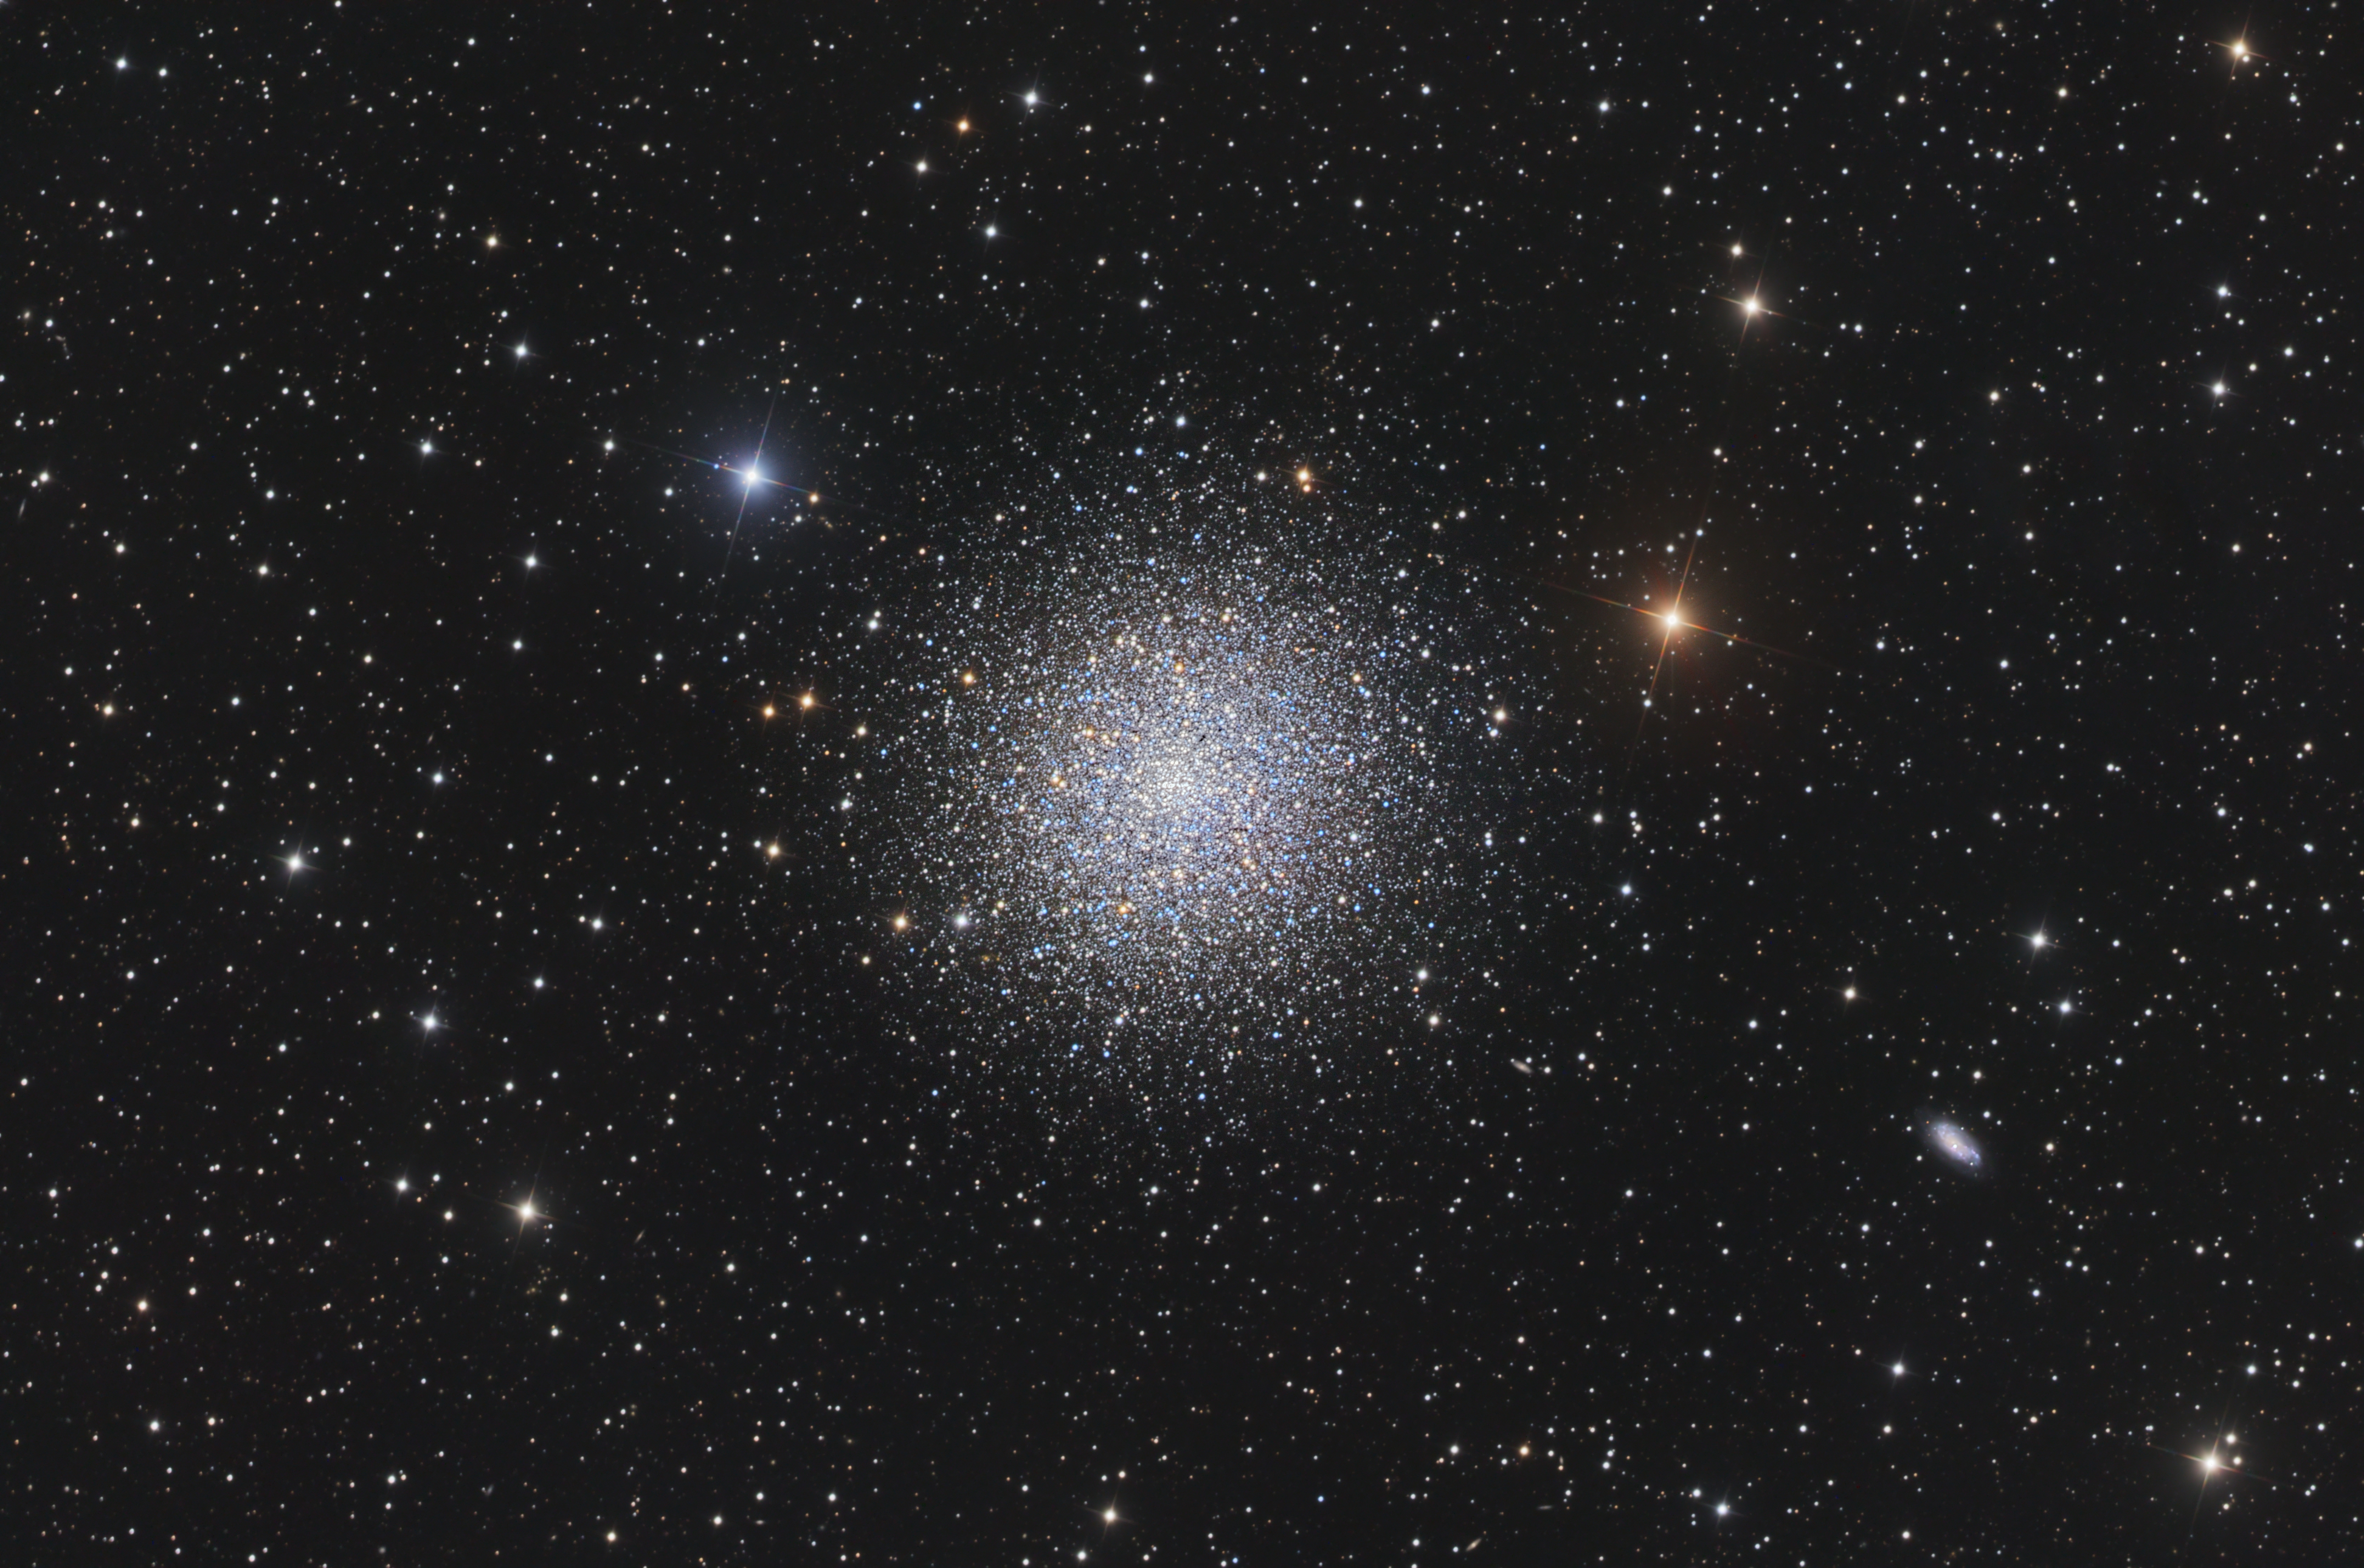
Image of M13 courtesy of
Astronomy Picture of the Day
and
Martin Dufour
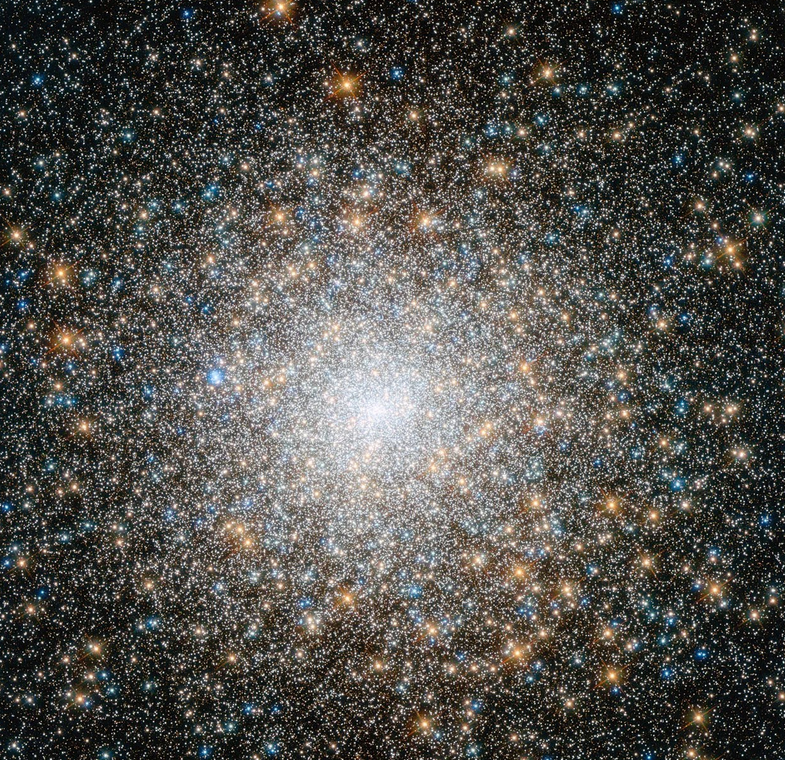
Image of M15 courtesy of
NASA, ESA
   Cluster                  M13                  M15
 -------------------------------------------------------------

   Velocity               7290 m/s           12,000 m/s

   Radius                14 pc                  9 pc
                          4.3 x 10¹⁷ m          2.8 x 10¹⁷ m

   Number of stars        106                   5 x 10⁵

   Age                     13 Gyr               13 Gyr

 -------------------------------------------------------------
Once again, first compute the crossing time for these globular clusters, and then use the formula below to estimate the relaxation time. Compare that to the age of the cluster -- should these objects be "relaxed?"
Now, if all the stars in a cluster have identical masses, then their net effects on each other are equal; on average, over long periods of time, each star will gain and lose equal amounts of energy due to its interactions with its neighbors. The important effect is that the velocities of the stars are randomly re-directed.
But if one particular object happens to be more massive than its neighbors, a very interesting and asymmetric phenomenon can occur: dynamical friction. The basic idea is that the massive object will gradually lose energy as it moves through a cluster of less-massive objects.
Why? Well, consider one massive object as it approaches a region of space filled with low-mass objects at some initial density n. In the picture below, that density appears to be about 2.5 stars per box.
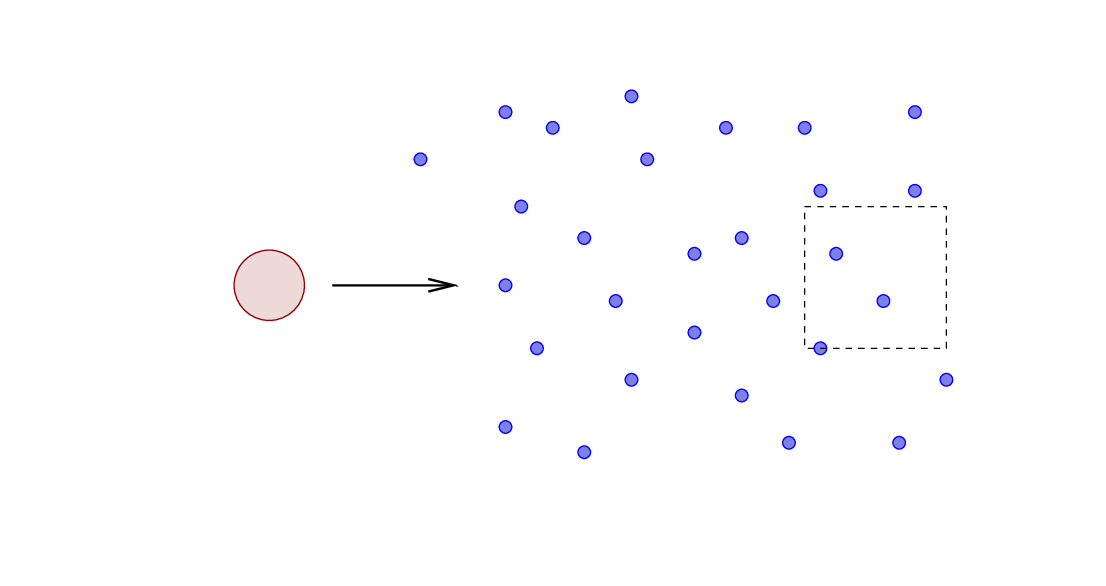
As the large object starts to move through the region, its gravitational force on the surrounding low-mass objects applies a weak force on them. Due to symmetry, the net action of these weak forces acts perpendicular to the path of the massive object, pulling the low-mass objects in that direction.
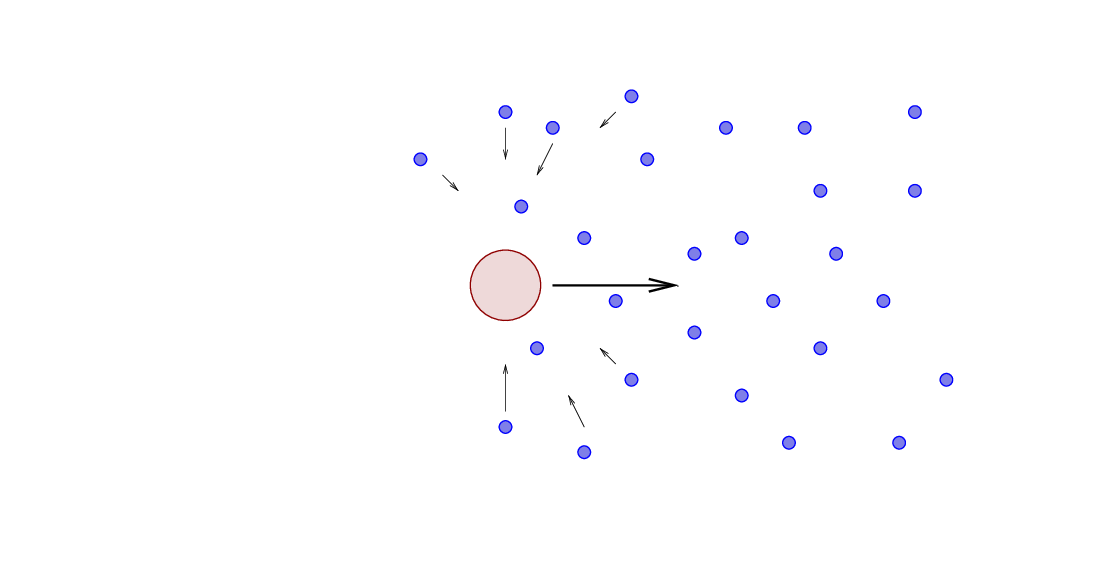
After the large object has passed, those motions cause the small objects to gather together in its wake. In other words, an over-dense region appears BEHIND the large object.
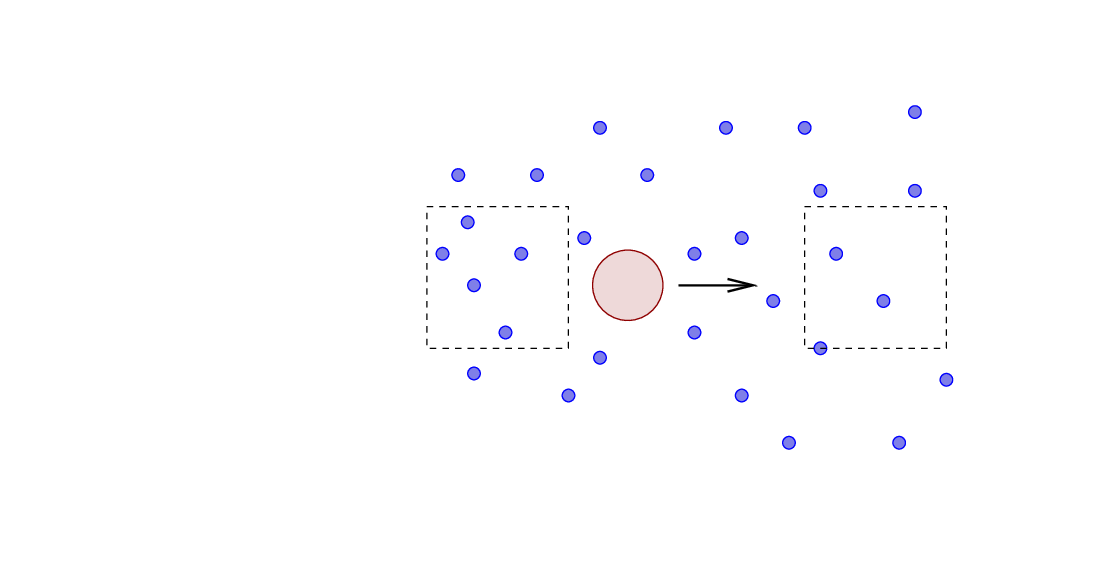
The gravitational force of this dense region, pulling BACKWARDS on the large object, is larger than the gravitational force of the pristine region which lies in front of the big object. Therefore, the re-arranged medium around the large object exerts a net force BACKWARDS -- which acts just like friction. Hence, dynamical friction.
As the textbook shows (see section 7.1.1.), one can work through a series of approximations similar to those we did last time in order to derive an estimate for the size of this friction force. One way to express it is the rate at which the large object's speed slows down:

Here,
For our purposes, the important question is "does this have any OBSERVABLE consequence in a star cluster?" In some cases, the answer turns out to be "yes -- though it's not easy to see." Imagine a cluster of stars, all moving in random directions with some roughly equal kinetic energy. If the stars aren't identical, but cover some range of masses, then initially
In other words, we expect that the stars should be well-mixed, with no difference in distribution as a function of mass.
However, over time, dynamical friction will slowly steal energy from the high-mass stars, transferring it to the low-mass stars. As a result, high-mass stars won't be able to fly out to reach the very edges of the cluster; some of low-mass stars, on the other hand, with the extra energy they have gained, will tend to spend more of their time in these outer regions.
So, after a long period of time and many weak gravitational interactions, we would expect to see
In other words, if dynamical friction has had enough time to act, we expect to see mass segregration in the radial distribution of stars.
The theory has made this prediction for decades, but actually testing it in star clusters has been very difficult. The problem is that stars (in globular clusters, especially) are crowded together tightly. Accurately measuring their positions, velocities, and masses, at a precision high enough to see slight differences, hasn't been possible until the last 20 years or so.
But now, thanks to increasingly powerful telescopes, cameras, and spectrographs, we do have evidence that dynamical friction has been happening in at least a few clusters.
In the open cluster M35, for example,
Image of open cluster M35 (slightly cropped) courtesy of
Astronomy Picture of the Day,
Evan Tsai
and LATTE: Lulin-ASIAA Telescope
Motherway, E., et al., ApJL 962, L9 (2024) were able to measure the radial distribution of single and binary stars (left panel), and even separate binary stars into groups by mass:
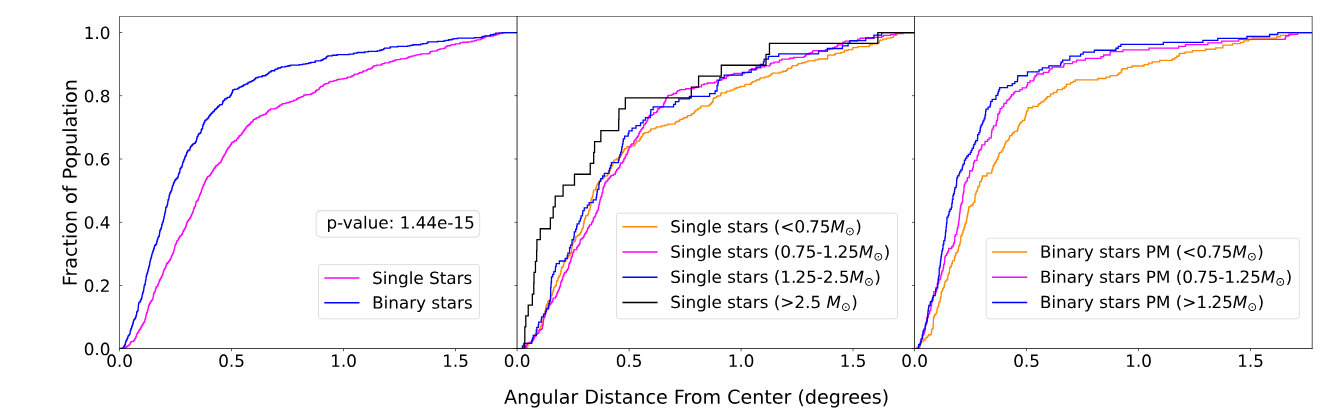
Figure 4 taken from
Motherway, E., et al., ApJL 962, L9 (2024)
In the globular cluster 47 Tuc
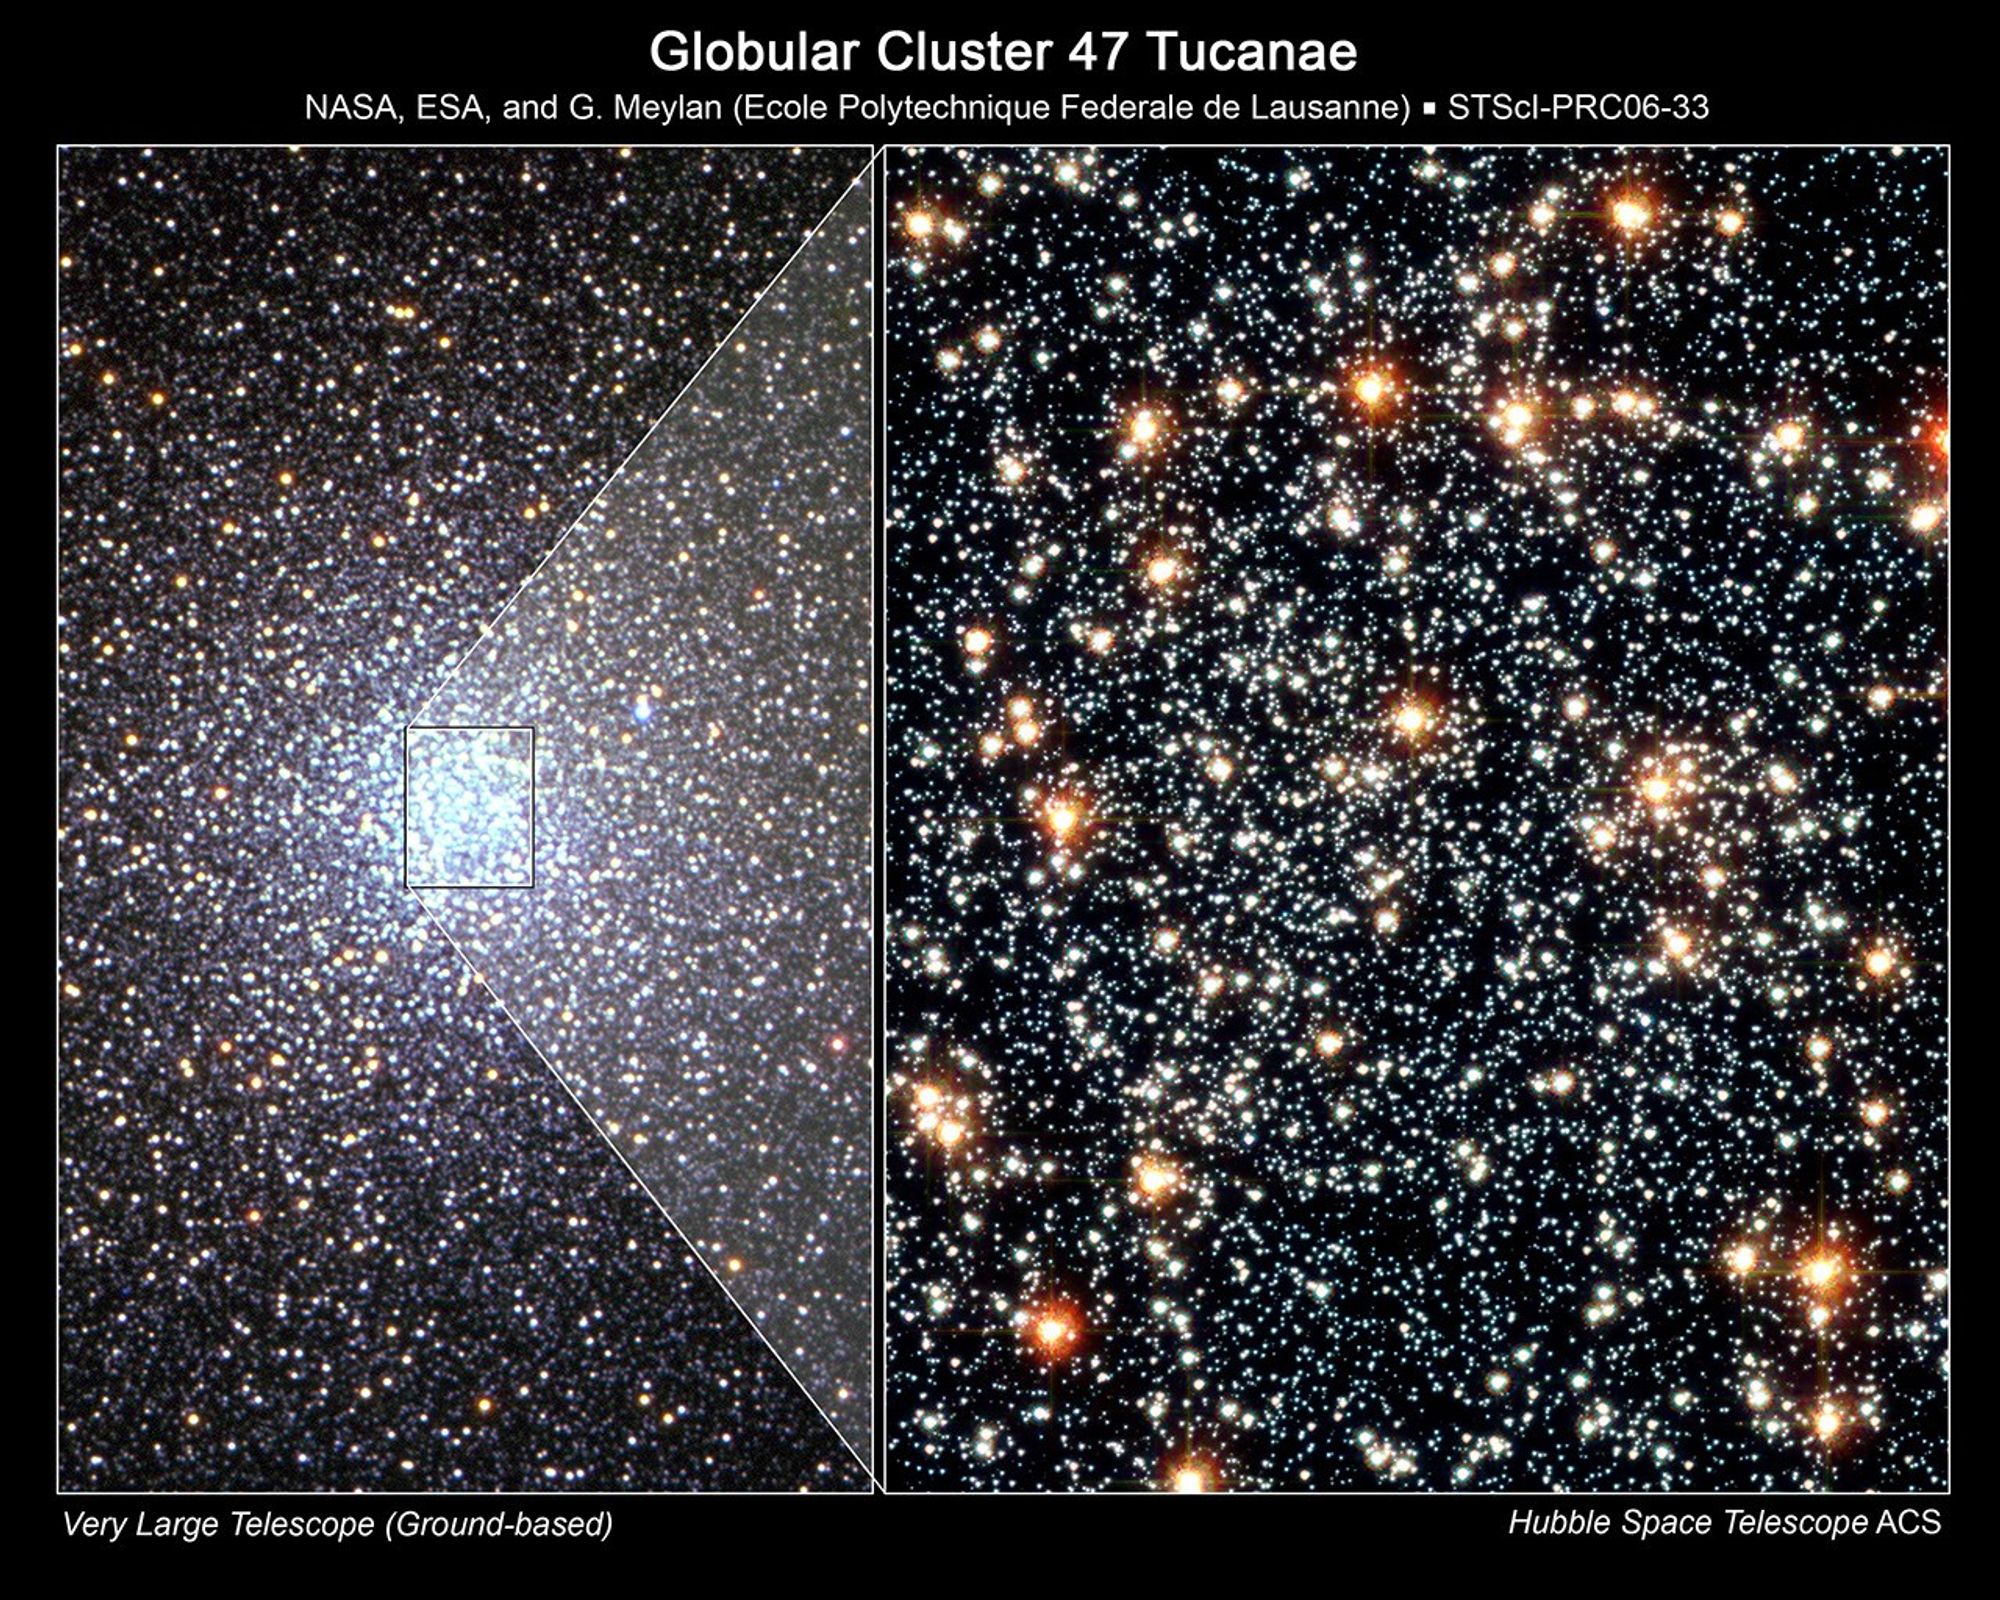
Image of 47 Tuc courtesy of
Ground-Based Image: Very Large Telescope/European Southern Observatory, R. Kotak and H. Boffin (ESO); Hubble Image: NASA, ESA and G. Meylan (Ecole Polytechnique Federale de Lausanne
McLaughlin, D. E., et al., ApJS 166, 249 (2006) created a sample of "blue stragglers" (more massive than average) and red giants (less massive than average), and determined their properties. In the lower-right panel, the radial distribution of of the blue stragglers are shown with solid black line, while those of the red giants are shown with a dashed line.
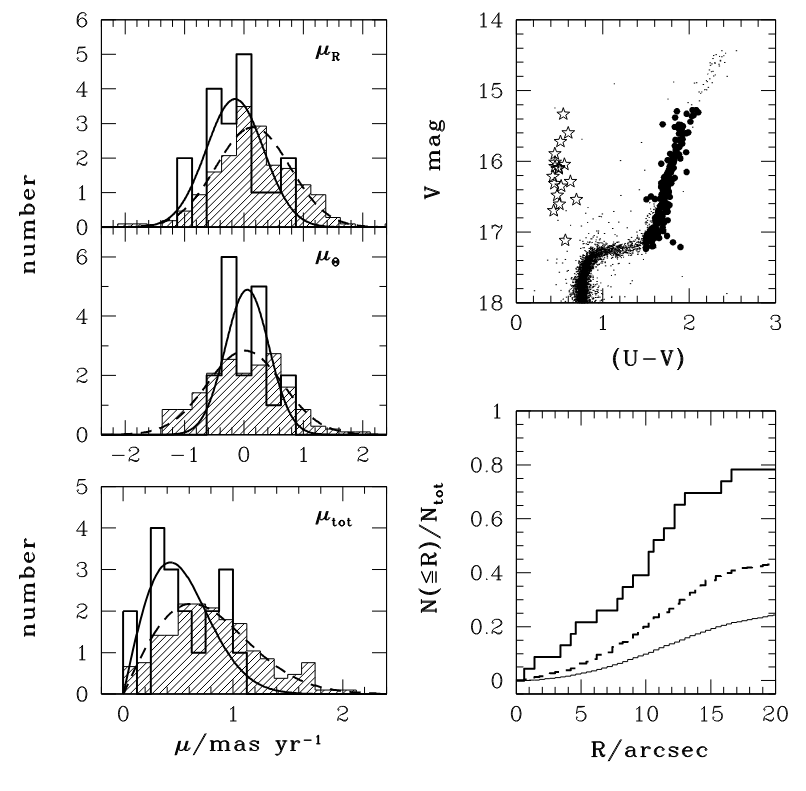
Figure 22 taken from
McLaughlin, D. E., et al., ApJS 166, 249 (2006)
Q: Which stars are more concentrated toward the center?
Another study of 47 Tuc concentrated on white dwarf stars in the cluster. White dwarfs are the final stage in the life of a low-mass star:
Note that in step 4, the star sends a good fraction of its total mass off into space; thus, the white dwarf is less massive than the main-sequence star.
Heyl, J., et al., ApJ 804, 32 (2016) looked carefully at the white dwarfs in this cluster and divided them into two groups (see left-hand panel):
They then measured the position of all the white dwarfs, and plotted the radial distribution of each group (see right-hand panel).
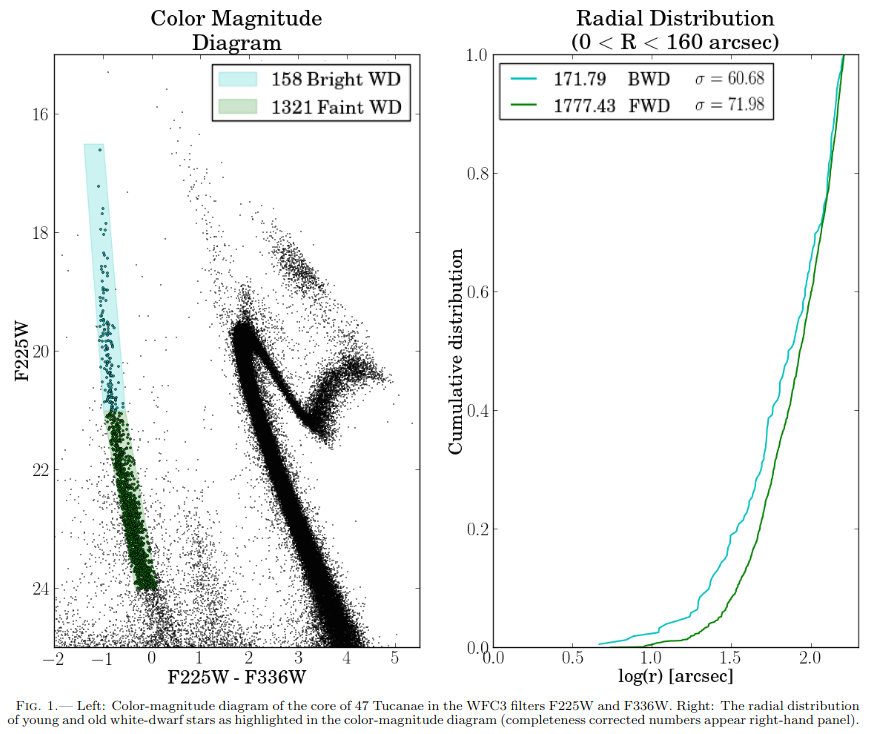
Figure 1 taken from
Heyl, J., et al., ApJ 804, 32 (2016)
Q: Why are the radial distributions different?
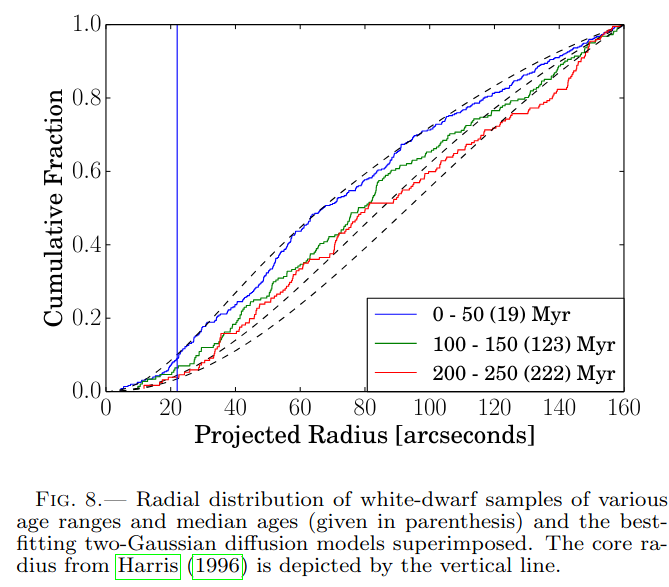
Figure 8 taken from
Heyl, J., et al., ApJ 804, 32 (2016)
Copyright © Michael Richmond.
This work is licensed under a Creative Commons License.