 Copyright © Michael Richmond.
This work is licensed under a Creative Commons License.
Copyright © Michael Richmond.
This work is licensed under a Creative Commons License.
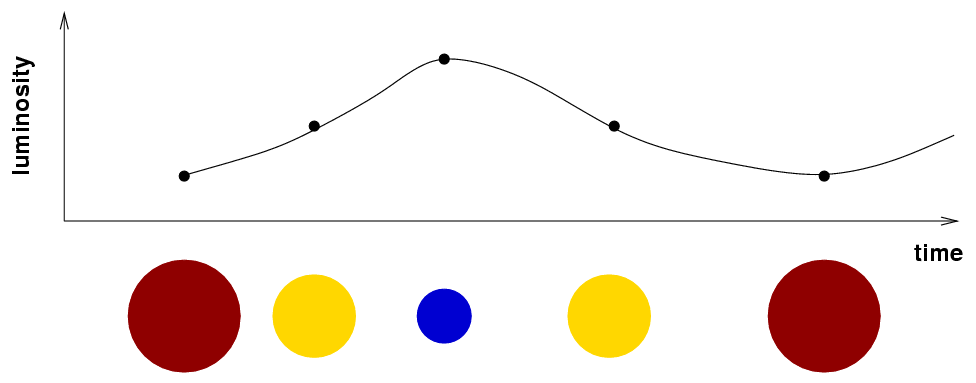
Some stars show periodic variations with a characteristic light curve shape: a quick rise, followed by a slower decline:

Taken from
Bonanos et al., 2004AJ....127..861B
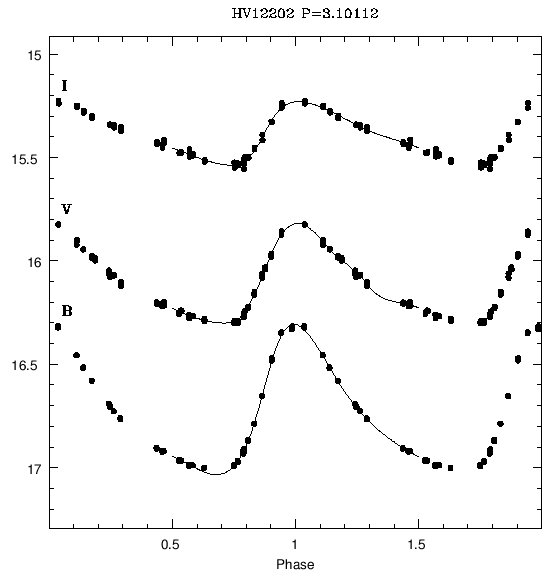
Taken from Musella et al., 2006MmSAI..77..291M
It turns out that these stars change their size, color and luminosity in a periodic manner. The diagram below shows a rough approximation of the relationships.
Why do the stars grow and shrink? Hmmm. The answer might make more sense if we first consider a more familiar situation -- a pot of water with a lid, full of water, sitting on a hot stove.
Q: What happens as the water starts to boil?(Click the picture to find out)
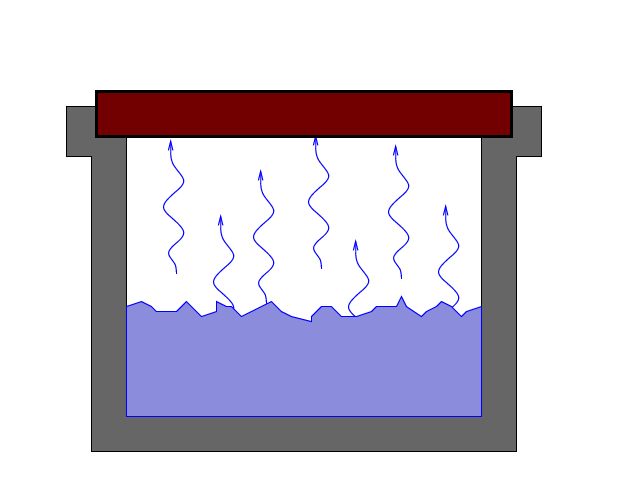
As water turns into steam, it presses against the walls of its container. The pressure pushes the lid upwards, against the force of gravity. But when the lid rises high enough to expose a gap through which the steam can escape, the pressure inside the pot drops suddenly. As a result, the lid falls back into place, and the cycle begins anew.
In a way, the same cycle happens inside certain types of stars. Stars don't have REAL lids, of course ... but under certain circumstances, they can contain a sort of lid. It all boils down (hah!) to the interaction of light with atoms.
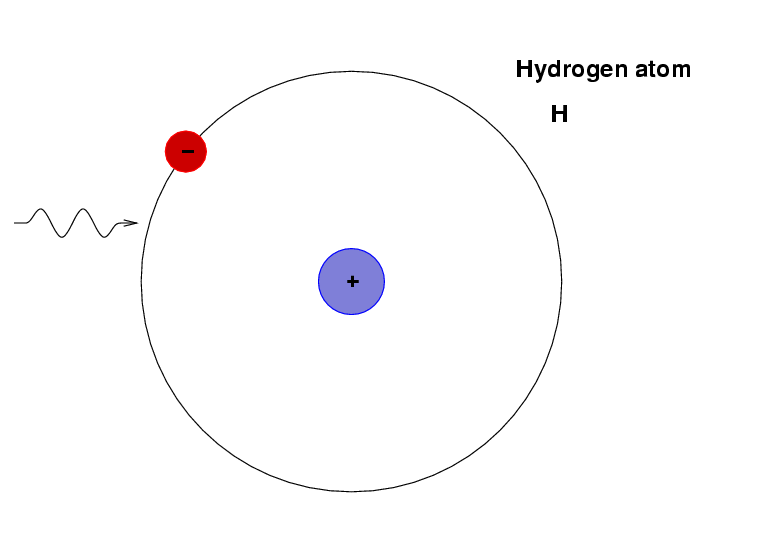
Ordinary hydrogen, for example, consists of a negative electron attached to a positive proton. The result is a neutral atom.
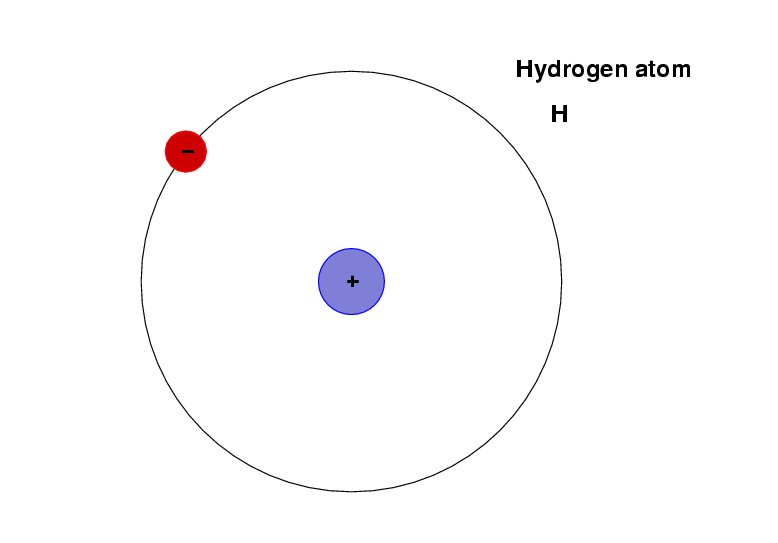
If a photon of ordinary visible light impinges on this atom, it will very probably pass right through it.
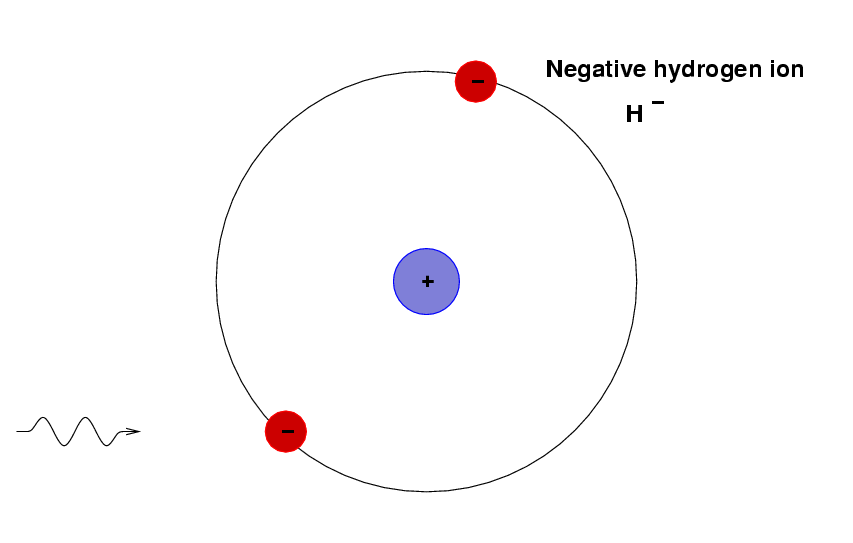
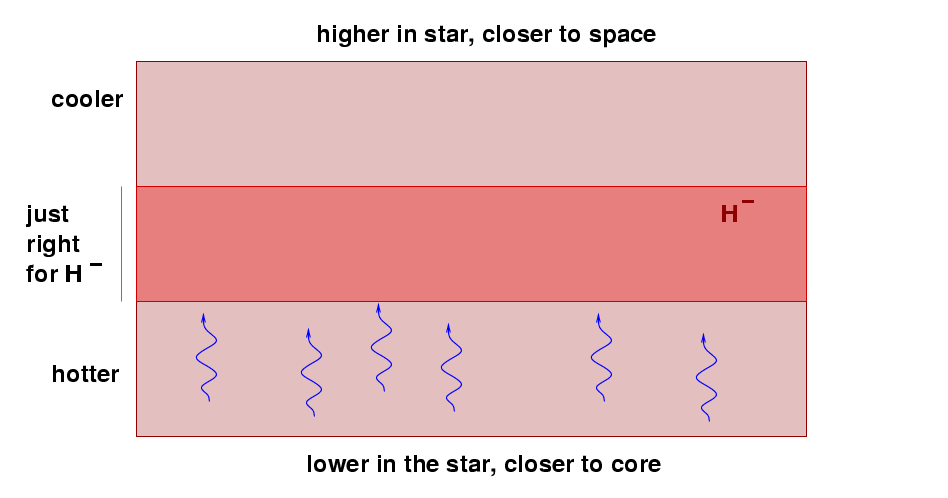
Deep inside some stars, the conditions --- temperature, pressure, chemical composition, electron density --- allow a variety of hydrogen to form: the negative hydrogen ion.
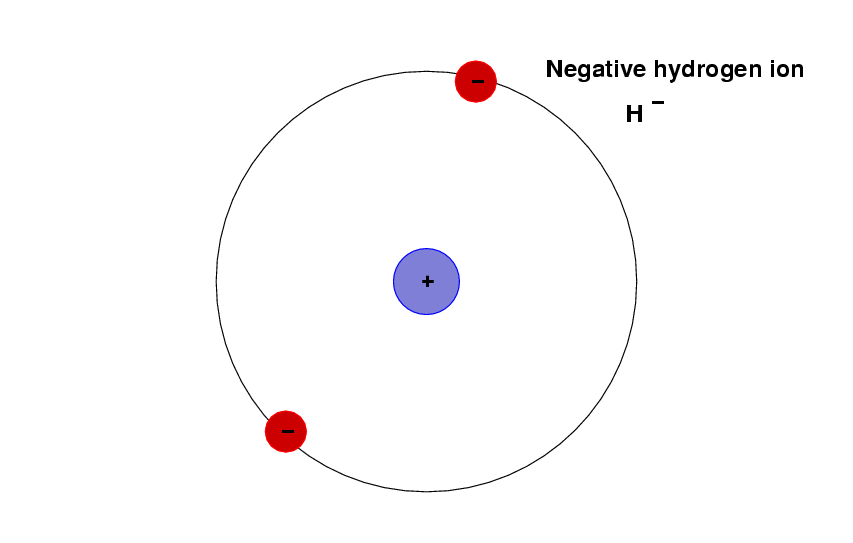
It turns out that the second electron in this ion makes the ion much more likely to interact with passing photons.
So, let's consider a star which has a layer somewhere in its interior which is rich in negative hydrogen ions (or negative helium ions, which behave in a similar manner).
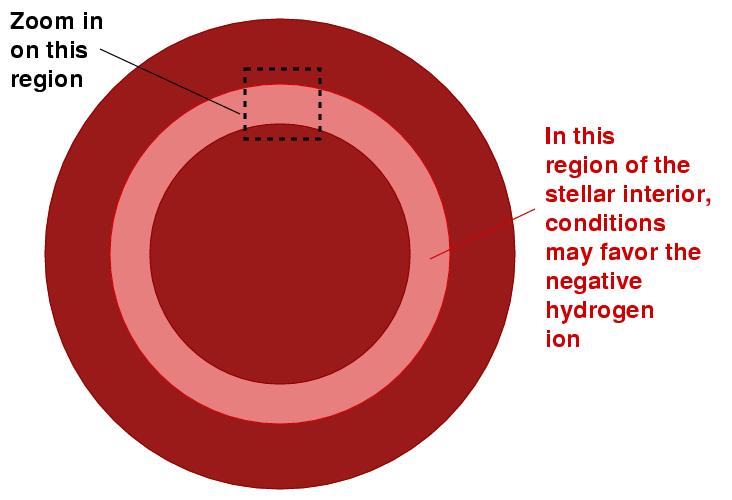
If we zoom in on that region, we see that photons can't pass through it easily. On their way out from the center of the star into space, many of the photons are absorbed by ions. The collisions push the ions in this layer outwards, away from the hot center of the star.
(Click the image to see what happens)
As a result of this instability, the outer layers of the star expand and cool, then contract and heat up, and the star shrinks and grows in brightness.
Which stars suffer from this sort of instability in their outer atmospheres? It turns out that conditions are right only for a relatively small fraction of all stars; most do NOT pulse in any significant manner.
Enough with the theory of stellar interiors. How does this help us to measure distances?
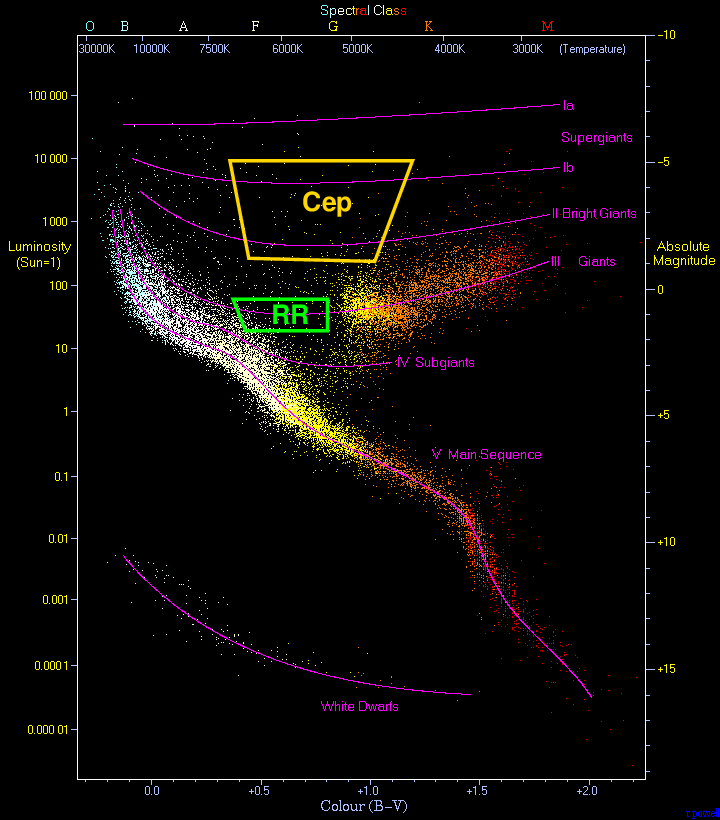
One type of stars, called RR Lyrae stars, form a very homogenous group. They all have roughly the same mass, the same (average) size, the same (average) temperature, and so approximately the same (average) luminosity. This luminosity turns out to be high enough to make them visible throughout our own Milky Way Galaxy, as well as in some of the nearest neighbors of the Milky Way.
Most RR Lyrae stars are relatively old and have masses somewhat less than that of the Sun; ranging from about 0.5 to 0.7 solar masses. They sit in a region of the HR diagram called the instability strip, above the main sequence and at moderate temperature.
Background image of HR diagram courtesy of
Atlas of the Universe
Here's a closeup of the RR Lyrae region in the globular cluster M3, with evolutionary tracks showing the paths of stars with masses ranging from 0.58 to 0.80 solar masses (with the lower-mass models at left).
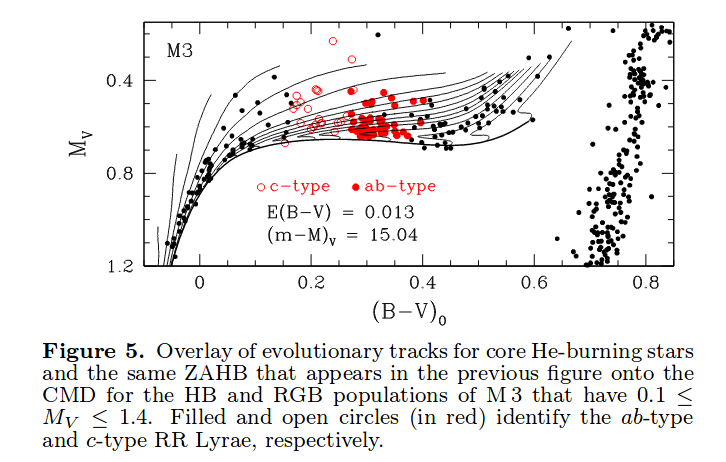
Figure 5 taken from
VandenBerg, Denissenkov and Catelan, ApJ 827, 2 (2016)
RR Lyrae stars are easy to find, because their periods are short -- just 9 to 18 hours or so -- and the amplitude of their variations is large: up to 1 magnitude! You can easily pick out the RR Lyrae stars in this "movie" of M3, which uses images taken during a single night:
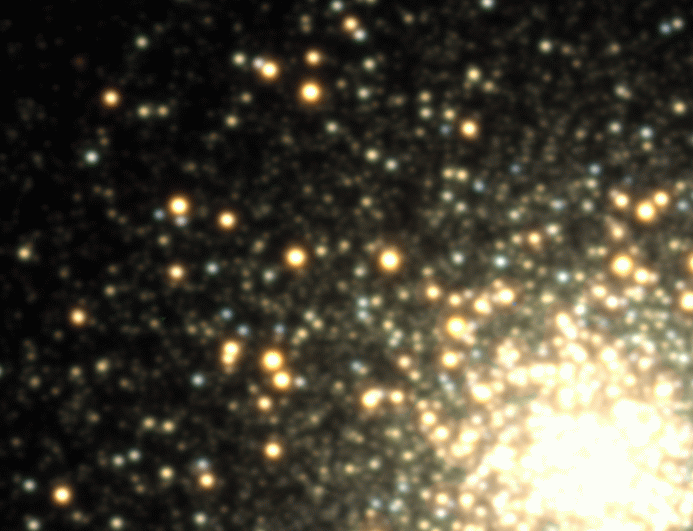
Image courtesy of
Joel Hartman and Kristoff Stanek
Now, to a rough approximation, all RR Lyrae stars have the same luminosity, which makes it very easy to use them as rough distance indicators:
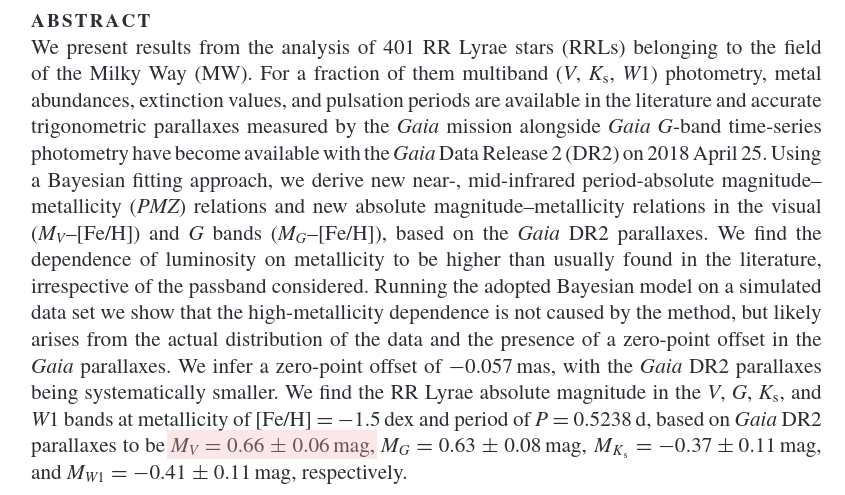
Abstract of the paper
Muravera et al., MNRAS 481, 1195 (2018)
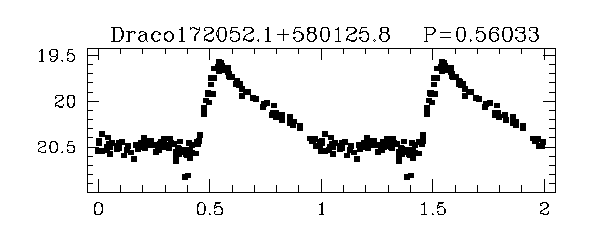
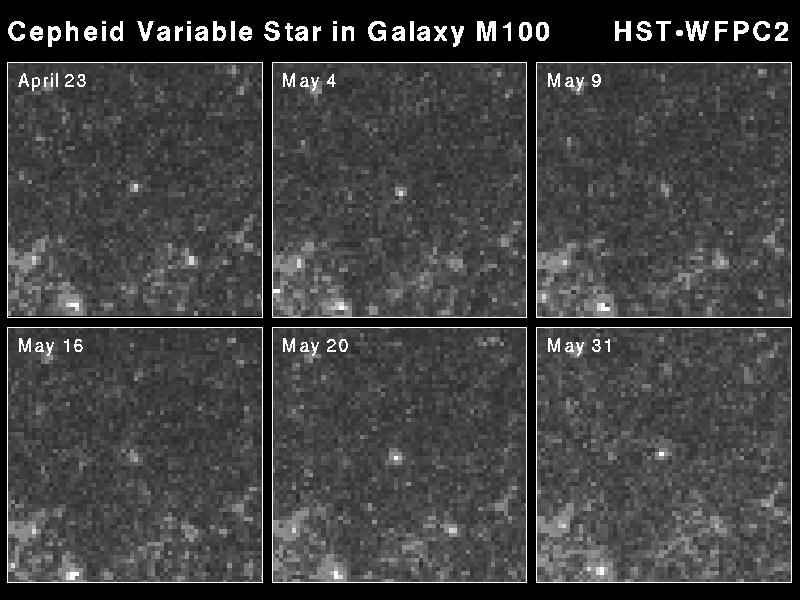
Let's try out this simple method! Bonanos et al. AJ 127, 861 (2004) provide V-band light curves for RR Lyrae stars in a small galaxy called "the Draco Dwarf Spheroidal Galaxy", a member of our Local Group.

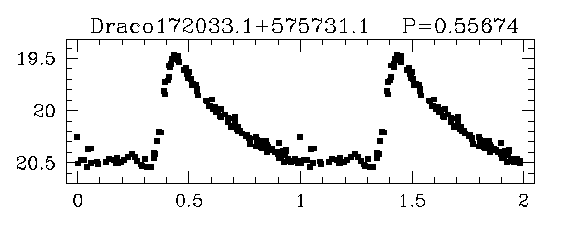
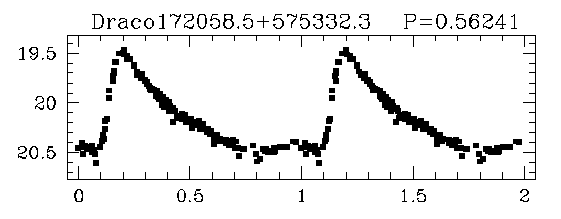
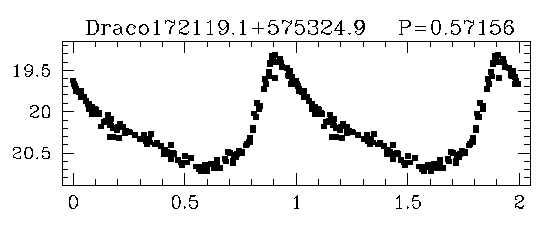
   Q:  How far from us is the Draco dwarf spheroidal galaxy?
           Provide your answer in terms of  distance modulus,
           and in kpc.
   Bonanos et al. (2004) derived a distance of

             d   =  75.8  +/- 5.4  kpc

   to the Draco dwarf galaxy.  How does your value compare to theirs?
So, if conditions are just right within a certain region of a star's interior, the opacity of one layer of material can undergo large changes. When that happens to stars which are roughly Sun-like in mass, the result is a pulsating star of the RR Lyr class. In the much less common -- but much more interesting -- case of a massive star, the resulting variable star is called a delta Cepheid, or Cepheid for short.
Because they are more massive, Cepheids shine much more brightly than RR Lyr stars.
In order to use Cepheids as distance indicators, we need a considerable number of measurements of their brightness, over periods of many days, or weeks, or even months. So, Cepheids are more difficult to use -- but can reach distances far beyond the range of RR Lyr stars.
The key to using Cepheids as distance indicators, as astronomer Henrietta Leavitt discovered long ago, is the connection between the period of a Cepheid variable star and its luminosity.
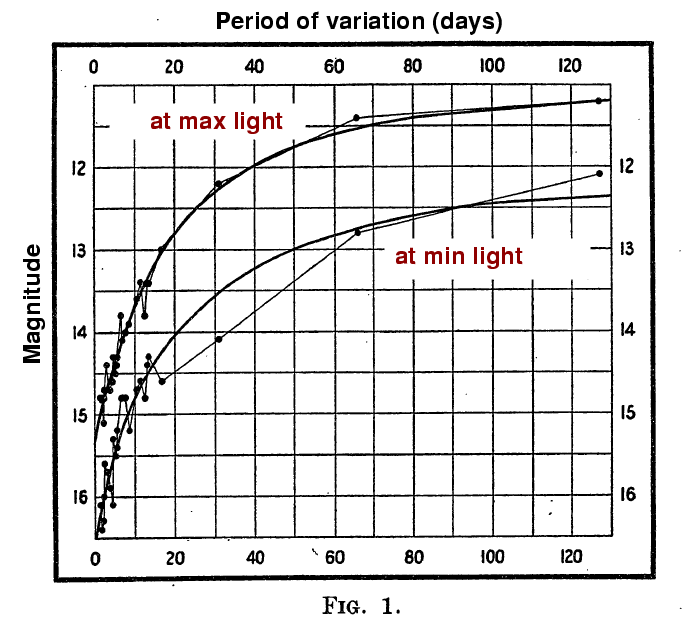
This figure taken from
Leavitt and Pickering's original paper, published in 1912
This period-luminosity relationship becomes even simpler if we take the base-10 logarithm of the luminosity.
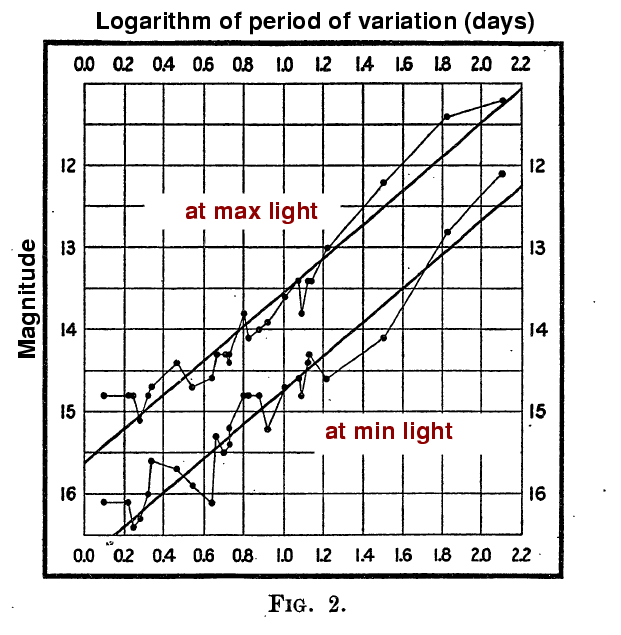
This figure taken from
Leavitt and Pickering's original paper, published in 1912
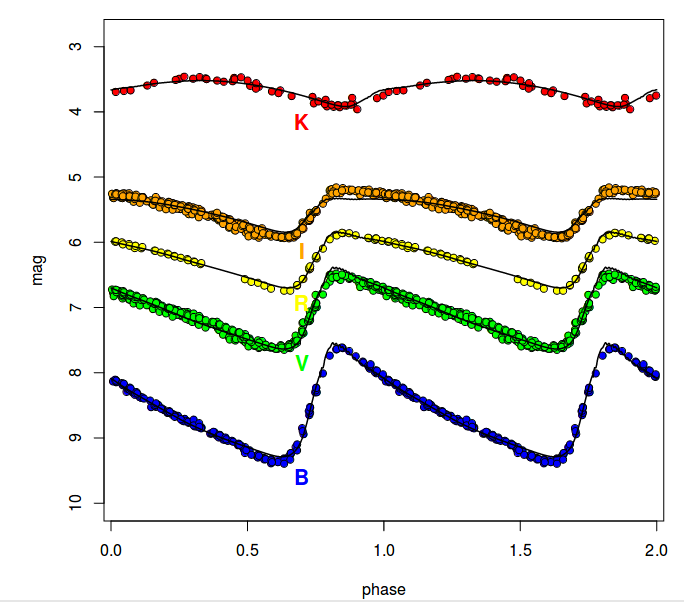
Now, it turns out that there are two populations of stars called "Cepheids", both of which pulse over periods of 1 to 100 days, but which have very different luminosities. I'm going to concentrate on the "classical" or Type I Cepheids, and ignore the Type II Cepheids, in the following discussion; if you want to learn more about the Type II variables, see the papers by by Gingold, MmSAI 56, 169 (1985) and by Wallerstein, PASP 114, 797 (2002) mentioned in the For more information section at the end of this webpage.
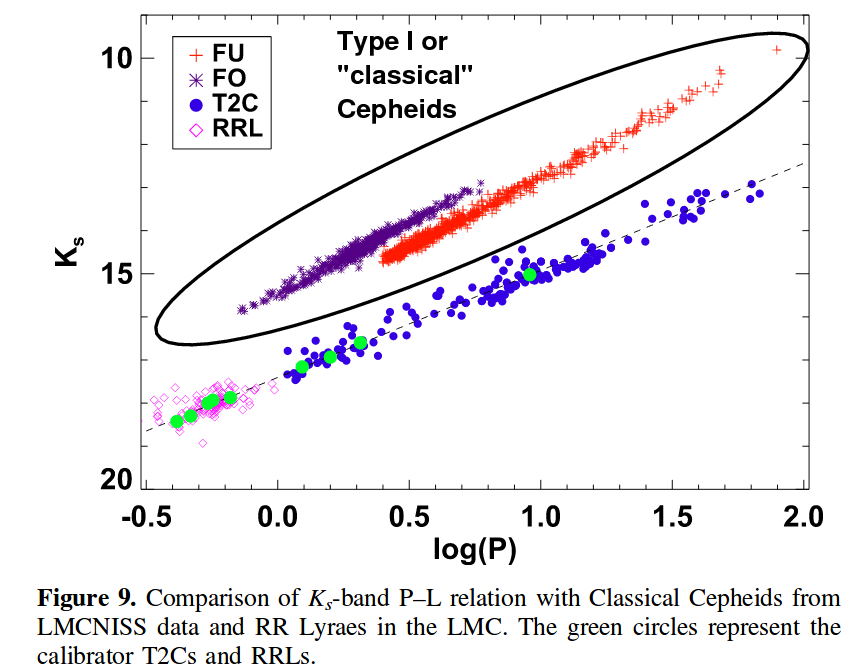
Modified from Figure 9 of
Bhardwaj et al., AJ 153, 154 (2017)
What sort of stars are classical Cepheids? They are relatively massive, and therefore relatively young, stars, which have just run out of hydrogen in their cores and so have evolved off the main sequence and into the red giant branch. However, as their core regions pass through several evolutionary stages, the stars evolve away from the giant region and make "blue loops" into the instability strip, where layers in their outer atmospheres become subject to the kappa instability discussed earlier.

Background image of HR diagram courtesy of
Atlas of the Universe
Let's look at a small sample of Cepheids in a cluster within the Large Magellanic Cloud. The figure below shows the location of the Cepheids in the HR diagram, and it shows evolutionary tracks for stars of several ages. The different colors represent models with different versions of convection in the stellar atmosphere. Note how the models first reach the red giant branch (RGB), then make a "blue loop" and pulse as Cepheids, before returning to the asymptotic giant branch (AGB). The models suggest that the stars which are currently Cepheids have masses of about 4.2 solar masses.
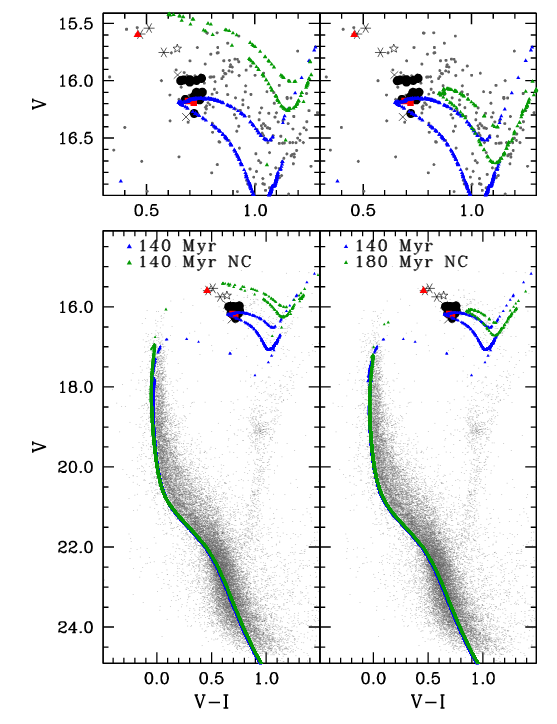
Figure 8 taken from
Musella et al., MNRAS 457, 3084 (2016)
How can one use Cepheids to determine the distance to a cluster, or a galaxy? The basic procedure sounds pretty simple, but there are many complications in real life.
| Step | Complication(s) |
|---|---|
| Make repeated measurements of brightness of many stars | There can be hundreds or thousands of ordinary stars for each Cepheid |
| Identify those which have Cepheid-like light curves | Amplitude of variation is largest in blue, as shown in Fig 12 of Gaia Collaboration, arXiv:1705.00688 (2017), but extinction is most severe in blue |
| Measure the period P and apparent magnitude m of the Cepheids | Requires multiple epochs over many weeks or months to measure period properly |
| Use a period-luminosity (PL) or period-luminosity-color (PLC) relationship to determine the luminosity and absolute magnitude M of each Cepheid | Requires multiple passbands of photometry to compute color; and spectroscopy to measure and correct for metallicity |
| Use the apparent magnitude and absolute magnitude to calculate the distance | Must correct for extinction (easiest in infrared) and crowding (difficult in external galaxies) |
Well, let's skip over most of the complicated stuff and give this a try. We'll adopt a period-luminosity relationship from Gaia Collaboration, arXiv:1705:00688 (2017) (we will ignore the metallicity effects):
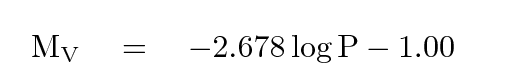
So, let's try to estimate the distance to a nice, nearby spiral galaxy.
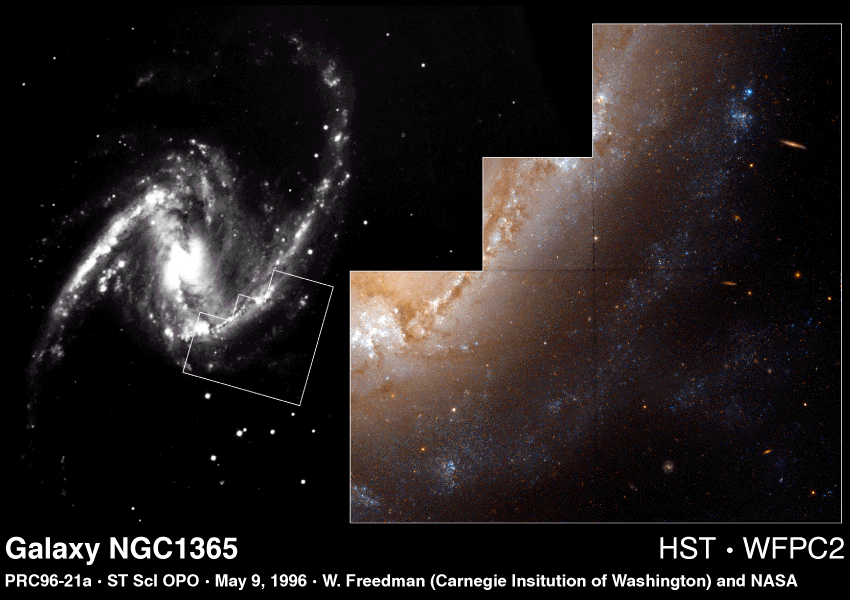
In the figure below, use the symbols marked with filled black circles, which are V-band measurements.
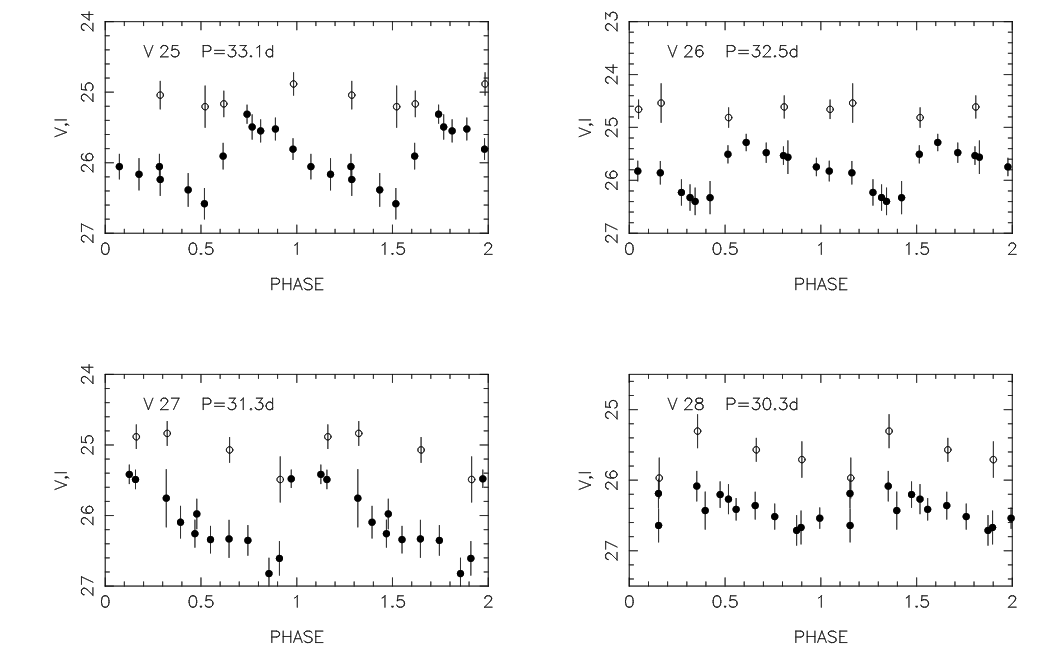
  1.   Pick one variable star.  Measure its average V-band magnitude.

  2.   Use its period to determine its absolute magnitude.

  3.   Compute the distance modulus (m - M)

  4.   Compute the distance to this galaxy, in Mpc
How does you answer compare to that of the authors of the paper from which this data was taken?
  Q:  Was your distance smaller or larger than the authors' value?


  Q:  What could explain that difference?
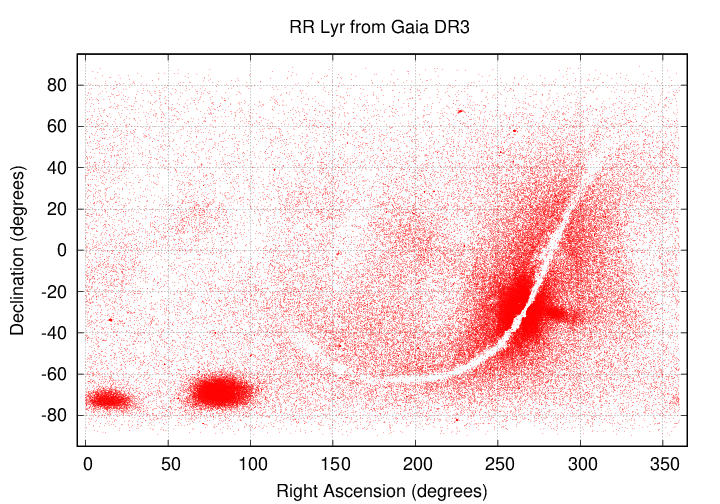
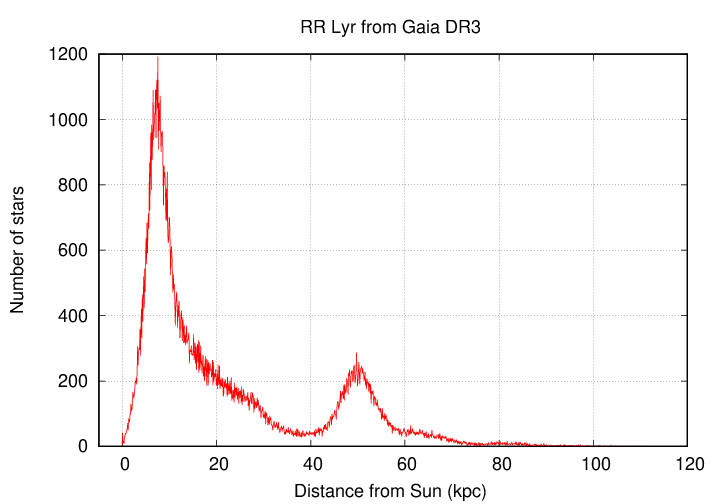
Let's see how useful RR Lyr can be for telling us about the nature of our Milky Way. We'll examine measurements of over 100,000 RR Lyr stars made by the Gaia spacecraft; actually, we'll look at a nice table of information on those stars provided by
I've taken their main table of results, described in Table 5 of the paper, and modified it very slightly for convenience below. Please download a copy of one of the two files to your own computer. The second is just a smaller subset of the first, but may provide quicker response on some laptops.
I've also made a histogram of the distances (in kpc) listed in the full catalog. Please download a copy of this histogram data, too.
First, make a graph showing the (RA, Dec) positions of these stars over the entire sky. Plot columns 2 (on x-axis) and 3 (on y-axis) from the main catalog file. Be sure to make the symbols AS SMALL AS YOU CAN while still remaining visible.
Next, make a graph showing the histogram of distances to these RR Lyr stars.
If you have time, consider this bonus question:
Copyright © Michael Richmond.
This work is licensed under a Creative Commons License.