 Copyright © Michael Richmond.
This work is licensed under a Creative Commons License.
Copyright © Michael Richmond.
This work is licensed under a Creative Commons License.
When scientists look at stars in our skies, they see some bright ones, and some faint ones. Are the bright ones really more powerful than the faint ones --- or are they simply closer to Earth, and so appear brighter? Figuring out the fundamental properties of different stars is quite difficult because we don't know their distances ...
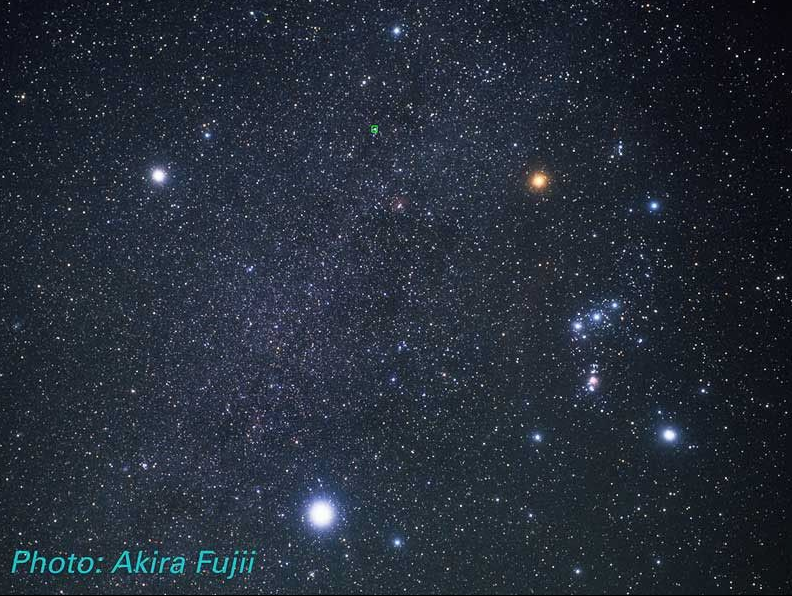
Photograph courtesy of
Akira Fuji
  Q:  Which of these stars is the most powerful?
          Which is least powerful?
The Magellanic Clouds serve astronomers as "remote laboratories:" isolated collections of stars and other objects which are all at (nearly) the same distance. When we measure the properties of objects in the Clouds, we can be sure that their APPARENT relative brightness (or size) is a fair representation of their ACTUAL relative brightness (or size).
For example, consider Cepheid variable stars.
In the early 1900s, the Harvard College Observatory was one of the leading astronomical research institutions in the world. It employed many men to build equipment and go observing, many women to examine and measure photographs and perform numerical computations, and a few lucky male astronomers to analyze the results and publish them.

Photo of Henrietta Swan Leavitt courtesy of
Wikimedia
One of the women, Henrietta Leavitt, was given the task of examining photographic plates of stars in the Magellanic Clouds, the little satellite galaxies which orbit our Milky Way.
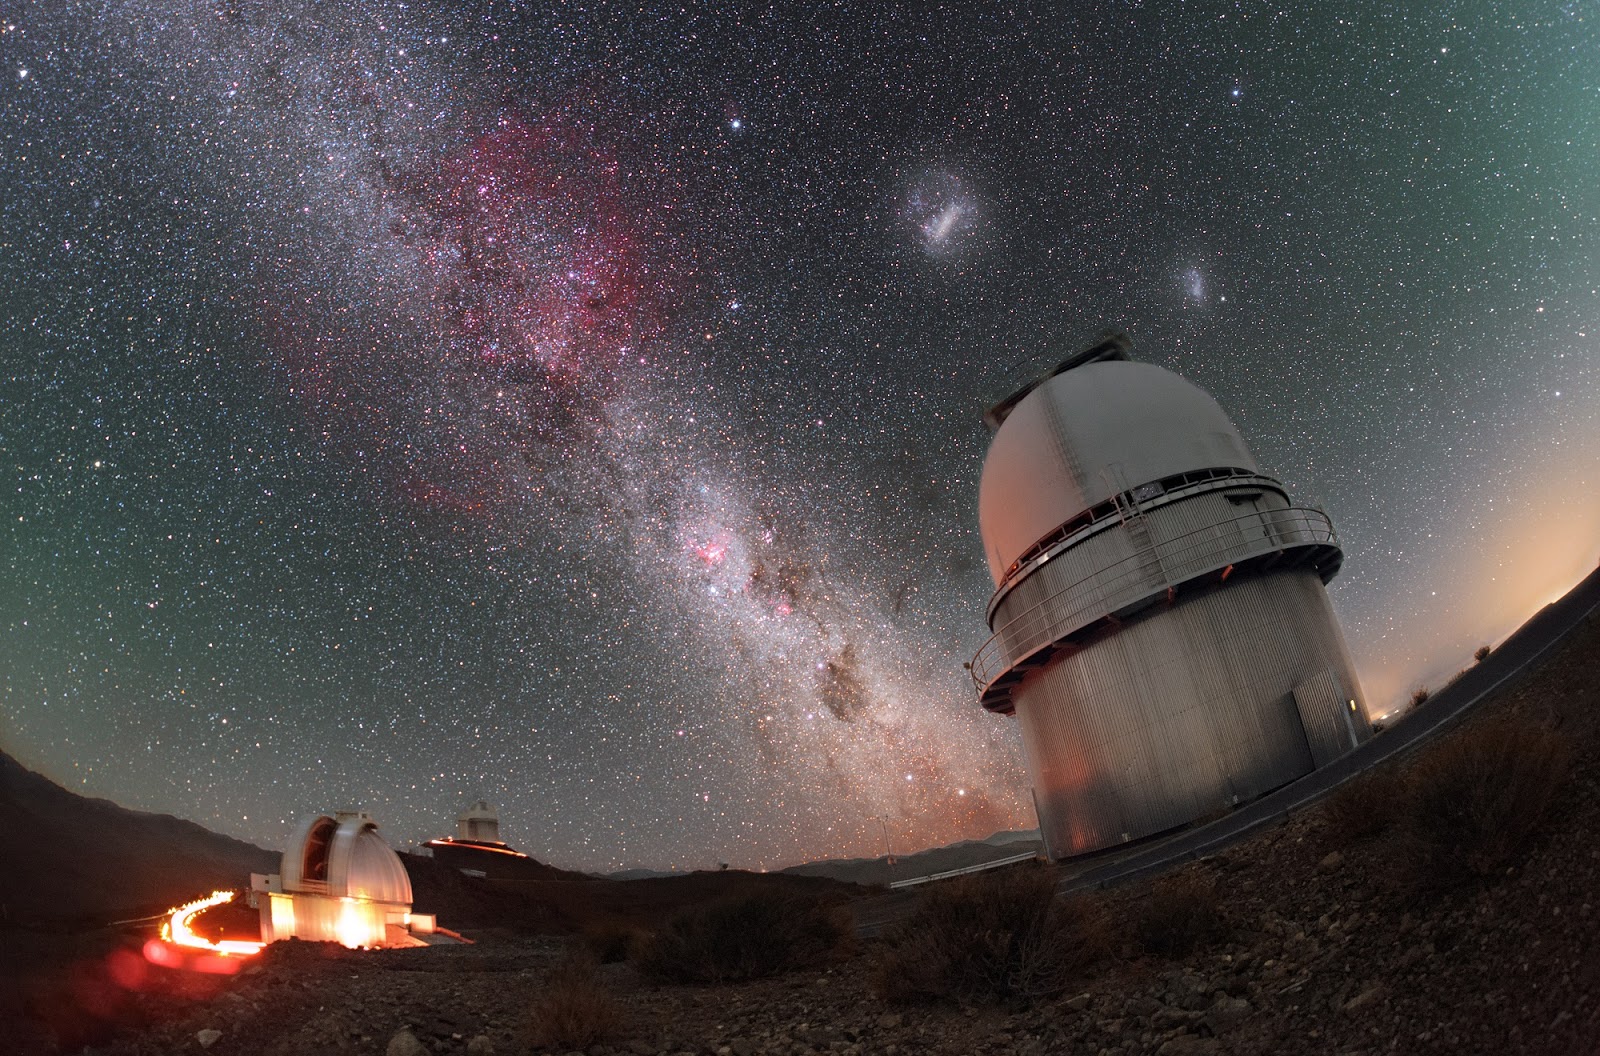
Image of sky over La Silla courtesy of
P. Horálek/ESO
After several years of work, Miss Leavitt found 1,777 variables in photographs of the SMC and LMC. A small fraction of these (25) were Cepheids in the SMC. She noticed that the Cepheids with long periods were brighter than those with short periods, whether she used the magnitude at maximum light or minimum light.
Figure 1 taken from
Leavitt, H. S., and Pickering, E. C., Harvard Circular 173, 1 (1912)
The effect was even more striking when she made a logarithmic plot of both variables (brightness in magnitudes versus logarithm of the period):
Figure 2 taken from
Leavitt, H. S., and Pickering, E. C., Harvard Circular 173, 1 (1912)
She wrote
The two resulting curves, one for maxima and one for minima, are surprisingly smooth, and of remarkable form. In Figure 2 ... a straight line can readily be drawn among each of the two series of points corresponding to maxima and minima, thus showing that there is a simple relation between the brightness of the variables and their periods ... Since the variables are probably at nearly the same distance from the Earth, their periods are apparently associated with their actual emission of light, as determined by their mass, density, and surface brightness.(emphasis added)
Her results, including these words, were published by Edward C. Pickering, one of the lucky male astronomers who took a great deal of the credit for the work done by the entire Harvard College Observatory crew. See Harvard College Observatory Circular, vol 173, p. 1, 1912.
Leavitt's discovery of a period-luminosity relationship in Cepheid stars was a breakthrough. The period of a Cepheid is relatively easy (though tedious) to measure. If we can figure out the luminosity which corresponds to any particular period, we may use the inverse-square law to estimate the distance to the star. The Cepheid period-luminosity relationship has become one of the primary tools for astronomers who study relatively nearby galaxies; for example, it was one of the main pieces of evidence used to determine that the Andromeda Nebula is actually a separate galaxy, rather than a cloud of gas in the Milky Way.
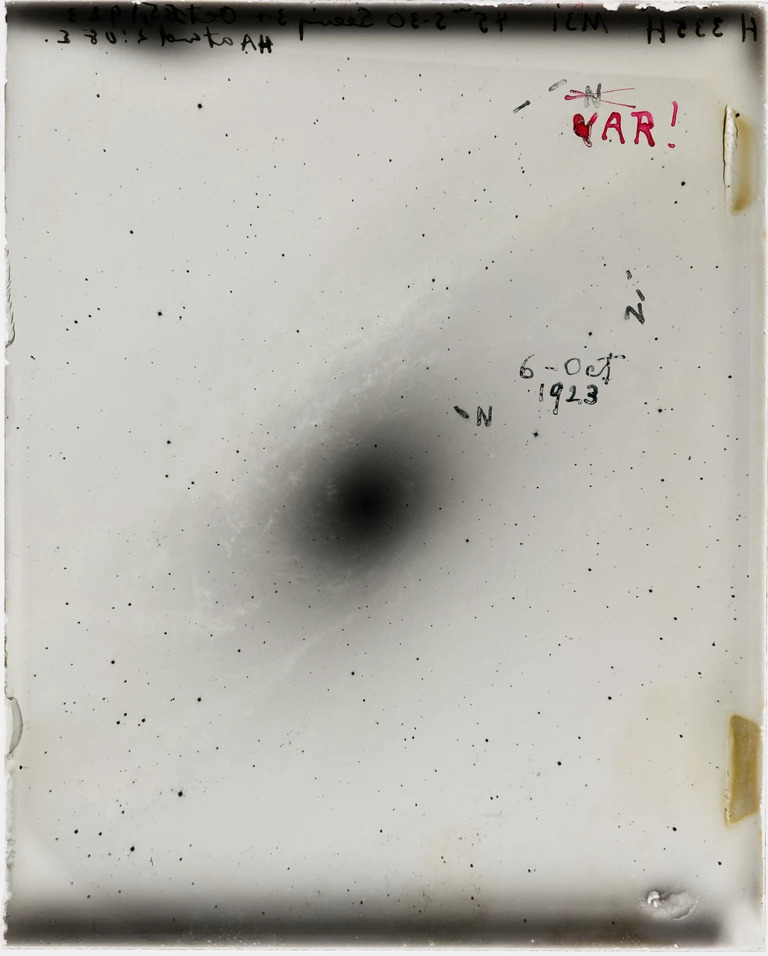
Image courtesy of
Carnegie Science
You are, I hope, familiar with the Hertzsprung-Russell diagram. The examples below use data from the Gaia satellite and were created in 2018. I've drawn a green box over a section of the red giant branch which appears to have a larger density of stars: the red clump (a very imaginative name, isn't it?)
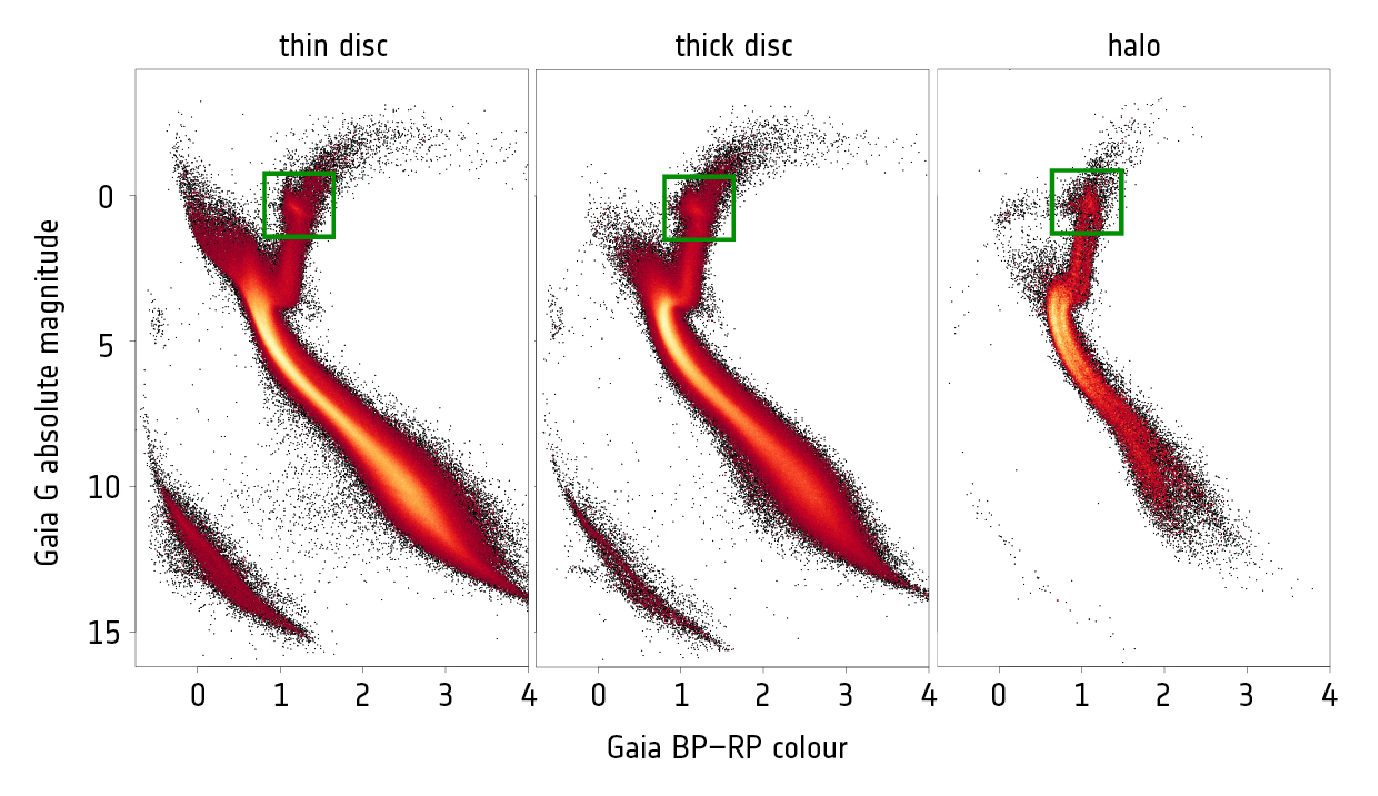
Color-magnitude diagrams courtesy of
Gaia Data Processing and Analysis Consortium (DPAC); Carine Babusiaux, IPAG – Université Grenoble Alpes / GEPI – Observatoire de Paris, France.
This region of the HR diagram was first identified as a possibly useful feature back in 1970:
It seems to have been largely ignored for the next two decades, but came back into prominence in the 1990s, when a small number of astronomers realized that IF this clump were sufficiently small and well-defined, and IF it had properties which could be predicted for a given stellar population, then it might become a useful distance indicator.
Where could one find a set of red-clump stars which were all at the same distance, and suffering nearly the same extinction, so that one could verify that this feature really had promise?
Below are figures showing a closeup of the HR diagrams for four regions of the SMC ...
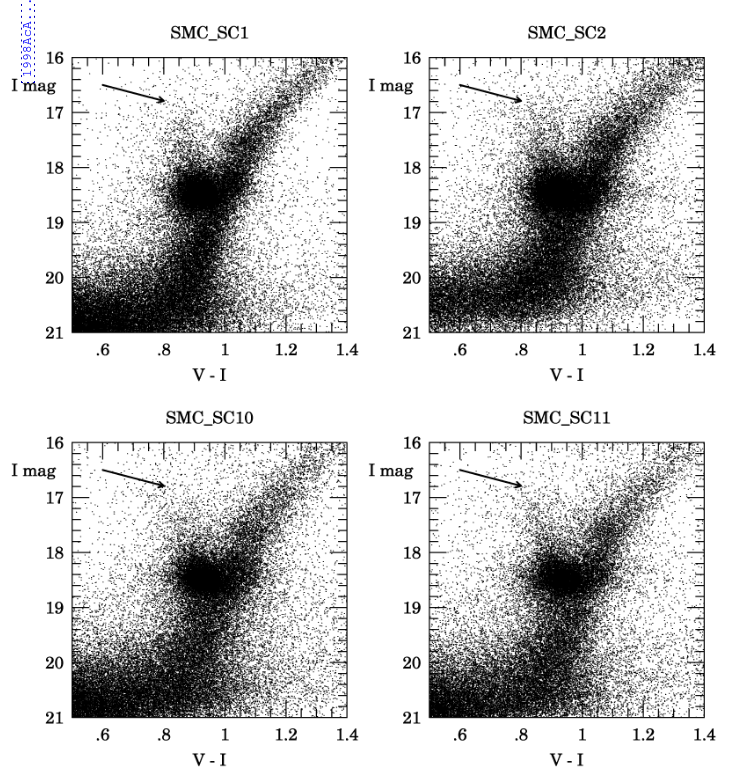
Figure 2 taken from
Udalski, A., et al., Acta Astronomica, 48, 1 (1998)
... and the LMC.
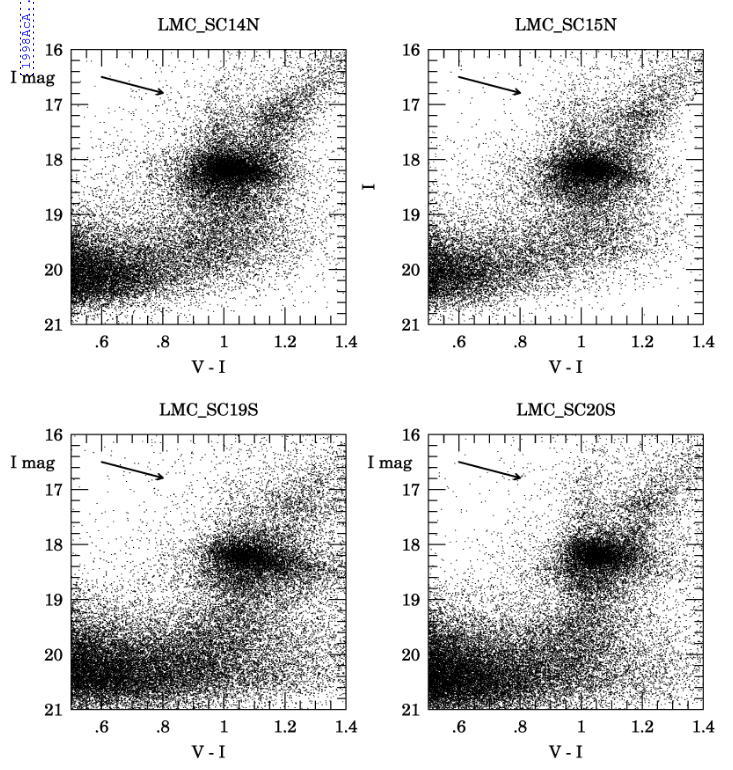
Figure 3 taken from
Udalski, A., et al., Acta Astronomica, 48, 1 (1998)
The clump really does have the properties required for a good distance indicator: easy to recognize, a group of stars with uniform properties, and luminous enough to be visible in other galaxies.
  Q:  Stars in the red clump have an absolute magnitude of MI = -0.23.
          What is the distance to the SMC?
          What is the distance to the LMC?
The size, temperature, luminosity, and age of a star all depend to some extent on its metallicity: the amount of "metals" (elements other than hydrogen and helium) in its gaseous body. Astronomers describe metallacity using the following notation, which compares the fraction of "heavy" elements in some star to the fraction of the same "heavy" elements in the sun.

  Q:  Suppose we measure the metallicity of star which is identical
           to the Sun in every way.  What would its value of
           [M/H] be?
Stars in the Milky Way, particularly those in the solar neighborhood, share a relatively narrow spread of metallicities. The majority of stars have values between solar (0.0) and slightly metal-poor (-0.20 or so).
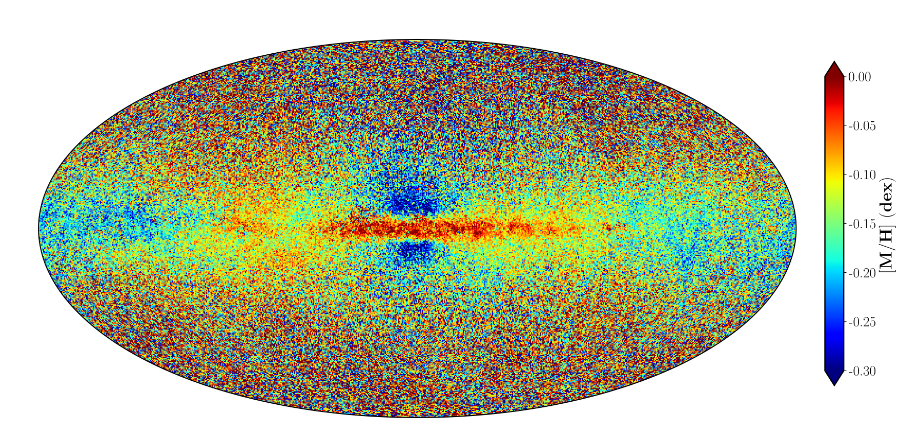
Taken from Figure 2 of
Gaia Collaboration et al., A&A 674, A38 (2023)
The most metal-poor stars in the galaxy appear far above and below the plane of the disk, as the figure below reveals: the different colors represent measurements of stars at different distances away from the plane in kpc. Note that even the metal-poor stars in the halo still have typical metallicities of about -0.5.
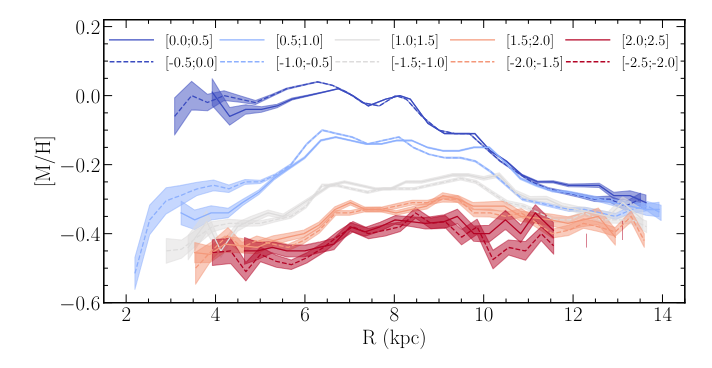
Taken from Figure 13 of
Gaia Collaboration et al., A&A 674, A38 (2023)
If astronomers want to study the effects of chemical composition on stellar properties, the Milky Way provides only a small range of initial values.
  Q:   A star in the halo of the Milky Way has [M/H] = -0.6.
          How different is its fraction of heavy elements compared
          to the Sun's?


              a)  about 0.50 of the Sun's value
              b)  about 0.36 of the Sun's value
              c)  about 0.25 of the Sun's value
              d)  about 0.05 of the Sun's value
Stars in both the Large and Small Magellanic Clouds, on the other hand, have MUCH LOWER fractions of heavy elements. Their stars were formed from clouds with very little beyond hydrogen and helium. Moreover, these two neighboring galaxies are close enough that astronomers can measure the properties of their stars with relative ease (well, at least compared to those in all other galaxies).
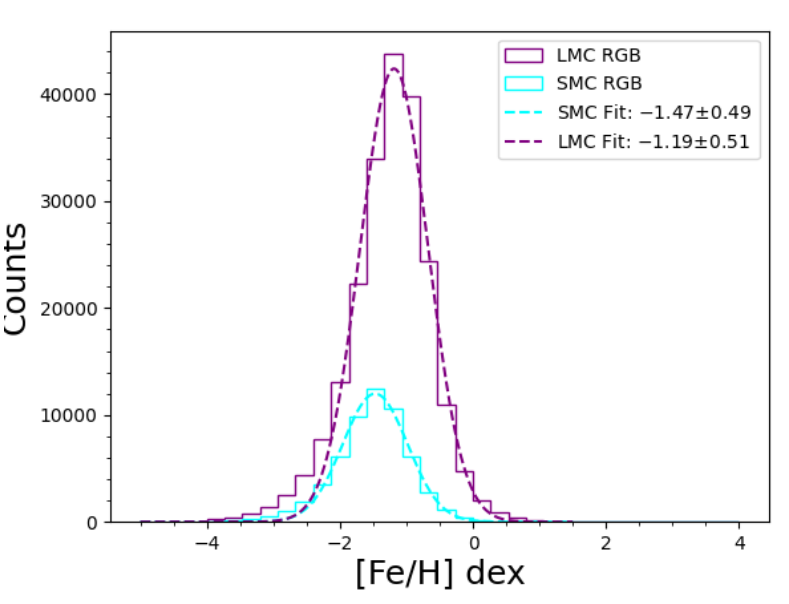
The Gaia spacecraft, despite its small size -- the aperture was only about 1 meter in diameter -- was able to acquire low-resolution spectra of many stars in each of the Clouds. Take a look at the metallicities it measured:
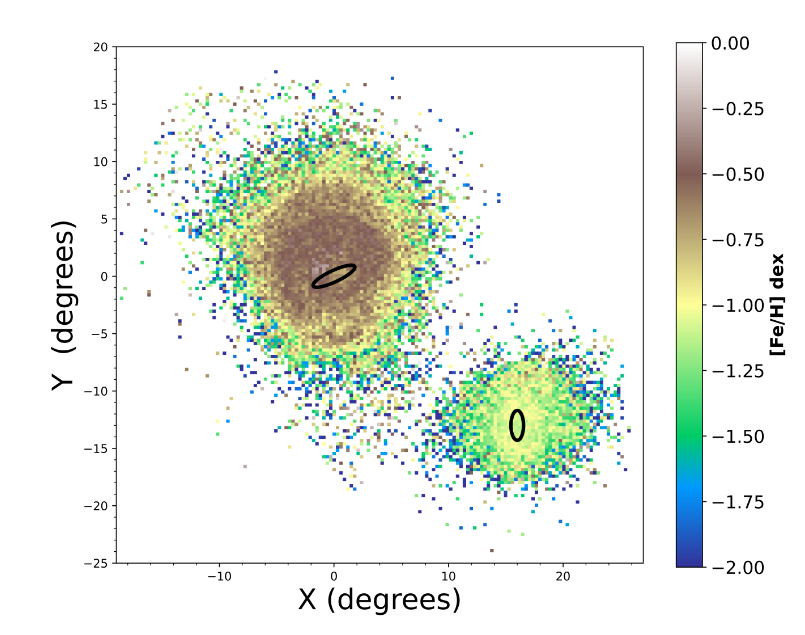
One panel of Figure 4
Omkumar, A. O., et al., A&A 700, A74 (2025)
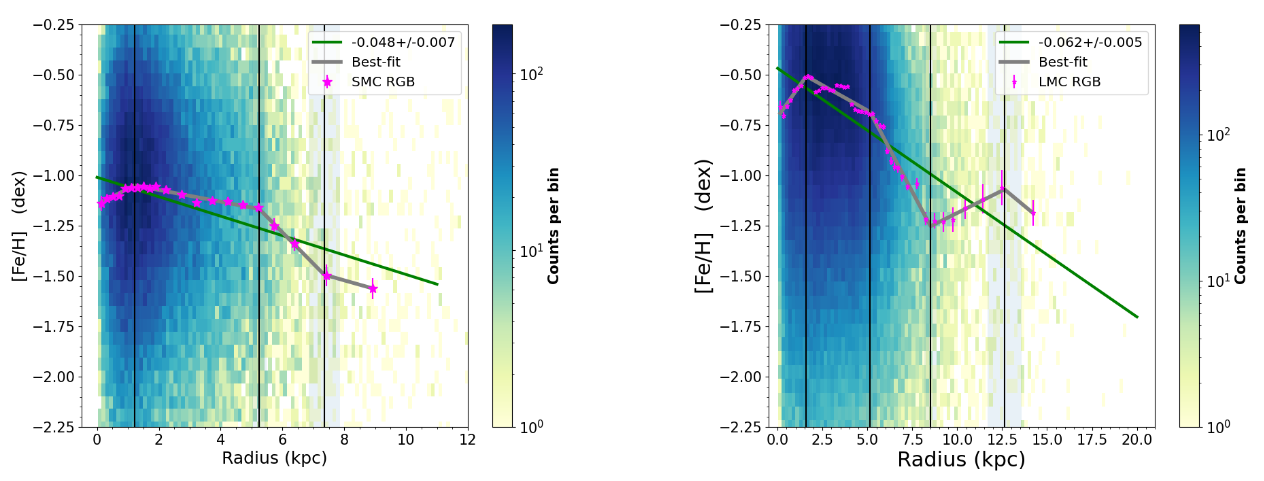
Taken from Figure 6 of
Omkumar, A. O., et al., A&A 700, A74 (2025)
One panel of Figure 3 of
Omkumar, A. O., et al., A&A 700, A74 (2025)
  Q:  Using the median values for metallicity of the LMC (purple) and
         SMC (cyan) in the figure above, compare the fraction of
         heavy elements in stars in each galaxy to that in the Sun.
The two Magellanic Clouds are relatively close to each other in far southern sky. They hover far below the plane of the Milky Way, relatively isolated in space -- if one looks in the optical part of the spectrum.
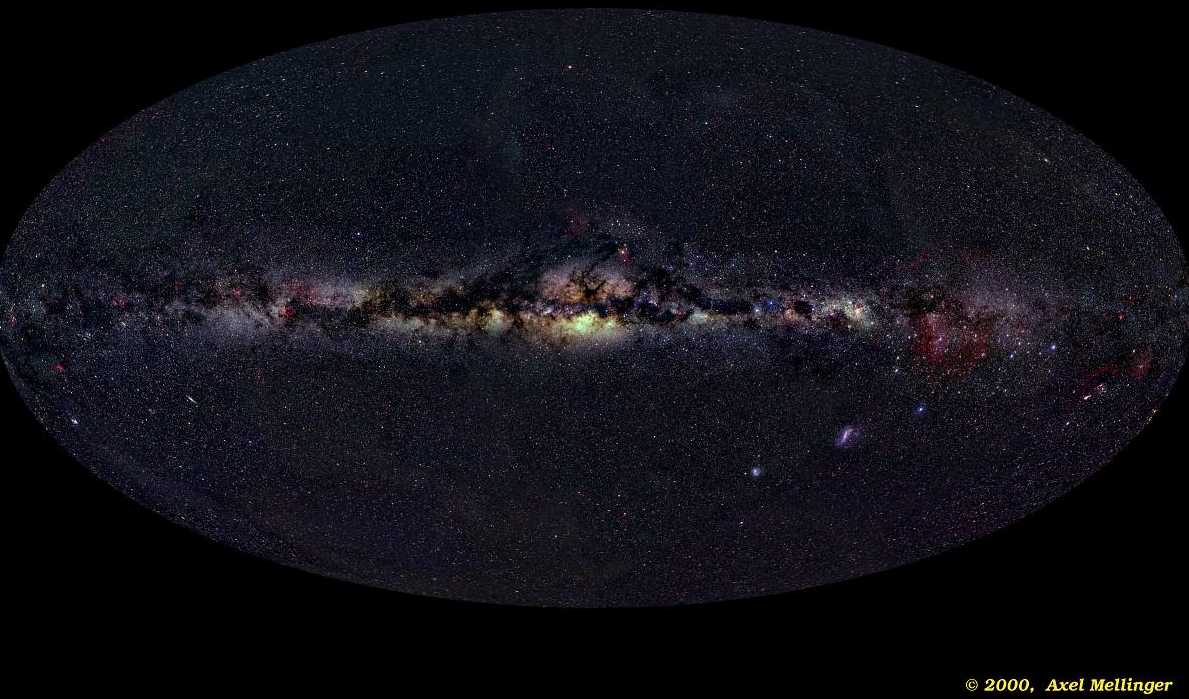
Image courtesy of
Axel Mellinger
However, if one uses a radio telescope to view the sky, then these two small galaxies are joined by a thin ribbon of radio-emitting gas; a much longer string stretches across the sky behind them.
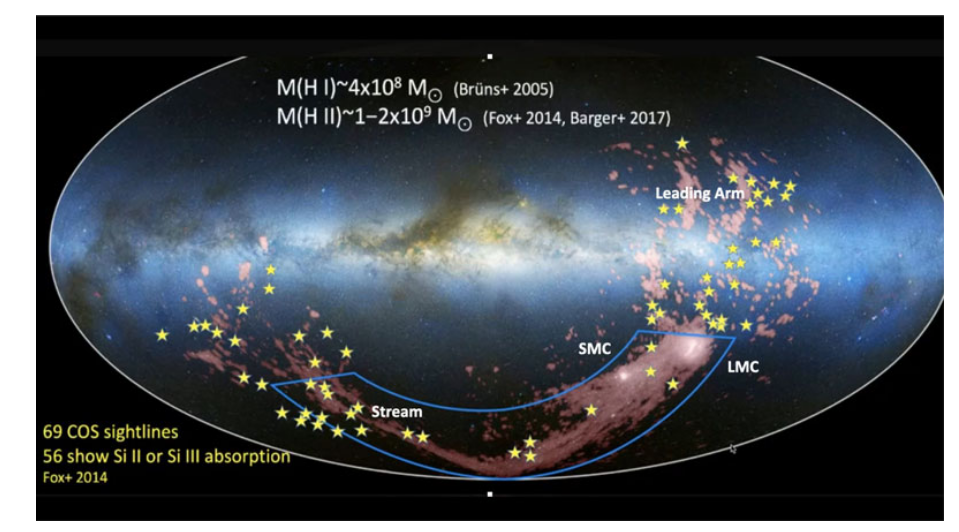
Figure 1 taken from
D'Onghia, E., Dynamical Masses of Local Group Galaxies. Proceedings of the International Astronomical Union; P. Bonifacio et al., editors., Volume 379, pp. 241-248 (2025)
This Magellanic Stream is composed of gas (and dust and stars) which have been stripped from the two clouds due to the gravitational influence of each other and the Milky Way. The figure below shows HI emission from this gas in a coordinate system which has been warped to follow the path of the stream.
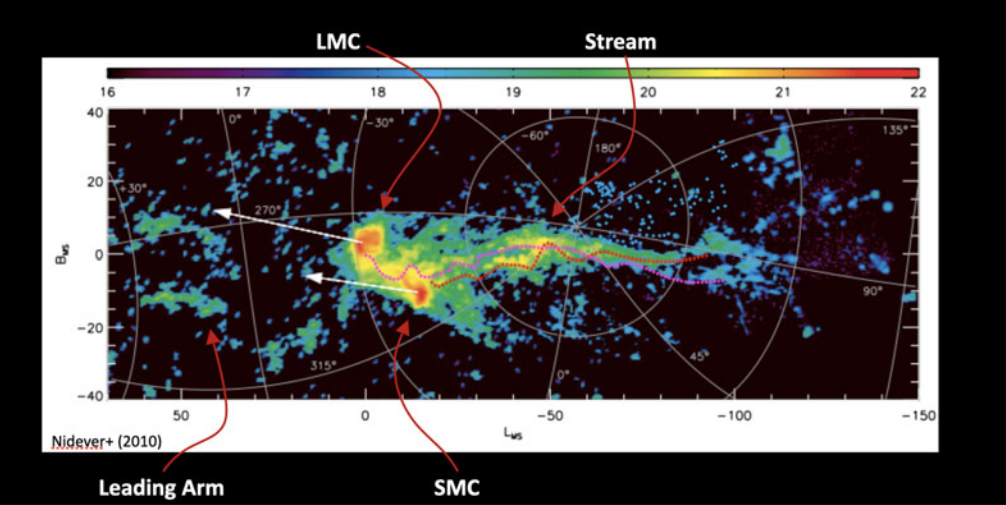
Figure 2 taken from
D'Onghia, E., Dynamical Masses of Local Group Galaxies. Proceedings of the International Astronomical Union; P. Bonifacio et al., editors., Volume 379, pp. 241-248 (2025)
Well, that's a good story, at least. Is it true? Can we really conclude that the stream reveals the path of the clouds through space? The answer is "yes", and there is additional evidence for it.
First, Gaia and other surveys have measured the proper motion of stars in the Magellanic Clouds directly. The average direction of those measurements is shown in the figure above by the white arrows. As one can see, it points in the direction oppposite to the Stream.
Second, a few high-velocity stars (remember them?) appear to have left the LMC a long time ago and, by chance, flown into the Milky Way. If we project their trajectories backward in time, we can find the location of the LMC over the past few hundred million years.
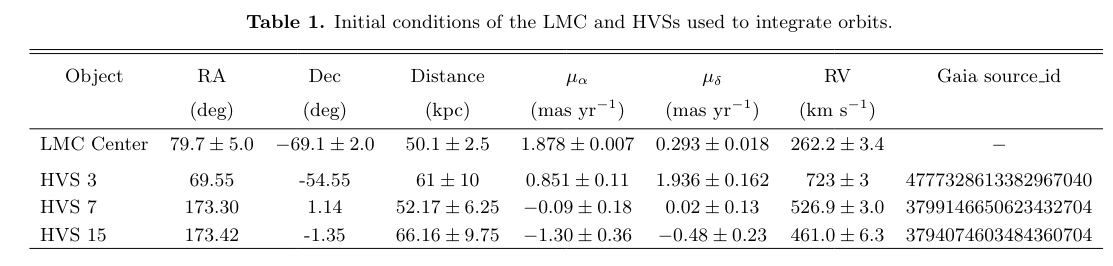
Table 1 taken from
Lucchini, S., and Han, J. J., ApJ 993, 10L (2025)
The red shaded regions in the figure below show the most likely location of the LMC over the past half-billion years.
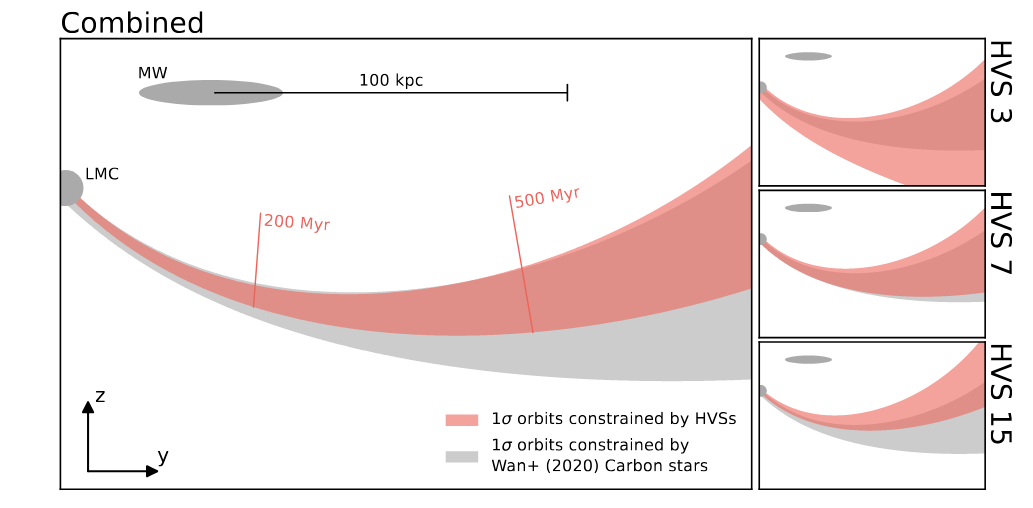
Figure 1 taken from
Lucchini, S., and Han, J. J., ApJ 993, 10L (2025)
Just knowing how the LMC has moved in the recent past is interesting on its own. But even better is using THIS information as a starting point, and using it to go even further back in time. Astronomers can use this data to test much larger numerical simulations of members of the Local Group of galaxies, over much longer periods. We might even be able to figure out if the LMC is making its first close passage of the Milky Way, or if it is coming back for a second visit.
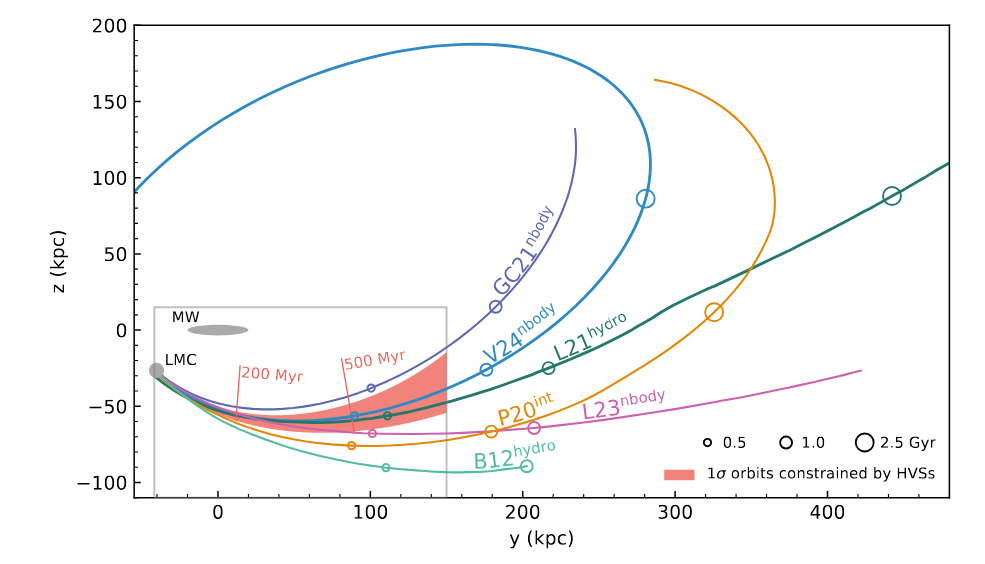
Figure 2 taken from
Lucchini, S., and Han, J. J., ApJ 993, 10L (2025)
Copyright © Michael Richmond.
This work is licensed under a Creative Commons License.