 Copyright © Michael Richmond.
This work is licensed under a Creative Commons License.
Copyright © Michael Richmond.
This work is licensed under a Creative Commons License.
For those who did not recognize
the reference.
Today, we look at an important component of the ISM: the dust which lies within molecular clouds.
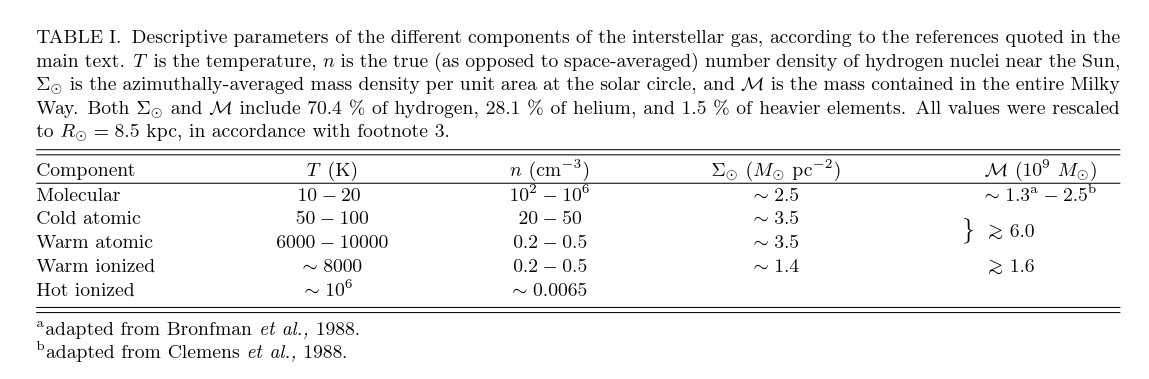
Table 1 taken from
Ferriere, K. M., Reviews of Modern Physics, 73, 1031 (2001)
The fact that we can see very, very, VERY distant objects in the sky suggests that space must be empty; certainly much less full of dust and air and other particles than the Earth's atmosphere. During the nineteenth century, as photographic technology improved, some astronomers noticed what appeared to be dark clouds of obscuring matter in some locations.
For example, E. E. Barnard's mammoth collection of photographs, A Photographic Atlas of Selected Regions of the Milky Way, showed many areas like this:
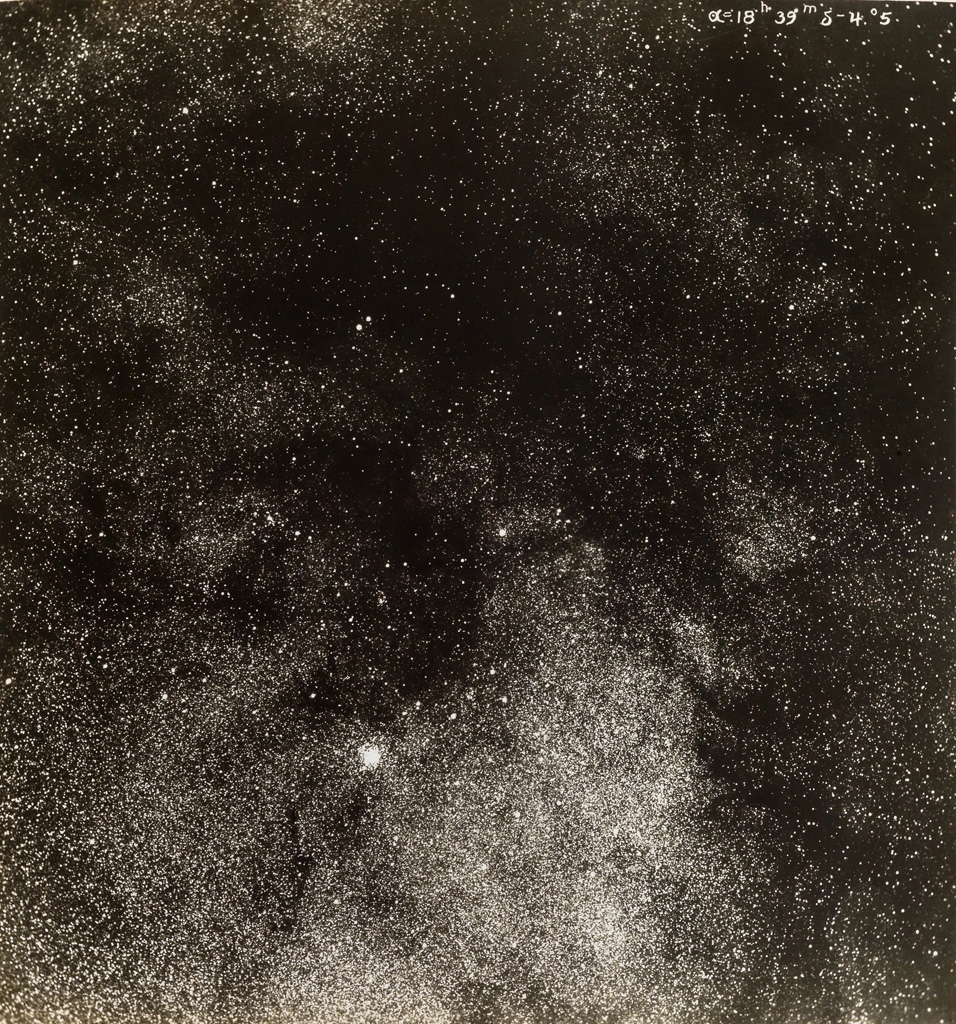
Copy of one of the plates from
A Photographic Atlas of Selected Regions of the Milky Way,
Barnard, E. E., (1927)
Barnard wrote a number of papers arguing that while some of these "dark regions" might simply be areas with few stars, many had to be caused by clouds of dust.
While some astronomers agreed with Barnard, others claimed that these were weak arguments; how could one distinguish between a simple lack of stars and the presence of dust or other material?
Robert Trumpler provided the definitive data in 1930. He studied a large sample of open clusters, dividing them into groups by "richness" (the density of stars within particular angular radii, which would not be strongly affected by any intervening material). He assumed that the clusters in each group ought to have roughly similar properties: size, luminosity, mass, etc. He then estimated the RELATIVE distances to the members of each group using two different criteria:
              BRIGHTNESS                     ANGULAR SIZE
  --------------------------------------------------------------------

      - bright clusters close             - big clusters close

      - faint clusters far away           - small clusters far away

  --------------------------------------------------------------------
Now, in an ideal universe, both methods would yield the same result: a very distant cluster should look both smaller, and fainter, than nearby examples of its group. Moreover, the relative distances measured by each method should agree.
But when Trumpler compared the distances calculated by these two methods, he found a significant difference:
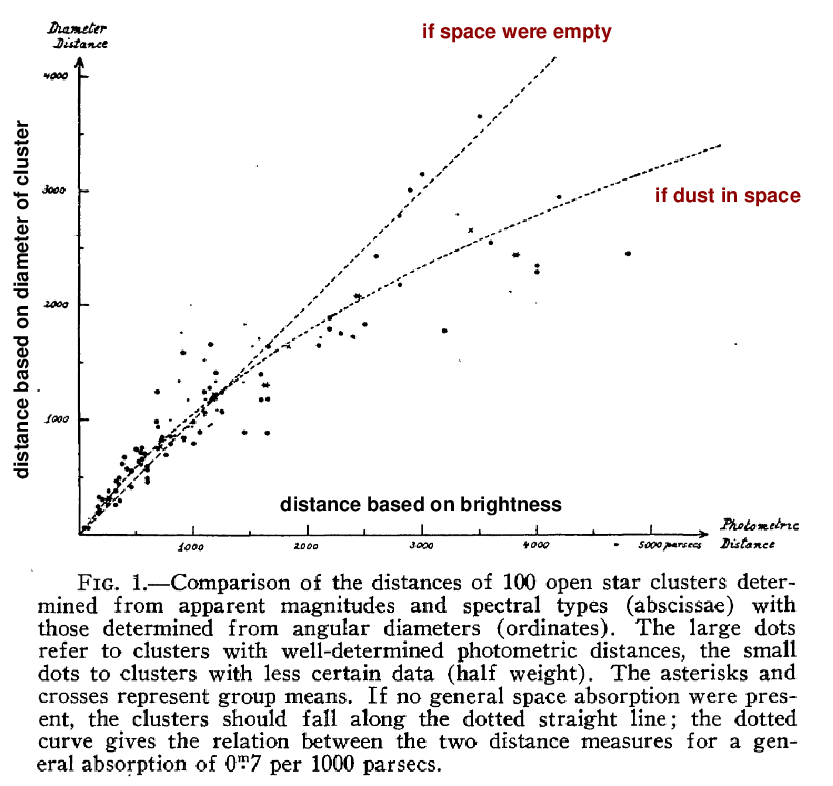
Figure 1 taken from
Trumpler, R. J., PASP 42, 214 (1930)
In a second paper, he showed that, not only did clusters become faint more quickly than expected, but the dimming was more pronounced at short wavelengths. In other words, more blue light was scattered or absorbed, and, as a result, stars appeared to be redder than they ought to be.
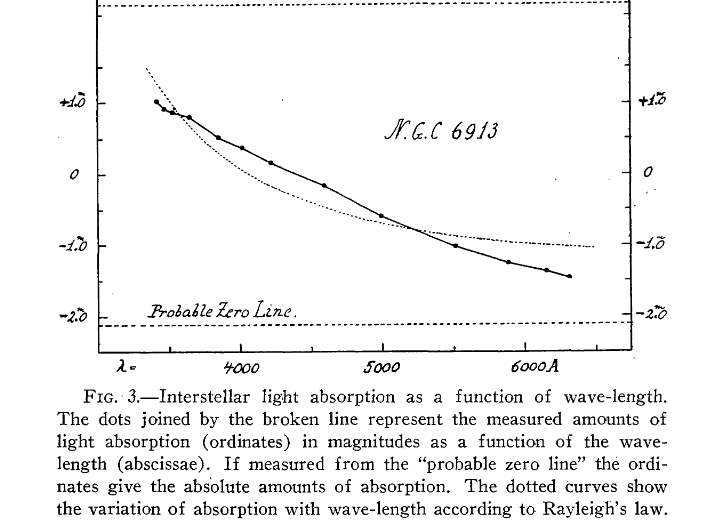
Figure 3 taken from
Trumpler, R. J., PASP 42, 267 (1930)
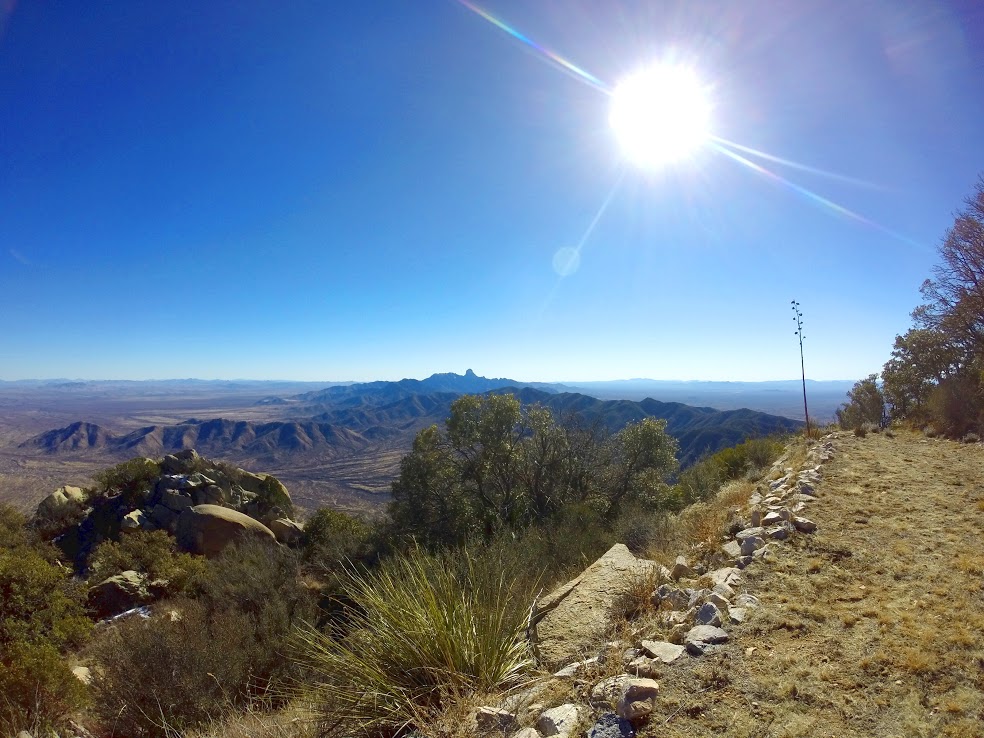
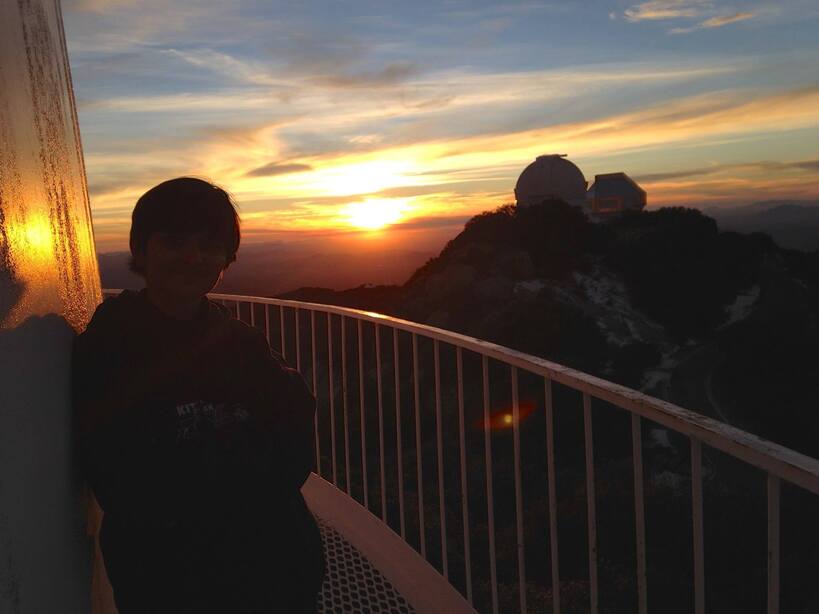
  Q:  Can you think of any common phenomenon, viewed by billions of people
          each day, in which a source of light is made both DIMMER
          and REDDER as it passes behind collections of tiny particles?
Perhaps these two pictures will help.
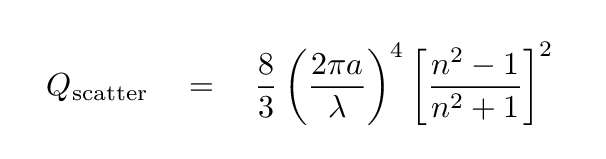
Yes, indeed: particles of dust or other material which are small compared to the wavelength of light will SCATTER photons more strongly at short wavelengths. Rayleigh scattering by grains of radius a and index of refraction n will scatter light with an efficiency that depends on the fourth power of the wavelength:
One consequence of this relationship between wavelength and scattering efficiency is that long-wavelength light can penetrate farther through dusty clouds than short-wavelength light. So, if one wishes to see through a cloud, one should view in the infrared:
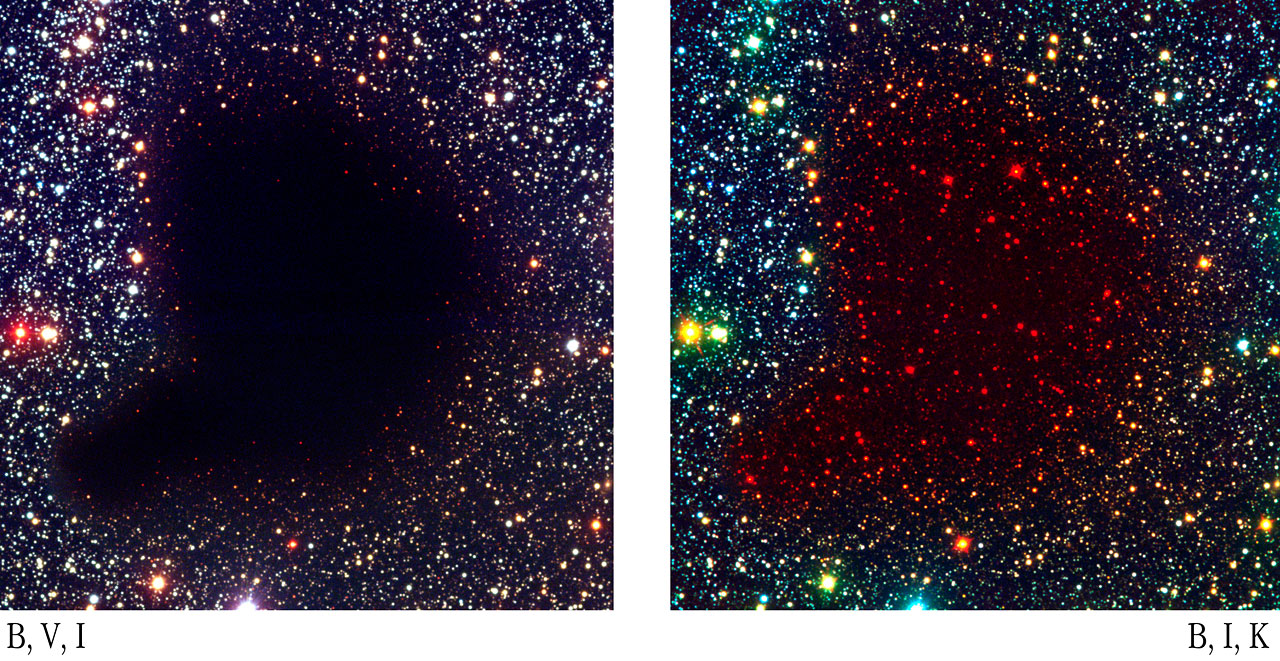
Images courtesy of
ESO
Another piece of evidence for the presence of dust grains inside some interstellar clouds gives us some tips on the chemical composition of the dust. The fancy name for this phenomenon is depletion.
To explain this concept, let's go back to the abundances of different chemical elements in the ISM. Over the last century or so, astronomers have measured the abundances in many different locations and determined the typical values for different elements. Hydrogen is by far the most common, helium next, and just tiny little bits of all the heavier elements. The right-most column table below shows the number of atoms of each element in the interstellar medium, relative to one million hydrogens.
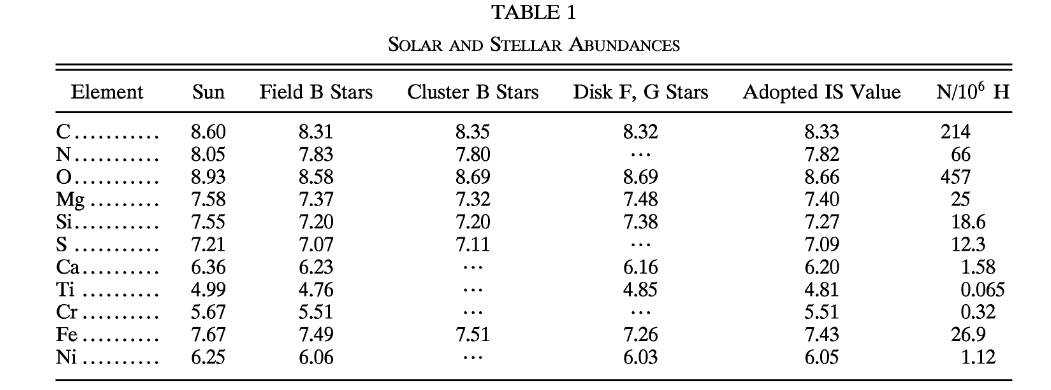
Table 1 from
Snow, T. P., and Witt, A. N., ApJ 468, 65 (1996)
  Write down the number of carbon, oxygen, and silicon atoms
     present in ordinary regions of the ISM.
Now, consider the region near the bright star zeta Oph. An ordinary photograph in visible light shows beautiful emission nebulae and hints of dark clouds. Zeta is the bright star at the center of the reddish HII region near the top.
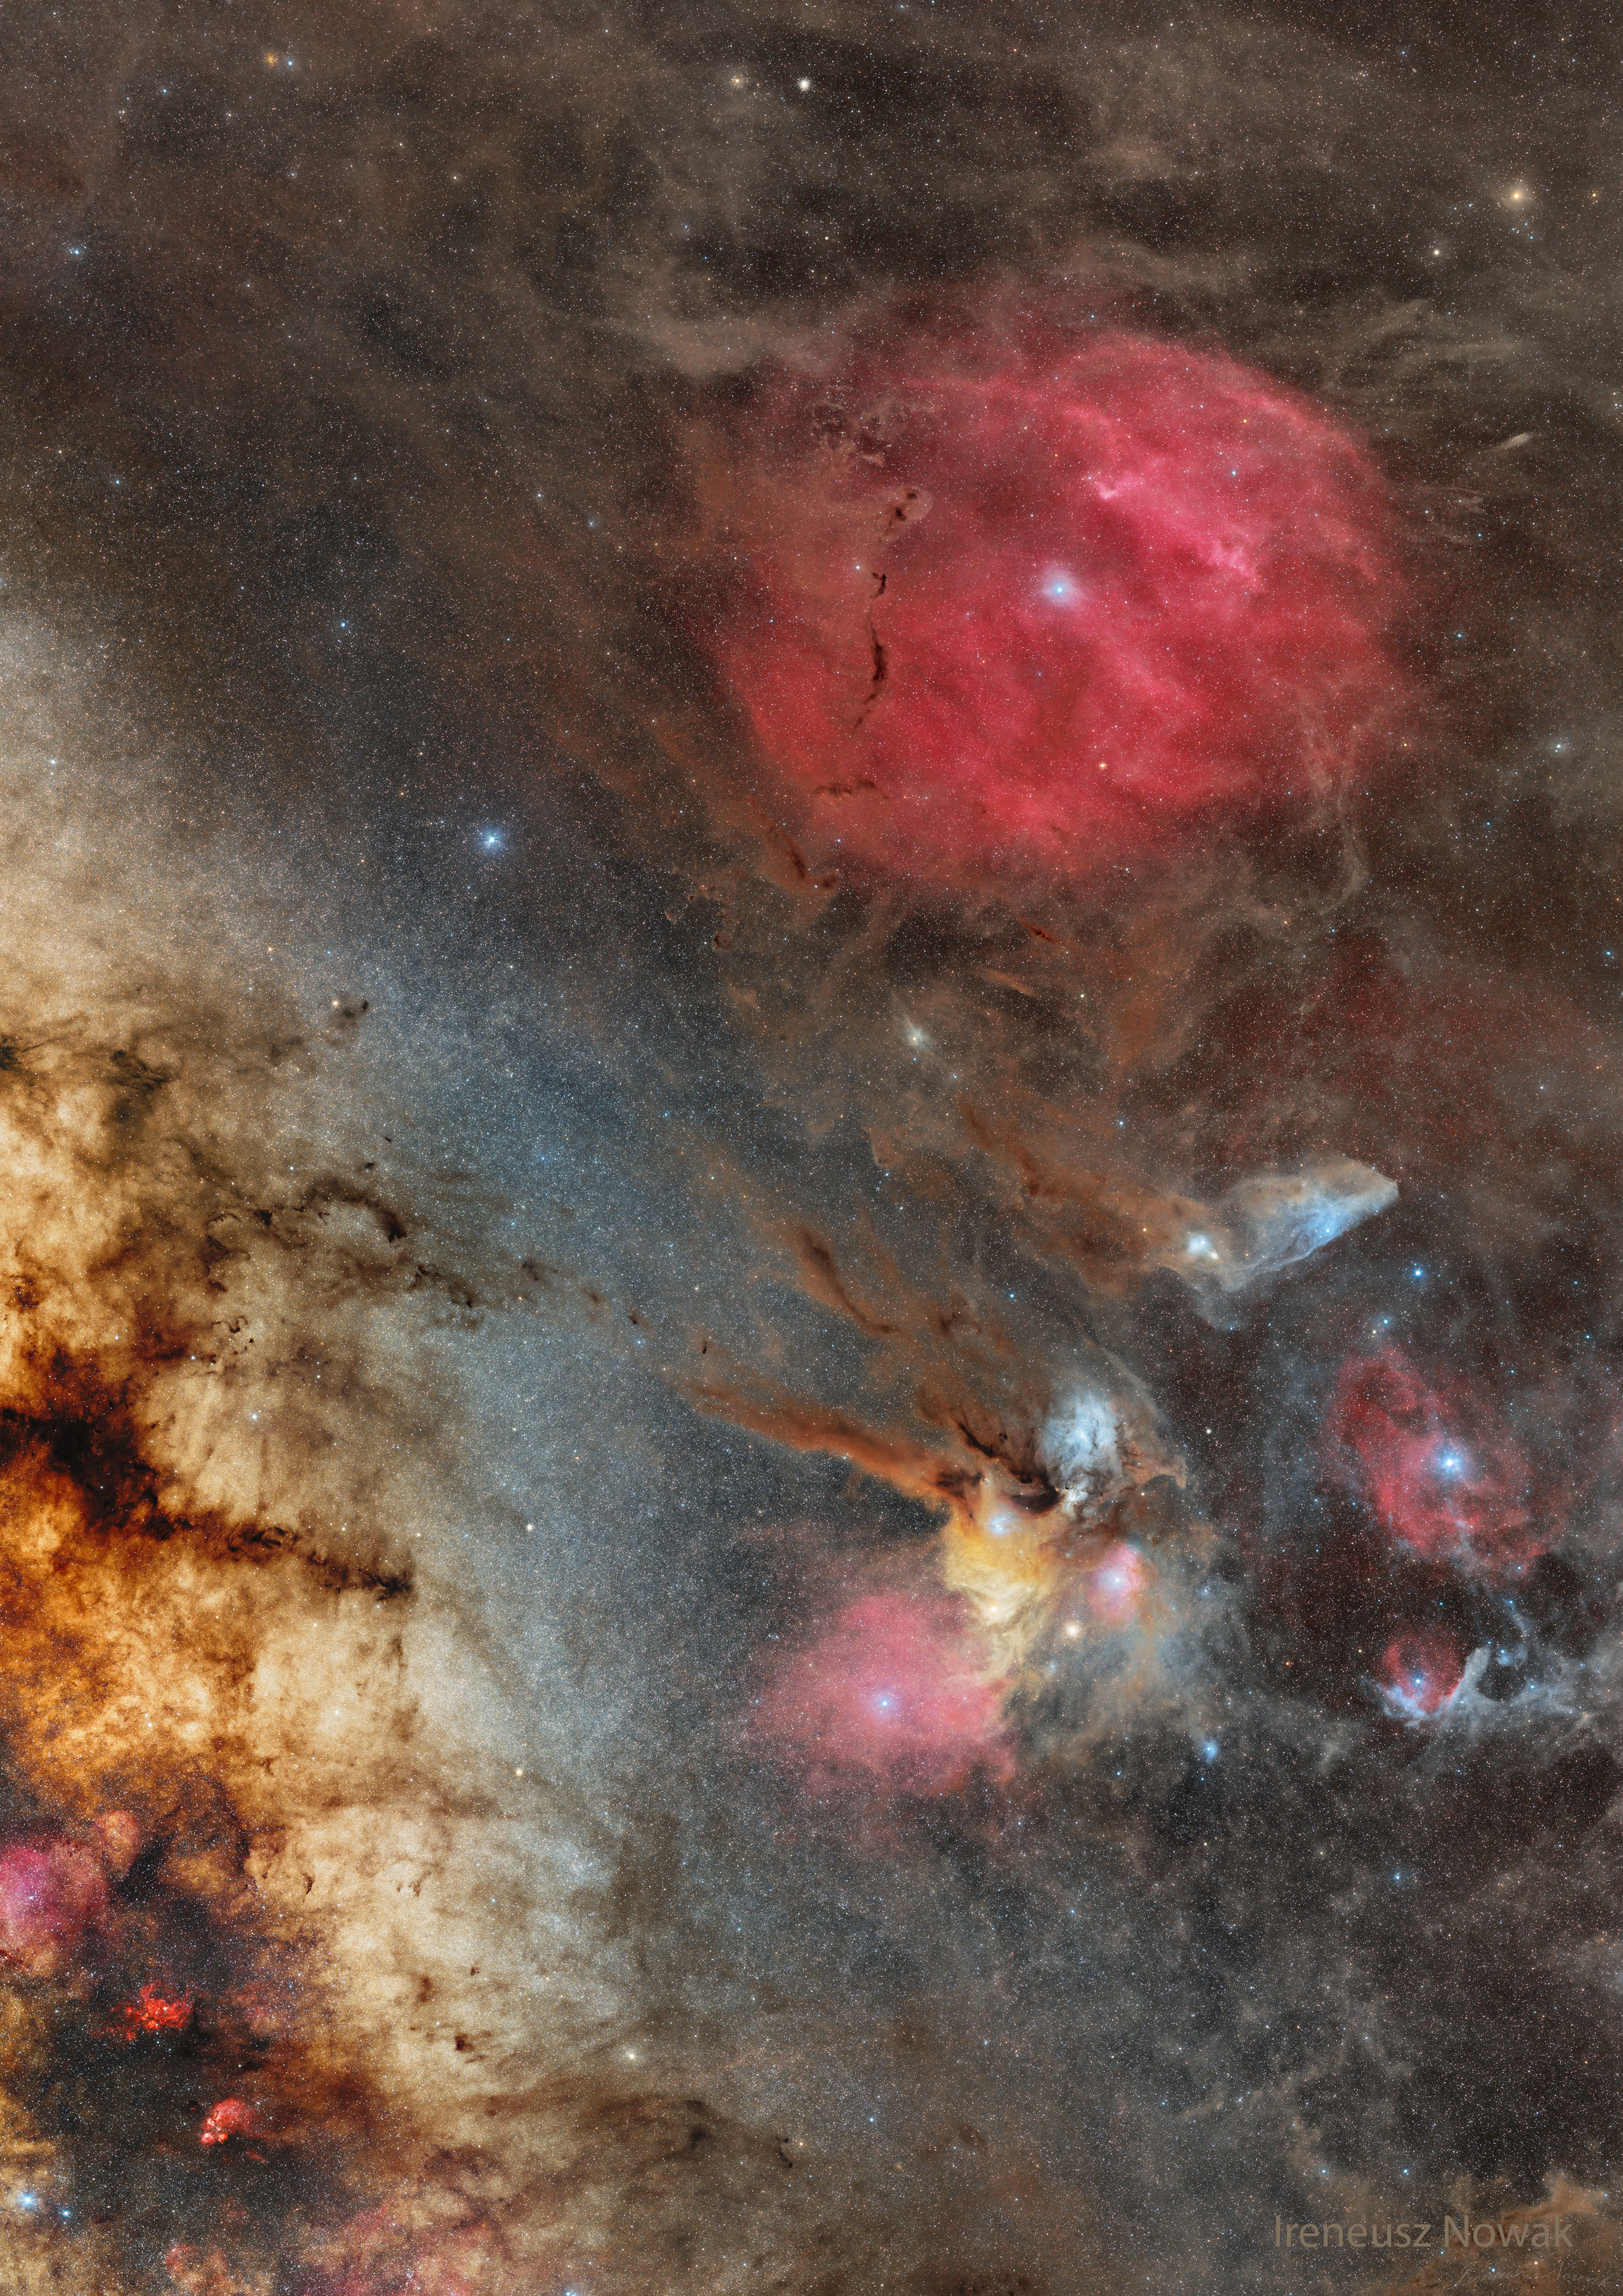
Image of Milky Way, rho and zeta Ophiuchi courtesy of
NASA's Astronomy Picture of the Day7
and
Ireneusz Nowak
If we zoom in a bit and move to the mid-infrared, we can see emission from dust in the clouds surrounding the star.
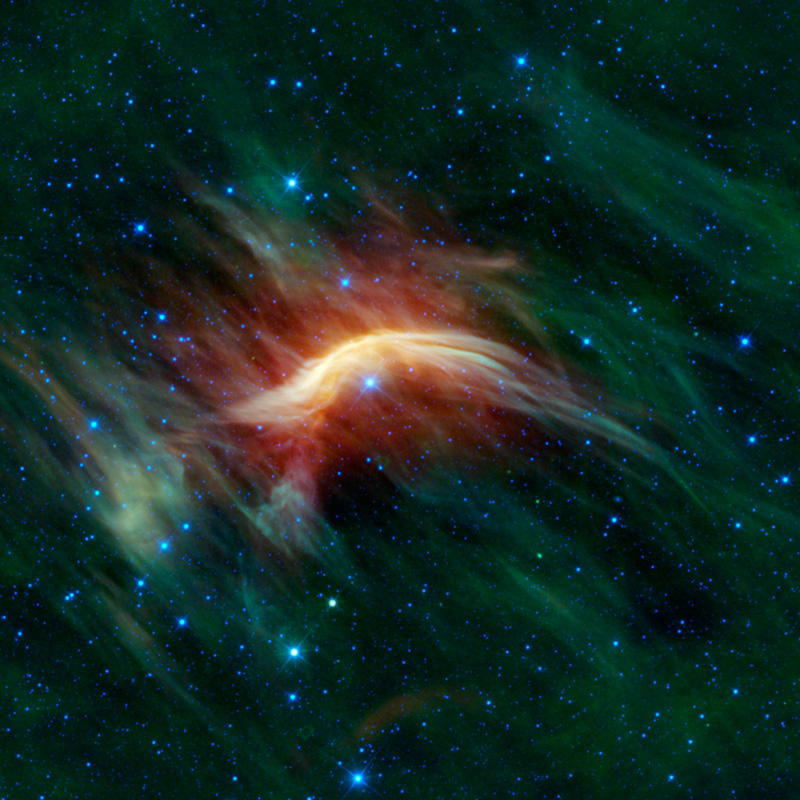
WISE infrared image of Zeta Oph courtesy of
NASA/JPL-Caltech/WISE Team
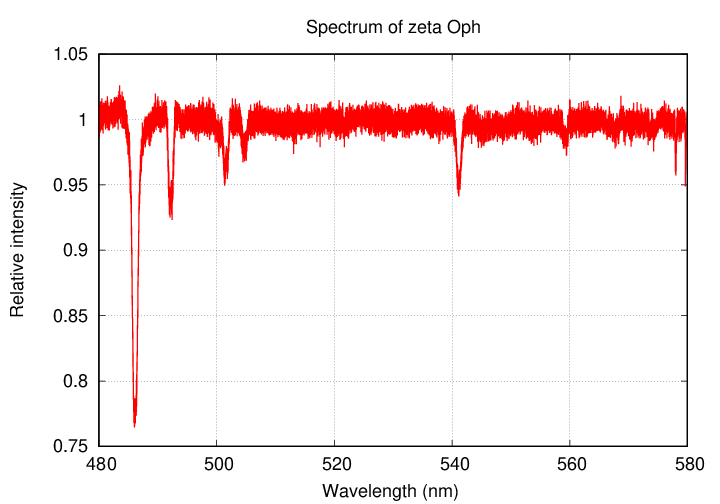
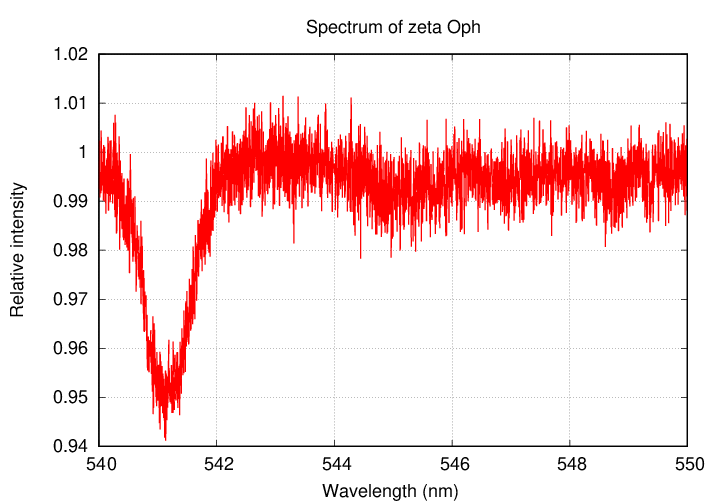
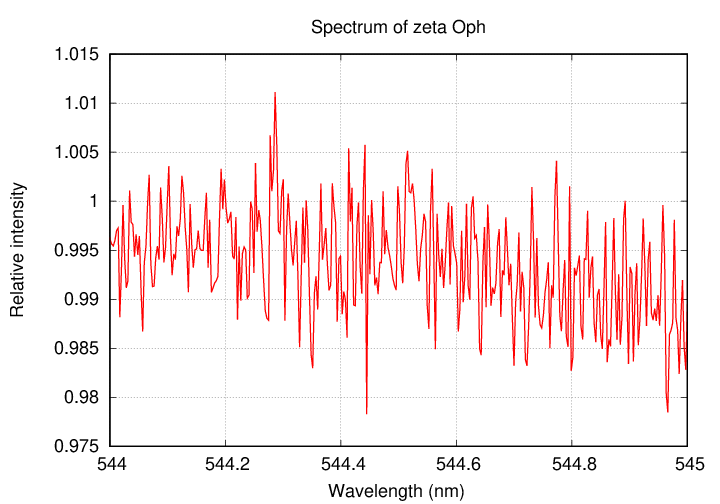
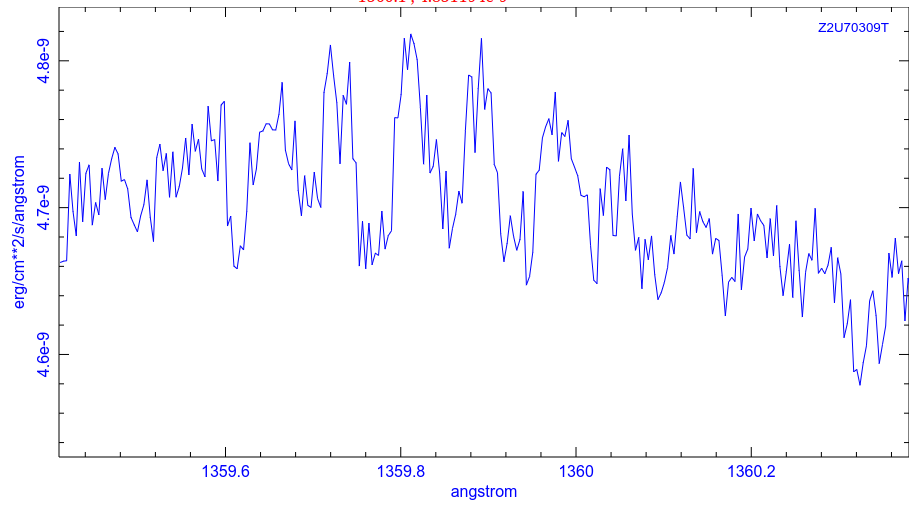
Astronomers have spent quite a bit of time studying the light from zeta Oph. They have acquired spectra of the starlight across a very wide range of wavelengths, from the ultraviolet, through the optical, into the near-infrared. Because the star is so bright (roughly second magnitude in the optical), one can break the light up into very high spectral resolution, allowing one to measure the absorption lines of many elements with high precision.
Here's a sequence of spectra in the optical (thanks to the Melchiors library of high resolution stellar spectra)
... and here's a pair from the ultraviolet (courtesy of the Hubble Legacy Archive)
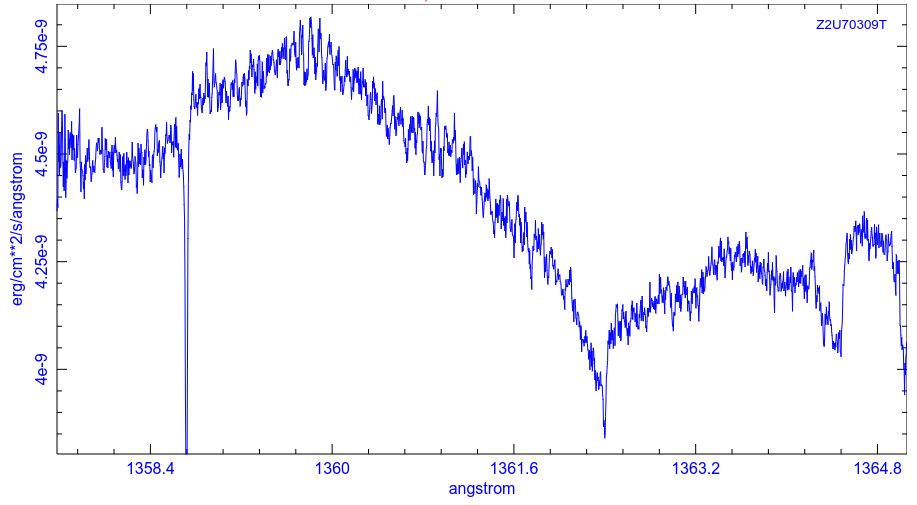
Although some of these lines are created by material in the outer atmosphere of zeta Oph, others are caused by atoms in the space between us and the star. In 1996, Snow and Witt (ApJ 468, 65) noticed that SOME of these interstellar absorption lines were less deep than expected; in other words, the atoms of SOME chemical elements were less common in the interstellar gas than they should have been. The final column in this table lists the number of atoms of each element which were "missing" from the gas in space.
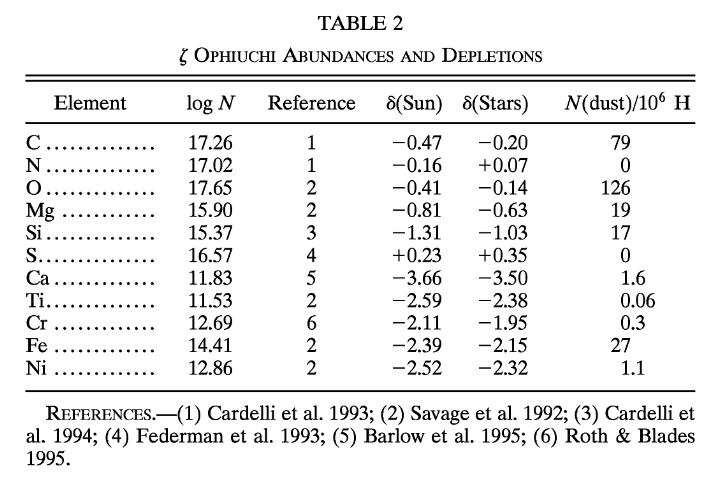
Table 2 from
Snow, T. P., and Witt, A. N., ApJ 468, 65 (1996)
  Q:  What fraction of the carbon atoms are "missing" from the gas?
      What fraction of the oxygen atoms are "missing" from the gas?
      What fraction of the silicon atoms are "missing" from the gas?


  Q:  Where did those atoms go?
In order to calculate the temperature of a non-stellar object in space -- one which doesn't generate its own energy internally, in other words -- we usually the following technique:
Let's walk through the procedure to see how it works. We'll use a generic planet around the Sun as our subject.
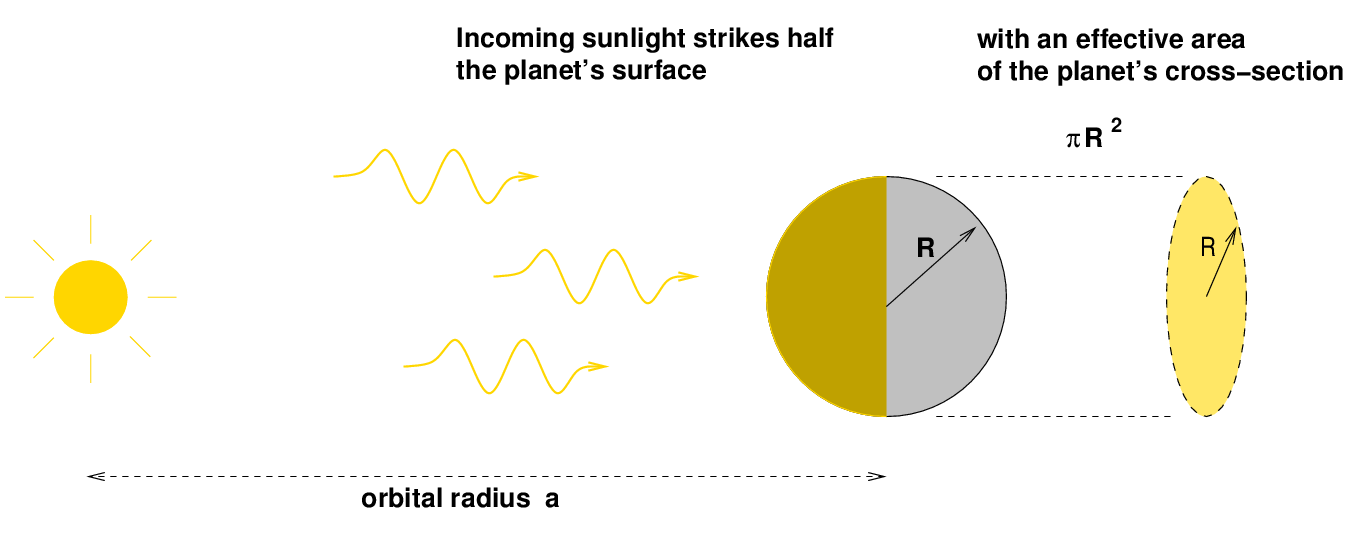
If the luminosity of the Sun is L*, then we can compute both the flux of energy from the Sun at the planet's distance, and the amount of that energy which strikes the planet.
We can derive the amount of incoming energy striking the planet each second:
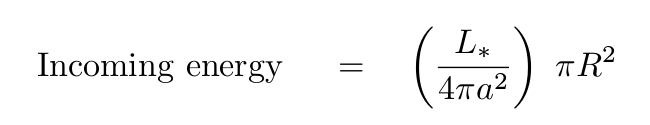
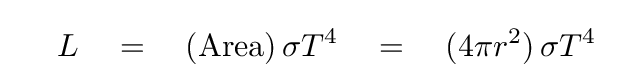
Now, if we simplify a LOT and assume that the entire planet has exactly the same temperature, and ignore the emissivity of its surface, we can figure out the amount of energy that it radiates away into space each second due to thermal radiation:
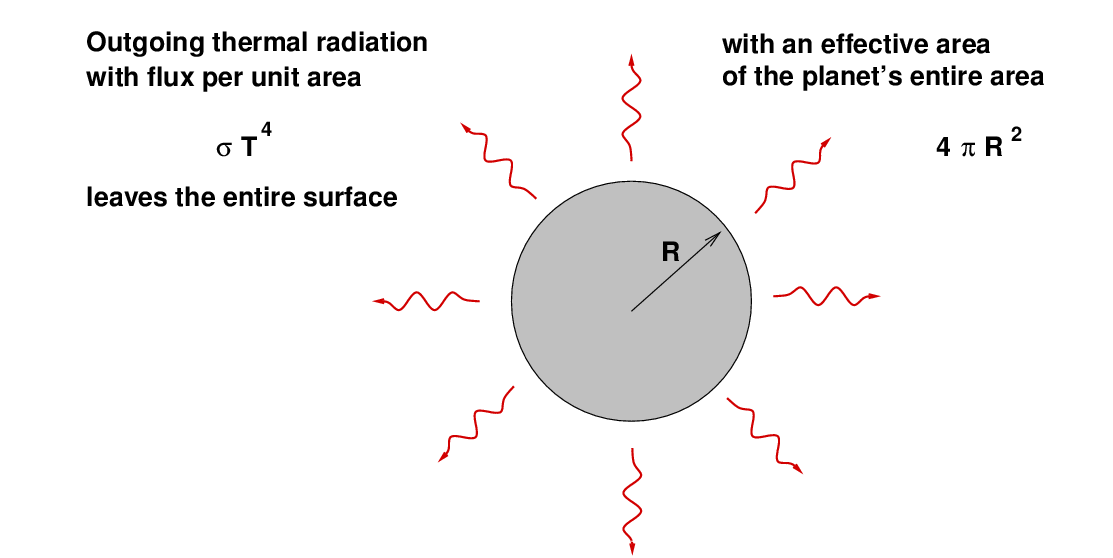
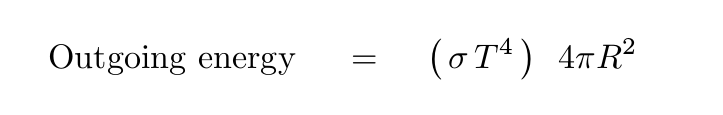
When the incoming and outgoing fluxes of energy are equal, the planet will reach a steady, equilibrium temperature.
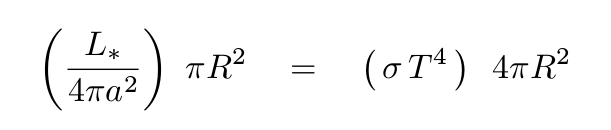
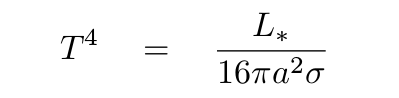
Q: Can you solve for the equilibrium temperature T?
Right.
Does this equation actually work? Let's try to apply it to the Earth:
  Q:  What does this method predict for the temperature of the Earth?

  Q:  What is the actual temperature of the Earth?
Okay, let's get back to dust grains. For large grains -- those of a millimeter or more in diameter -- this basic method works pretty well. We can now add a couple of factors to each side of the energy equation to account for the efficiency with which photons are absorbed ("albedo") or emitted ("emissivity").

For ordinary rocks or pebbles, both the albedo and emissivity terms are numbers in a relatively small range between about 0.1 and 0.9. That's no big change from our earlier calculation.
But for small dust grains, these two terms can be very much smaller -- which can make quite a difference in the equilibrium temperature. For one thing, the efficiency factors depend on the SIZE of the grain, a, and on its chemical makeup. Let's consider a grain made primarily of graphite or other carbon-rich materials. In this case, the "heating" side of the equation looks like this:

Here, the equivalent of "F = flux striking the planet" is typically written as the combination of ε and c, where
and the albedo-ish term (efficiency of absorbing light) is
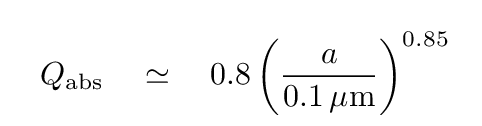
  Q:  For a grain of radius a = 0.1 μm, is this absorbing efficiency factor
        similar to the (1 - albedo) of everyday objects -- between 0.1 and 0.9?
Yup, sure looks like it. Nothing too strange here.
The other side of the energy-balance equation, describing energy radiated away by the dust grain, looks like

where the "emissivity" term for graphite grains depends not only on their size, but also on their temperature, like so:
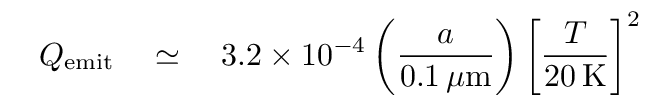
  Q:  For a grain of radius a = 0.1 μm, is this radiative efficiency factor
         similar to the emissivity of everyday objects -- between 0.1 and 0.9?
Nope. It appears that dust grains have a harder time emitting energy than ordinary macroscopic objects. Hmmm. I wonder if that difference will have any effect on their equilibrium temperature relative to the temperature of ordinary rocks in space?
Now, in the ISM, a typical value for the energy density of starlight is around ε = 10-13 Joules/m3. If we insert that value into the "heating" side, and then set the energy gains and losses equal, we find
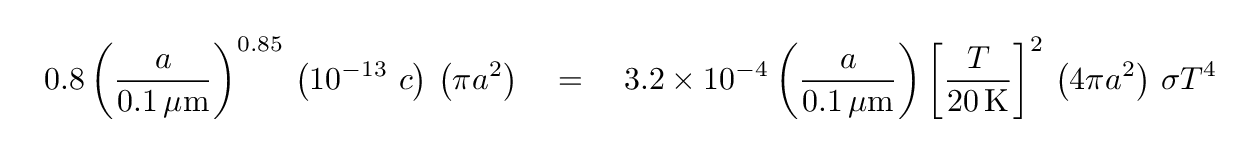
  Q:  Can you solve for the equilibrium temperature of a grain
         with size a = 0.1 micron?
This temperature for a small grain is significantly higher than that for macroscopic objects under the same conditions, due to the very low radiative efficiency of tiny grains.
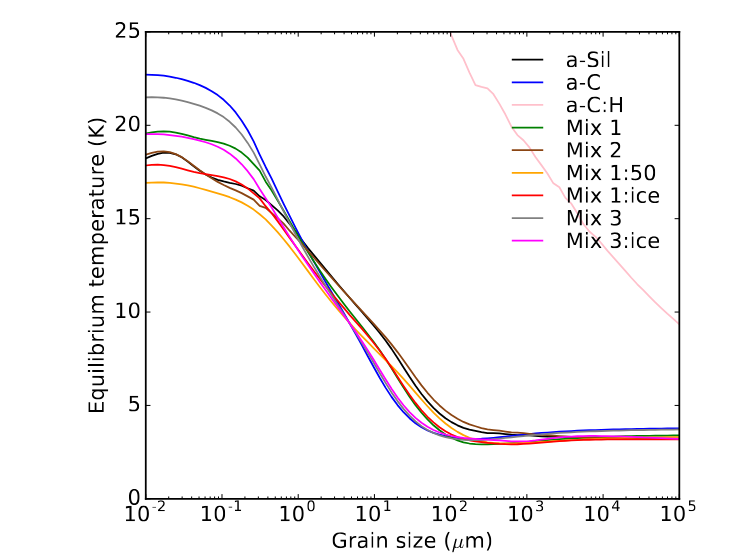
Figure 3 taken from
Ysard, N., et al., A&A 631, 88 (2019)
As you may recall, we've seen that dust grains can play an important part in dense clouds: they serve as catalysts for the formation of molecular gas. Now we know that they can reach temperatures of 20 K or so in "ordinary" regions of space; if they happen to float close to a region of star formation, they may be heated to considerably higher temperatures.
Is there any consequence to the presence of these warm-ish grains of dust?
YES!
What's so special about dust? The fact that grains are small means that they have a considerably larger surface area, relative to their mass, than rocks or asteroids or planets. That increased surface area means that the grains may be very efficient at turning thermal energy into radiation.
Let's take a bunch of matter -- iron, oxygen, hydrogen, etc. -- and form it into two piles of equal mass and equal density. Each will have 1 Earth mass = 5.98 x 1024 kg and density = 5510 kg/cubic meter.
  Q:  How many big particles are there?

  Q:  How many small particles are there?
Now, suppose we set all the particles, big and small, to the same temperature. Let's pick T = 270 Kelvin, which is roughly the temperature of the real Earth. The particles will all emit blackbody radiation, with a total luminosity of
  Q:  What is the luminosity of the single big sphere?

  Q:  What is the luminosity of the many little spheres?
The moral of the story is that, due to their very large surface area, dust particles can produce LOTS of infrared!
Just how far into the infrared will dust emit most of its energy? Fill in this table.
     Temperature (K)            peak of blackbody emission (microns)
-----------------------------------------------------------------------
         300

         100

          50

          20

           3
-----------------------------------------------------------------------
In galaxies with little gas and dust (NGC 5018, green line and middle panel), most of the energy is simply starlight, emitted in the optical and near-infrared. But if the interstellar medium in a galaxy is filled with clouds of molecular gas (M82, red line and right panel), and heated by clusters of young stars which have just formed from that gas, then the majority of the entire galaxy's energy may appear in the far-infrared. In essence, the energy created by stars is captured by dust, processed, and re-radiated at much longer wavelengths.
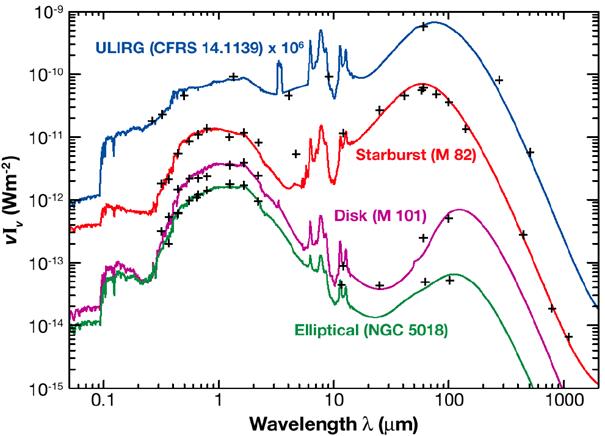
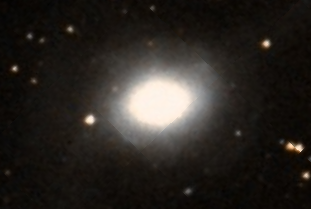
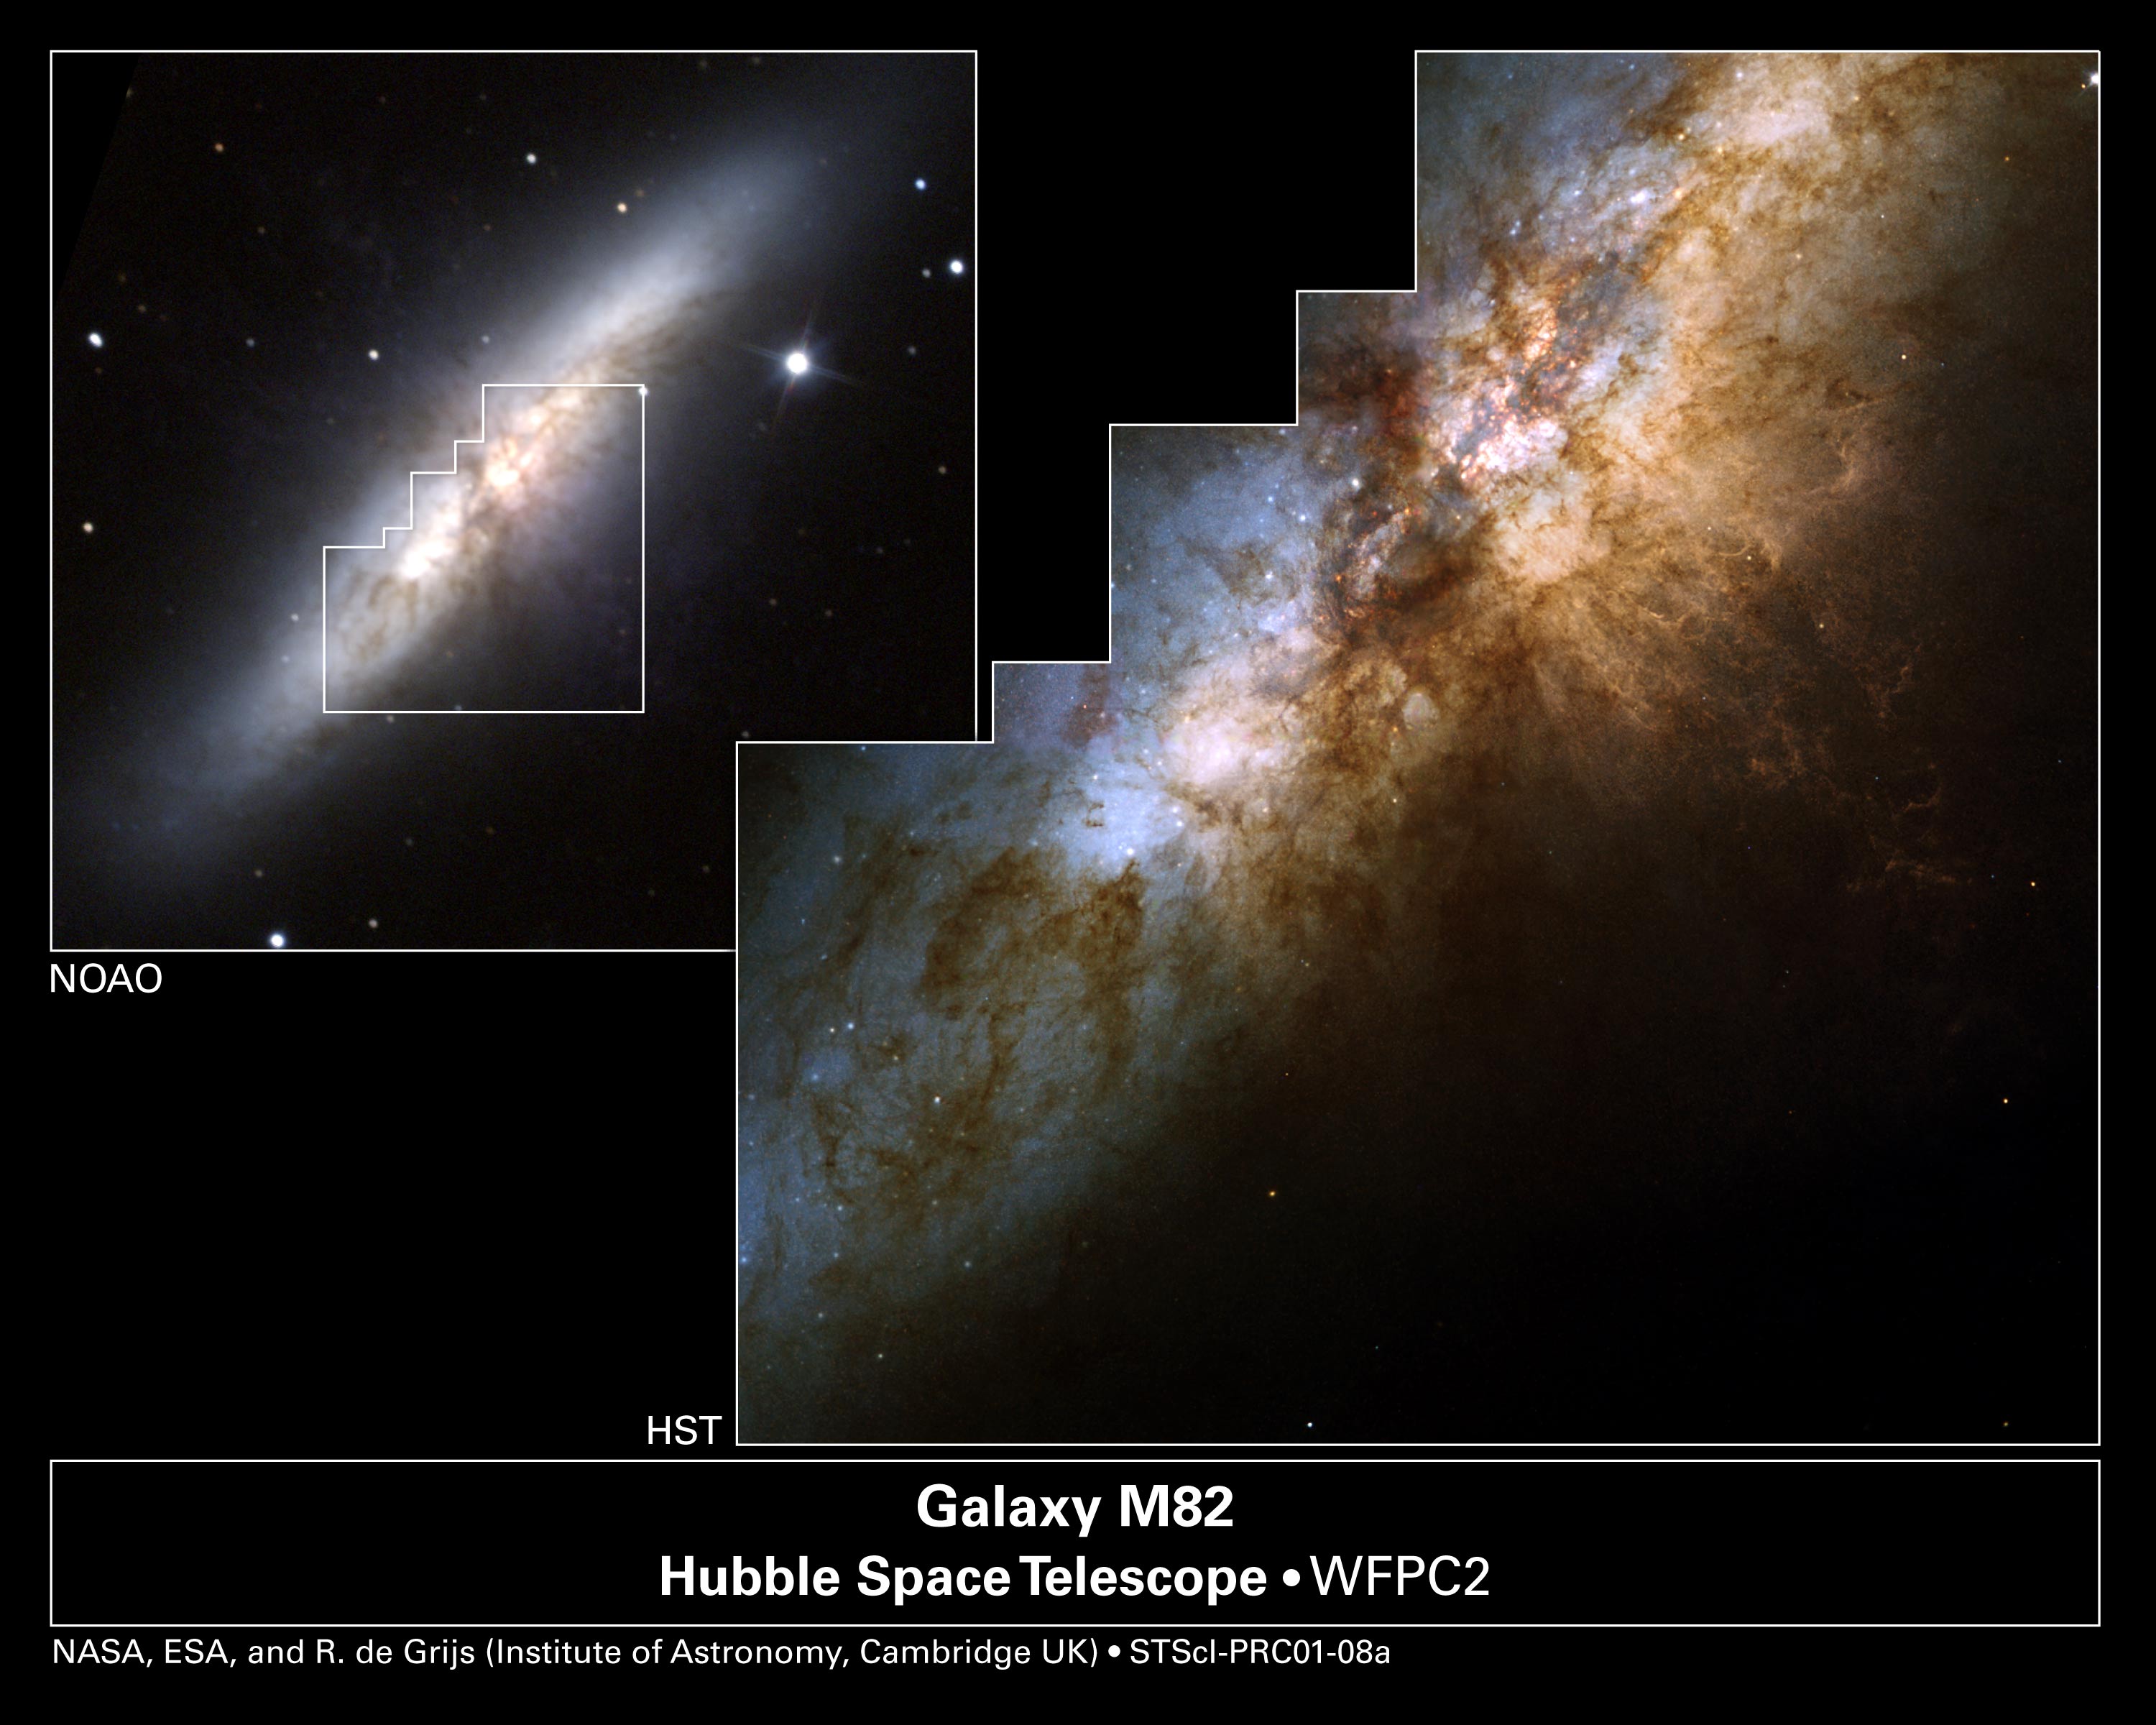
Image 10.6 taken from
Infrared Astronomy,
ed. L. V. Toth, S. Zahorecz, and C. Kiss,
Eotvos Lorand University (2013)
Image of NGC 5018 from the Digitized Sky Survey
Image of M82 courtesy of
NASA, ESA, R. de Grijs (Institute of Astronomy, Cambridge, UK); N.A. Sharp (Association of Universities for Research in Astronomy, National Optical Astronomy Observatories, National Science Foundation)
NASA has created a very nice set of matched images, showing the Milky Way at a wide range of wavelengths. Click on the image below for a high-resolution version.
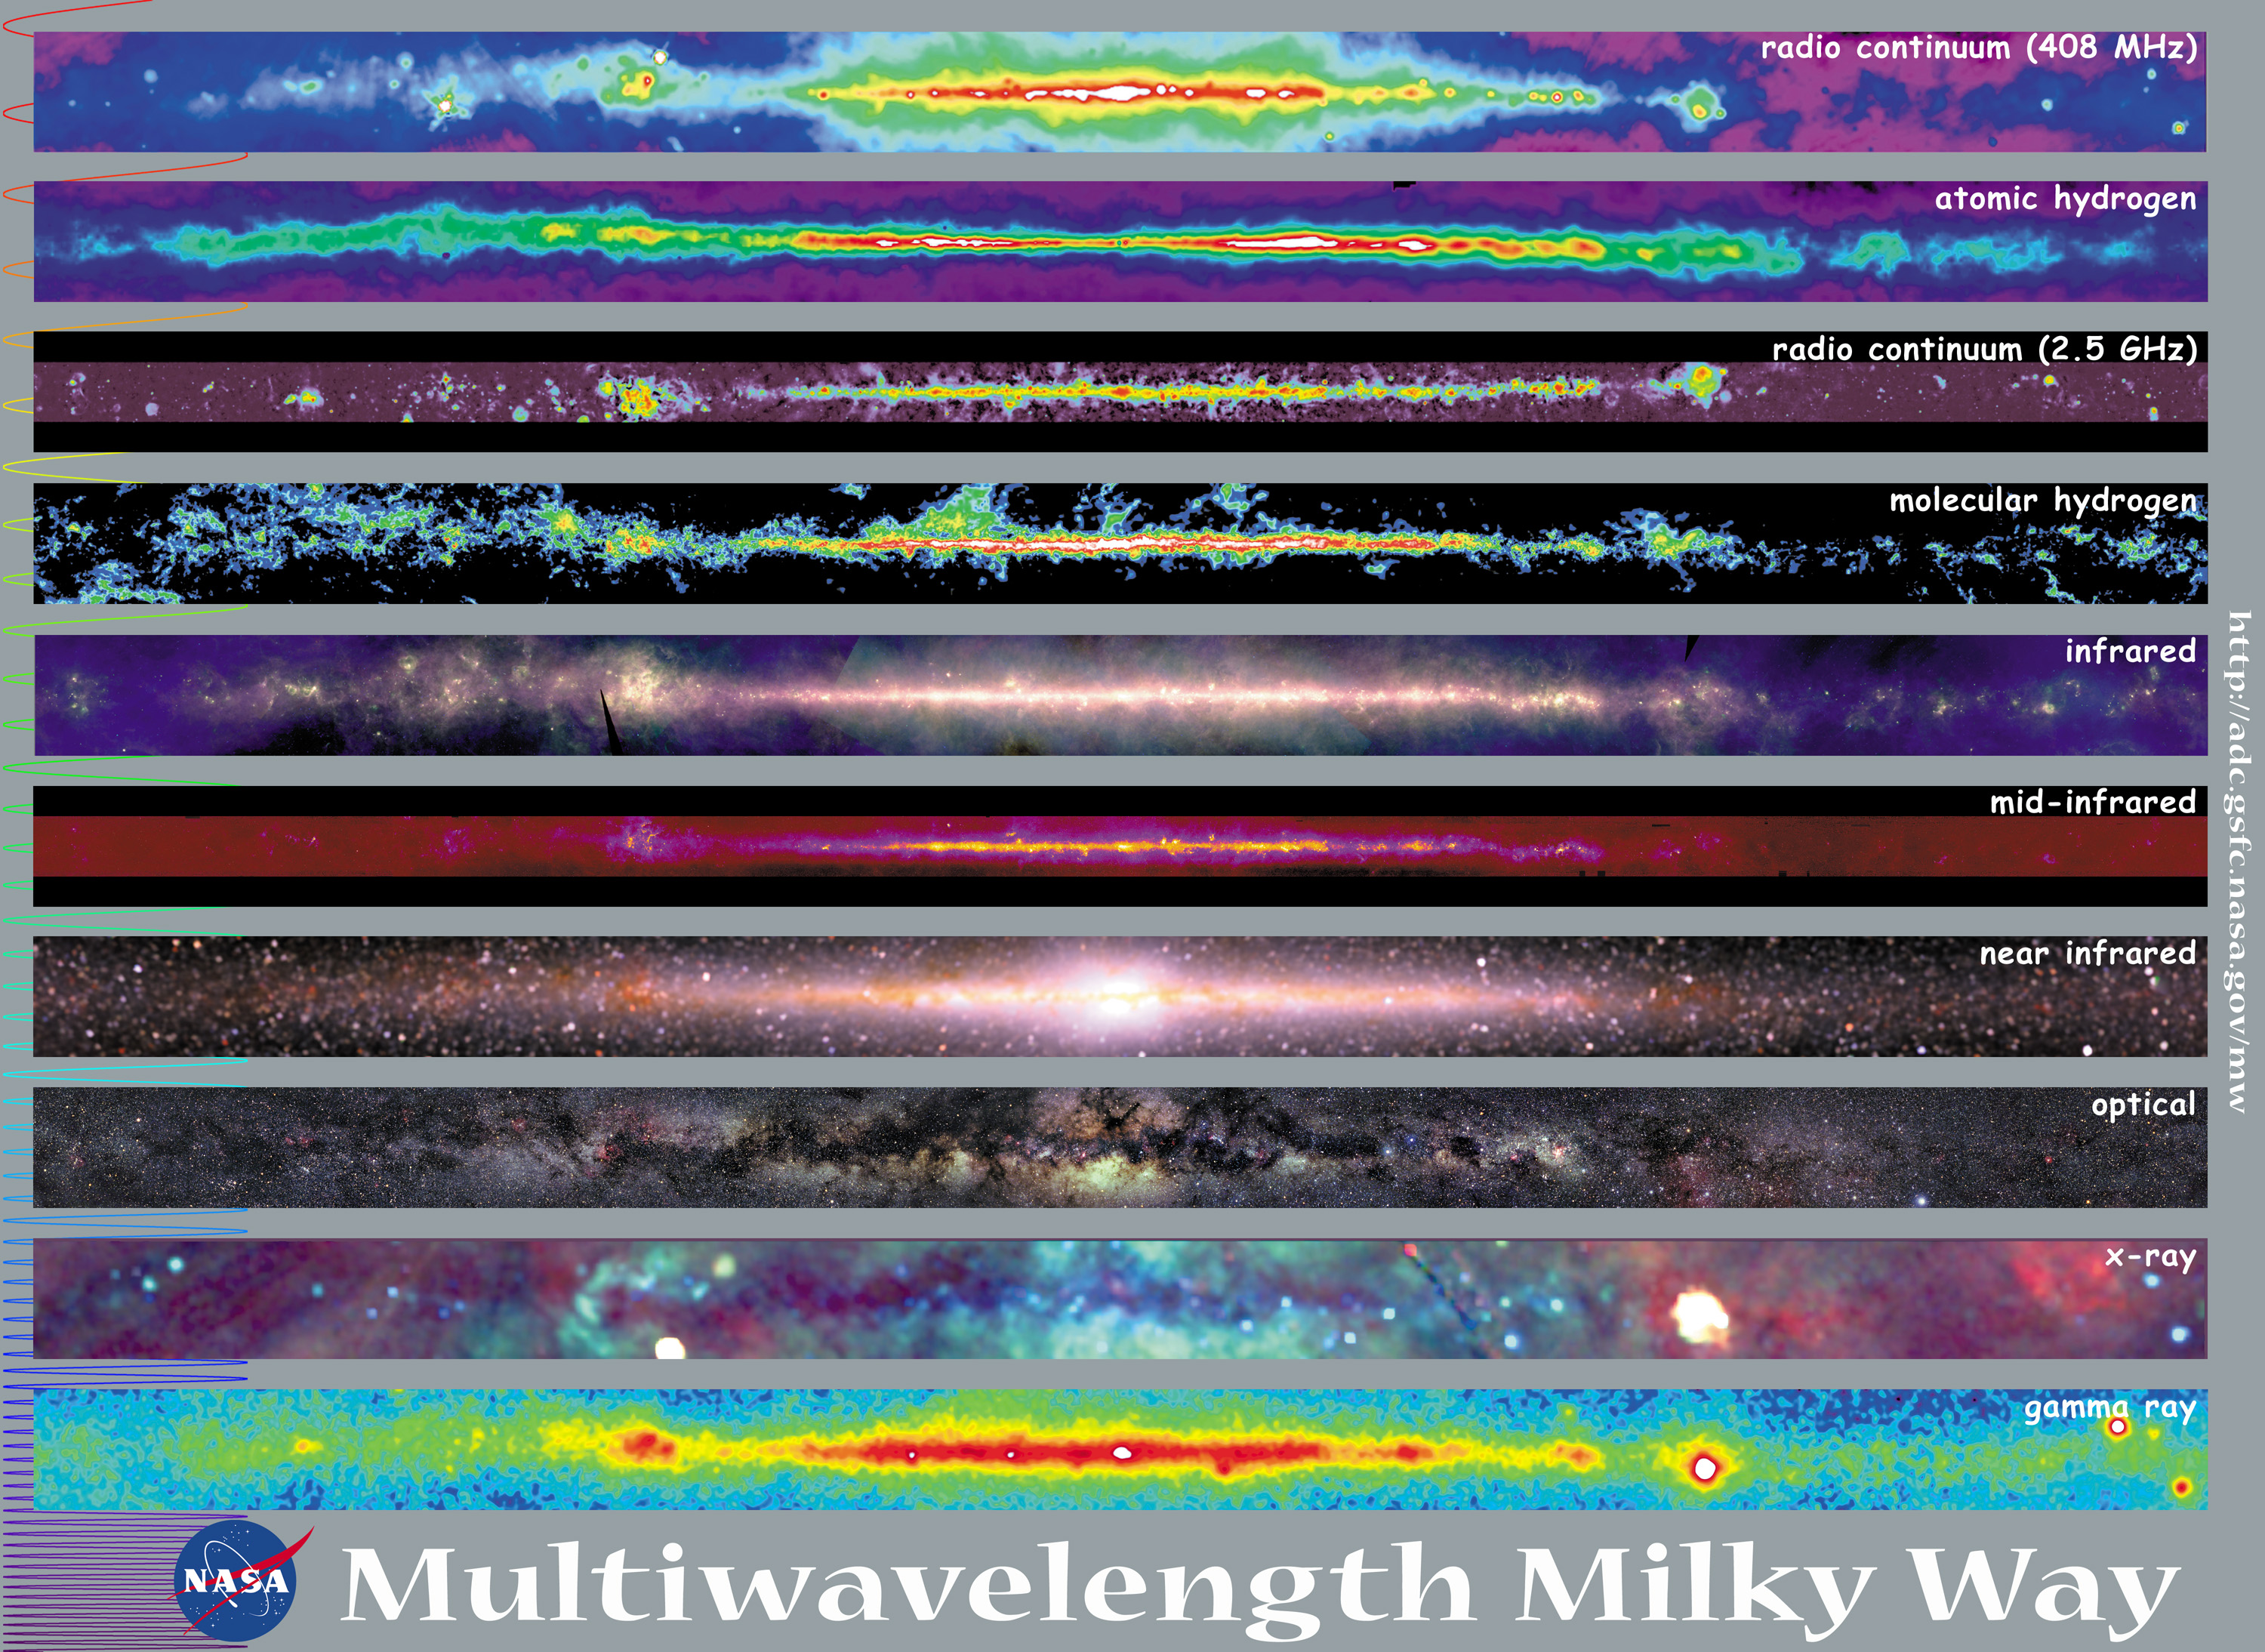
Image courtesy of
NASA
  Q:  Compare the "infrared" picture to the "optical" picture.
        What features are the same in both?
        What features are different?

  Q:  Do you see any evidence for dust?
Copyright © Michael Richmond.
This work is licensed under a Creative Commons License.