 Copyright © Michael Richmond.
This work is licensed under a Creative Commons License.
Our goal is to figure out the abundance of different chemical elements in a star from the appearance of its spectrum. The Boltzmann and Saha equations are part of the procedure, but there's another piece to to the puzzle: how to translate the width and/or depth of a spectral line into the number of atoms of material. That's the topic for today.
We will need to describe the strength of a spectral line in some quantitative manner. Astronomers have devised several terms to help us to do this.
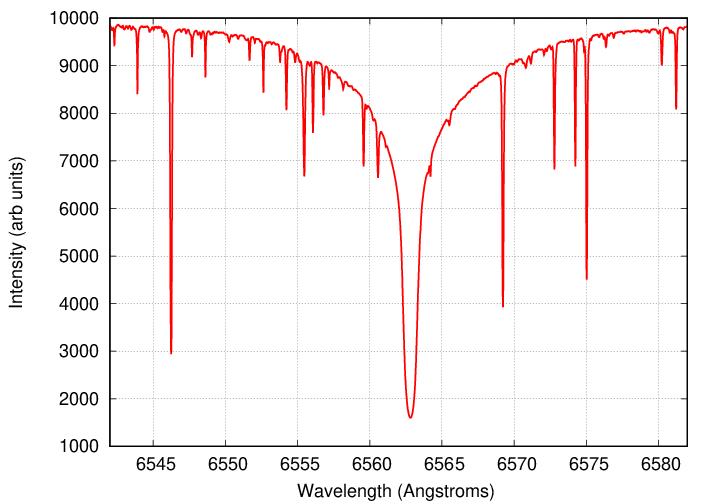
Consider the following small piece of the solar spectrum.

There is one monstrously strong line around 6563 Angstroms, surrounded by a bunch of weaker lines. That much is clear. But how much stronger? Or how much weaker?
One term is depth, which is simply the fraction of the nearby continuum light which is removed by an absorption line.
  Q:  What is the depth of the line at 6546 Angstroms?


  Q:  What is the depth of the line at 6580 Angstroms?
If the depth of a line is less than 100 percent, then the material does not block ALL the light from below, even at the central wavelength. In that case, we can say that the gas is optically thin, which means that we can make good estimates of the number of absorbing atoms based on the strength of the line.
In order to measure the strength of the line, we define the equivalent width to be the width (in wavelength) of an imaginary rectangle which
In the example below, the equivalent width of the real absorption line (show in blue) is the width of the brown rectangle which causes the blue and brown shaded areas to be equal.
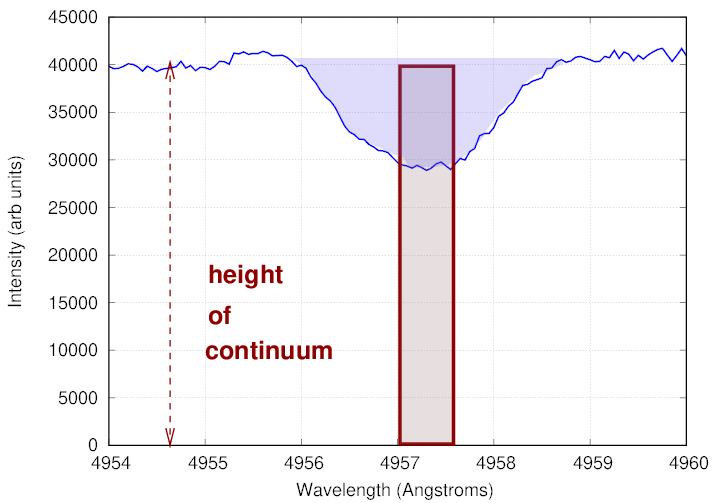
Q: What is the equivalent width of this absorption line?
Let's look at a portion of the solar spectrum in the red, from 6500 to 6600 Angstroms. There are many fewer lines here than in the blue portion of the spectrum, so it's easier to see details of individual features.

There's a big whopping line in this region. What is it?
  Q:   What element, and what transition, creates this line?


  Q:   What is the equivalent width of the strong line?
On the other hand, there are also many weaker lines. Let's look more closely at the one near 6546 Angstroms:
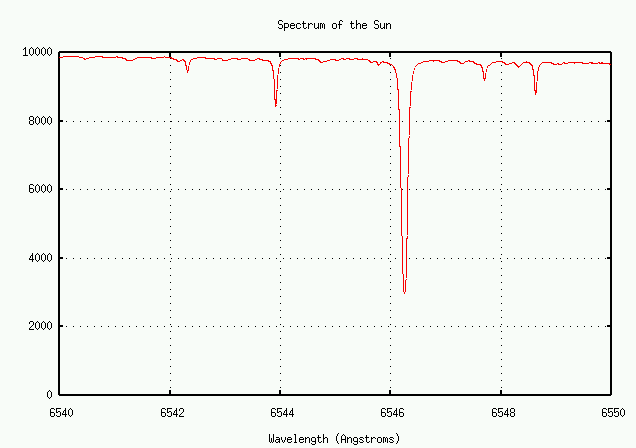
Let's zoom in some more ...
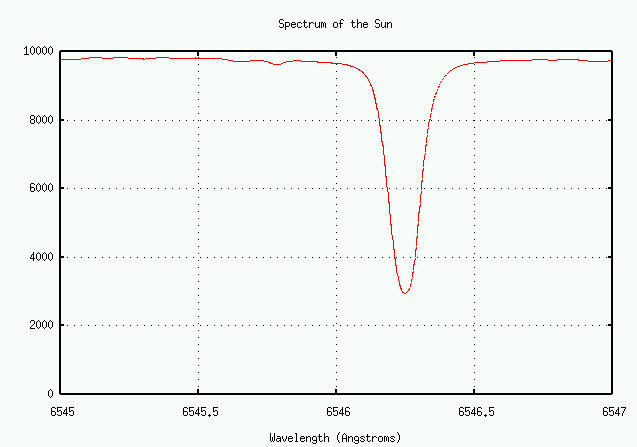
Does the weak line have the same shape as the really, really strong one? Well, let's plot them both together and find out. I'll modify the horizontal scale of the weaker line so that it fits into the same graph as the strong one.
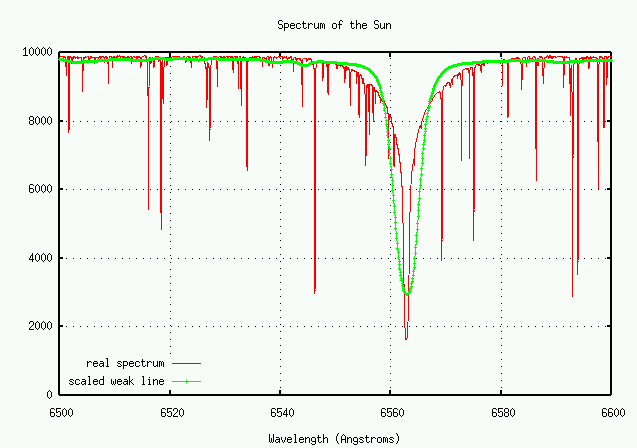
No! The weak line appears to have a wider core, but narrower wings. Why is that?
The answer is that the SHAPE of an absorption (or emission) line depends on several factors.
Atoms emit (or absorb) light when their electrons jump from one energy state to another. In the case of the H-alpha line, the transition involves the n=3 and n=2 states of hydrogen.
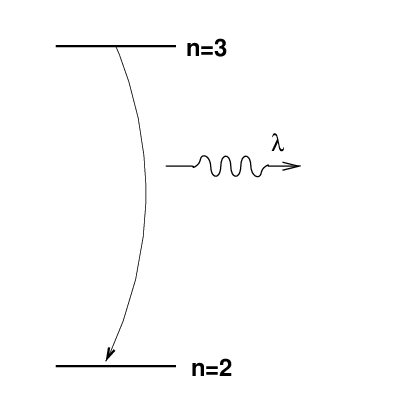
If we knew the energy difference exactly, then we would know the wavelength of the photon exactly. However, due to Heisenberg's Uncertainty Principle, we do NOT know the energies exactly. One way to look at is that atoms very quickly jump from an excited state to a lower state; that means that you don't have very long to measure the energy in the upper state. The limit on the time available to measure the excited state's energy places a limit on the precision of the energy measurement:

The lifetime of hydrogen atoms in their excited states is very short. The Einstein A coefficients, which describe the probability that one particular atom will undergo a particular spontaneous emission transition, are roughly equal to the reciprocal of the time an atom will spend in some excited state. Since the values of the Einstein A coefficients for the n=2 and n=3 states of hydrogen are both about 108 seconds, the lifetime of hydrogen in each of the n=2 and n=3 states is about 10-8 seconds, so the combined uncertainty is about 2 x 10⁻⁸ seconds.
  Q:   Estimate the uncertainty in the energy of a Balmer-alpha photon.


  Q:   Estimate the uncertainty in the wavelength of a Balmer-alpha photon.


  Q:   Compare this to the equivalent widths of the
                  Balmer-alpha line and the weak line in the
                  actual solar spectrum.
If the atoms emitting and absorbing light are moving towards and/or away from an observer, then he will see Doppler shifts in the wavelengths:

where the velocity v is taken to be positive for motion AWAY from the observer, and negative for motion towards the observer. For the common case of non-relativistic motion, this simplifies to

  Q:   Estimate the speed of hydrogen atoms in the
             photosphere where T = 6000 K.


  Q:   Calculate the typical size of the Doppler shift due to
             random atomic motion.


  Q:   Compare this to the equivalent widths of the
                  Balmer-alpha line and the weak line in the
                  actual solar spectrum.
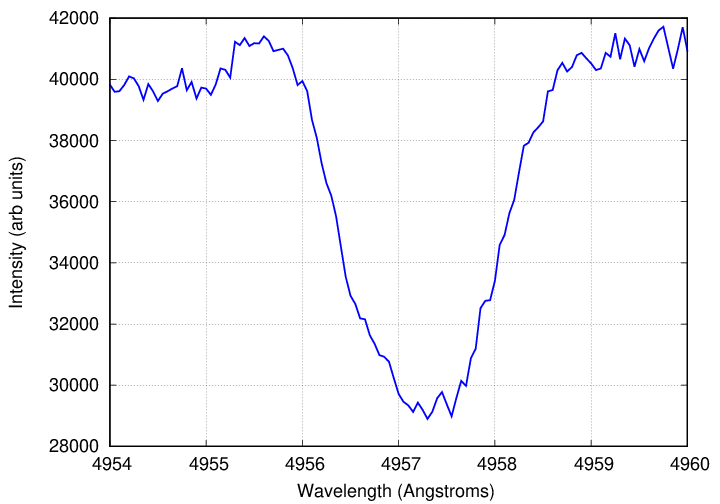
Another sort of Doppler broadening can occur if there are fast bulk motions of the gas which is absorbing or emitting the light. Suppose, for example, that a star is rotating very quickly. Light from the left-hand side of the star's disk might be moving away from us at speed +v, while that on the right-hand side will be moving toward us with speed -v. Absorption lines will be spread out in each direction away from the central wavelength by an amount Δλ which is given by the Doppler formula.
The spectrum below shows one line in the star HD 112313, which happens to be rotating very fast. Can you figure out how fast it rotates?
Data courtesy of
Elodie archive.
  Q:   What is the Δλ width of this line, from the
             center to one edge?


  Q:   How fast must the star be rotating?


  Q:   The Sun has radius 6.95 x 10⁸ meters and rotates
             in very roughly 30 days.  What is the rotational speed
             of the Sun?
Some stars suffer from turbulence: large-scale, coherent flows of material in bulk. If the star is cool (so thermal motions are relatively slow), and the turbulence is sufficiently strong, the Doppler shift due to bulk motion may exceed that of molecular motion.
How important is this on the Sun? Let's see .... take a look at this movie of the Sun, which comes from a collection of solar movies taken by the Dutch Open Telescope.
This movie shows a region of the solar photosphere 52 by 35 arcseconds across. Note the clock in the lower-left corner.
Exercise:
- How long does the movie last?
- How long does a typical cell last?
- How wide is a typical cell, in km?
- Assume that a granulation cell is thin: about 1/10 as high as it is wide. Assume that the gas makes one complete cycle during the life of a cell. What is the bulk velocity of the gas?
- How does this compare to the random velocity of individual H atoms in the gas?
Atoms in a cloud of gas experience two types of perturbations from their neighbors. They collide directly with some, and feel the electric fields of the electrons passing close by; these two effects lead to collisional and pressure broadening, respectively. For our purposes, we'll treat them as equivalent.
To a rough approximation, we can estimate the collisional effect with the uncertainty principle. The typical time between collisions limits our ability to measure the exact energy of an atom, because its state will change with each collision. So, just how long do we have between collisions? The mean free path of an atom is

and the speed of atoms of mass m in a gas at temperature T is

so the time between collisions is

We can then equate this time with the uncertainty in time in the Heisenberg uncertainty equation, and derive an uncertainty in energy, which we can again convert into a range of wavelength.

   Assume that the Sun's photosphere is made of
       hydrogen atoms, with mass m = 1.67 x 10⁻²⁷ kg,
       cross-section area σ = 3.5 x 10⁻²⁰ square meters,
       at a density of n = 1.5 x 10²³ atoms per m3,
       at a temperature of 5800 Kelvin.

      Q:  What is the mean free path of atoms?

      Q:  What is the typical speed of atoms?

      Q:  What is the typical time between collisions?

      Q:  What is the corresponding uncertainty in energy?

      Q:  What is the width of the H-alpha line at 6563 Angstroms
                due to this effect?
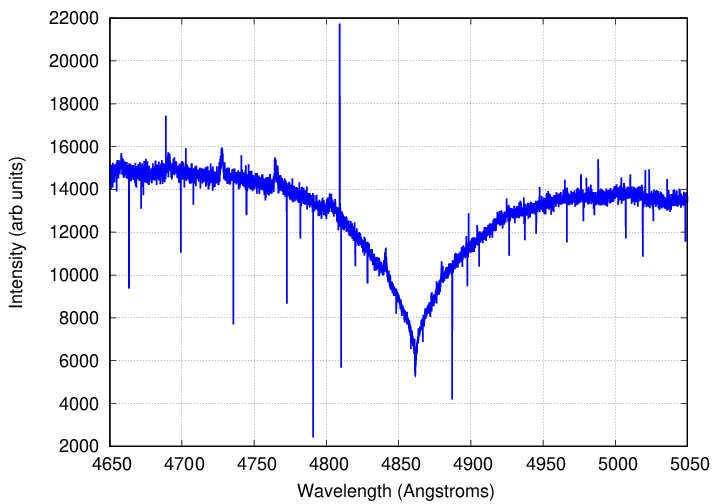
As you can see, this effect is not very important in the photosphere of the Sun. In some rather unusual stars, however, it can grow to dominate the appearance of a line. For example, look at the hydrogen-beta line (n=4 to n=2, energy 2.55 eV) in the spectrum of the star 40 Eridanus B.
Data courtesy of
Elodie archive.
  Q:  What is the full width of this line, measured at the level
             of the continuum?

  Q:  The temperature of 40 Eri B is about T = 17,000 Kelvin.
             Assuming its atmosphere is pure hydrogen,
             and that the line is broadened by collisions,
             estimate the density of its atmosphere.


  Q:  How does that compare to the density of the Earth's atmosphere?
 Copyright © Michael Richmond.
This work is licensed under a Creative Commons License.