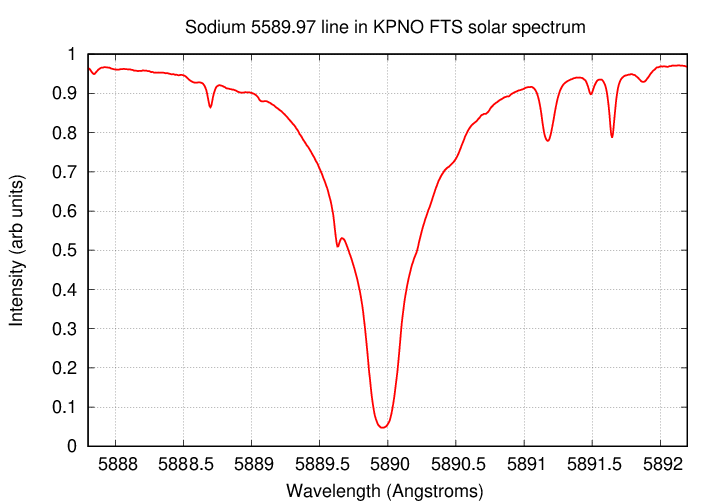
A small portion of the solar spectrum near the sodium 5889 Angstrom absorption line is shown above. You can find a datafile with wavelength (column 1) and intensity (column 2) at
- kpno_solar_5880.dat (columns separated by spaces )
- kpno_solar_5880.csv (2 columns, separated by commas)
- Estimate the intensity level of the continuum in this region of the spectrum.
- Using a very simple method, assume that the absorption line is a triangle. Estimate the width of the base, and the depth of the triangle. Write down these values. Then use those values to calculate a (very very approximate) equivalent width for this line.
- Apply numerical integration to the values in the supplied datafile in order to compute a more accurate value for the equivalent width.
Let's use the STATSTAR program to investigate the internal properties of a 1 solar mass star on the main sequence. You can find a datafile with the STARSTAR output here:
- starmodl.dat for 1-solar mass star (columns separated by spaces)
- starmodl.csv for 1-solar mass star (columns separated by commas)
- Make a graph showing density as a function of radius throughout the star. Be sure to label the axes properly, including units.
- At what radius is half the mass of the star enclosed?
- At what radius is half the luminosity of the star enclosed?
- Are these two numbers the same? If not, explain why not.
             Mass       Luminosity      Temperature    X      Y
           ------------------------------------------------------
             1.0         0.86071         5500.2      0.70   0.008
             2.0        22.61200        11218.4      0.70   0.008
             4.0       341.09980        17904.0      0.70   0.008
             8.0      3421.51978        25613.6      0.70   0.008
           ------------------------------------------------------
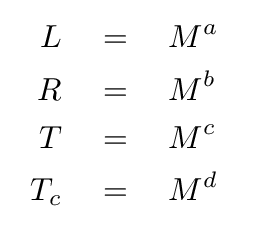
- Use these models to estimate the exponent of the following
relationships between the total mass "M" and other properties:
"L" = total luminosity, "R" = outer radius,
"T" = temperature of outer layers,
"T_c" = temperature of innermost region.
- mass = 1 solar mass
- luminosity = 0.88 solar luminosity
- X = 0.70
- Z = 0.008
If you can, write down the effective temperature of this model, and include in your homework submission a copy of the "starmodl.dat" output file.