 Copyright © Michael Richmond.
This work is licensed under a Creative Commons License.
Copyright © Michael Richmond.
This work is licensed under a Creative Commons License.
What is integration? The basic idea is pretty simple:
Integration is the act of adding up a bunch of little actions
That's really all there is to it. The procedure of performing this addition may at times involve a number of steps, but when we integrate, all we're doing is adding together a bunch of little pieces.
Bob works at Soldman Gachs, the giant investment bank. He works on commission -- the more clients he finds, the more money he makes. Bob is paid $10,000 per month for each client he maintains.
Bob starts off in January with just one client. During that month, he gets in touch with another, so when February starts, he has two clients. During the Presidents' Day Parade, he chats with an industrialist ... so when March rolls around, he has three clients. In fact, Bob manages to add one more client to his Rolodex every month.
     January                1 client
     February               2 clients
     March                  3 clients
     April                  4 clients
     May                    5 clients
     June                   6 clients
     July                   7 clients
     August                 8 clients
     September              9 clients
     October               10 clients
     November              11 clients
     December              12 clients
How much does Joe make over the course of one year?
  total over 12 months  =     ($10,000/client/month) * (1 client)  * (1 month)
                            + ($10,000/client/month) * (2 clients) * (1 month)
                            + ($10,000/client/month) * (3 clients) * (1 month)
                            + ($10,000/client/month) * (4 clients) * (1 month)
                            + ($10,000/client/month) * (5 clients) * (1 month)
                            + ($10,000/client/month) * (6 clients) * (1 month)
                            + ($10,000/client/month) * (7 clients) * (1 month)
                            + ($10,000/client/month) * (8 clients) * (1 month)
                            + ($10,000/client/month) * (10 clients) * (1 month)
                            + ($10,000/client/month) * (11 clients) * (1 month)
                            + ($10,000/client/month) * (12 clients) * (1 month)

                      =       $ 10,000
                          +   $ 20,000
                          +   $ 30,000
                          +   $ 40,000
                          +   $ 50,000
                          +   $ 60,000
                          +   $ 70,000
                          +   $ 80,000
                          +   $ 90,000
                          +   $100,000
                          +   $110,000
                          +   $120,000

                      =      $ 780,000
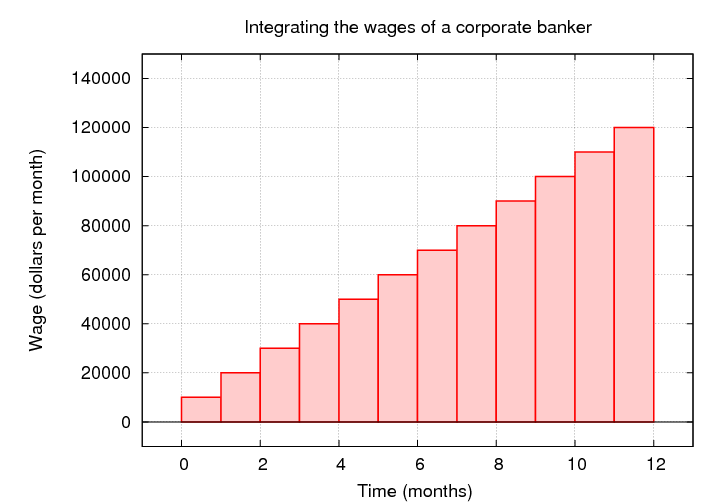
The amount of money Bob makes during the first month is given by the area of the first red box: $10,000 per month times 1 month = $10,000. If we add up the area of all the red boxes, we get Joe's total for the year: $780,000.
On Jan 1, 2010, when Bob starts work at the firm, his working income account is completely empty. Zero. (He has some offshore accounts, too, but we're ignoring those for now).
Let's look at Bob's private bank account balance as the year progresses.
On Jan 1, when Bob starts, his account has $0. But on Feb 1, after one month, his account is credited with $10,000. We could make a table showing the bank balance as a function of time:
    Date               Bank account balance
  --------------------------------------------
    Jan 1, 2010            $        0
    Feb 1                  $   10,000
    Mar 1                  $   30,000
    Apr 1                  $   60,000
    May 1                  $  100,000
    Jun 1                  $  150,000
    Jul 1                  $  210,000
    Aug 1                  $  280,000
    Sep 1                  $  360,000
    Oct 1                  $  450,000
    Nov 1                  $  550,000
    Dec 1                  $  660,000
    Jan 1, 2011            $  780,000
  --------------------------------------------
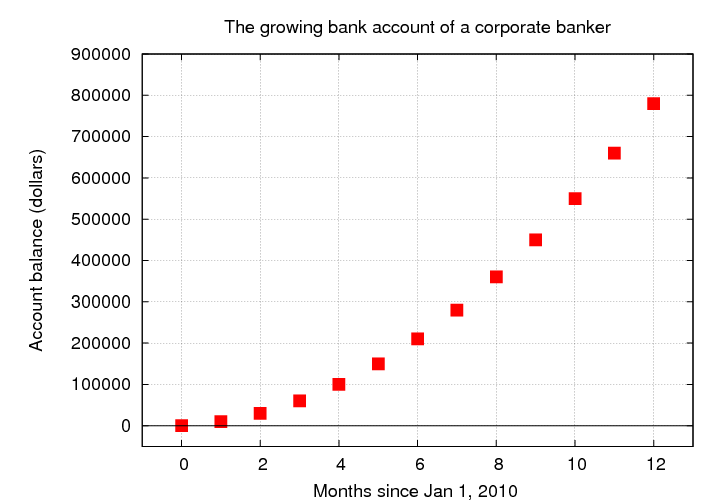
Hmmmm. That bank account starts off growing slowly, but it is increasing very rapidly by the end. That's pretty obvious if we make a graph, showing the account balance as a function of time.
We can express Bob's experience in ordinary speech:
If your salary goes up over time, then your total income grows by leaps and bounds.
But we could be a bit more precise:
If you put money into the bank at an increasing rate, your account balance grows by larger and larger amounts.
If we step back and look at this example through the eyes of a mathematician, we can describe it precisely using technical language:
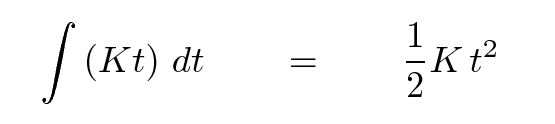
If you integrate a linearly increasing function, you end up with a quadratically increasing function.
We can even put it into mathematical symbols:
Copyright © Michael Richmond.
This work is licensed under a Creative Commons License.