
 Copyright © Michael Richmond.
This work is licensed under a Creative Commons License.
Position tells you the location of an object.
Velocity tells you how fast is the position is changing.
These two quantities are clearly related. In fact, we can write two different equations to express this connection.
Let's take derivatives first.

If we take the derivative of this equation -- that is, the derivative of position with respect to time -- then we will end up with the instantaneous velocity of the car.

Can you take this derivative?
Right. The instantaneous velocity is just a constant 5 m/s.
Graphically, "take a derivative" means "measure the slope". If we go back to the graphical representation of position as a function of time, we see that the velocity is just the slope of the line through the data.
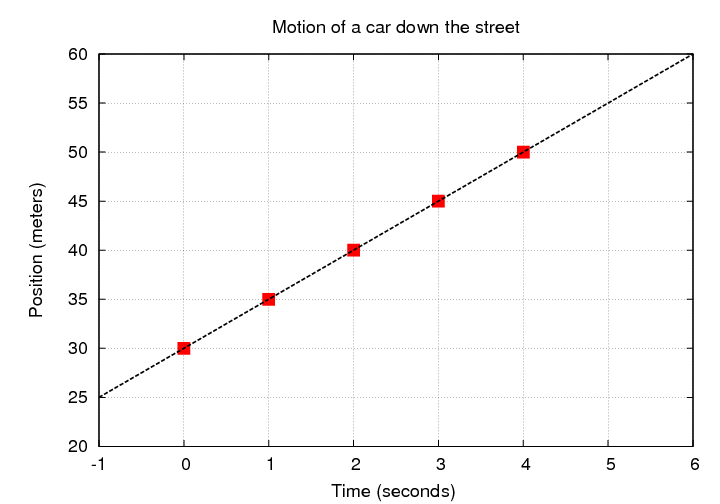
  Q:  What is the slope of this line?

  Q:  What are the units of the slope of this line?
Right. The slope has a magnitude of 5, and the units are rise over run, or meters over seconds. That all makes sense for a velocity.
We've just seen that if one starts with an equation (or graph) for position as a function of time, one can figure out the velocity as a function of time. It's also possible to go the other way: if one is given the velocity as a function of time in an equation (or on a graph), one can figure out the position. The key is to integrate:

For example, suppose that we know that the velocity of a car is a constant v = 5 m/s. Then we can find its position like this:
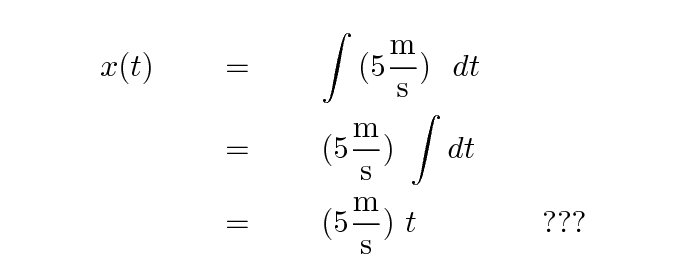
Q: Is that it? Or is something missing?
Yes, there is something missing. Every time one integrates a function, one ends up with a possible additional constant value, sometimes called the "constant of integration".

What's the value of the constant? In order to answer that question, you need to look at the information you have about the car. For example, back on the street, we see two cars: each car is travelling at 5 m/s, but the blue car is far ahead of the red car.
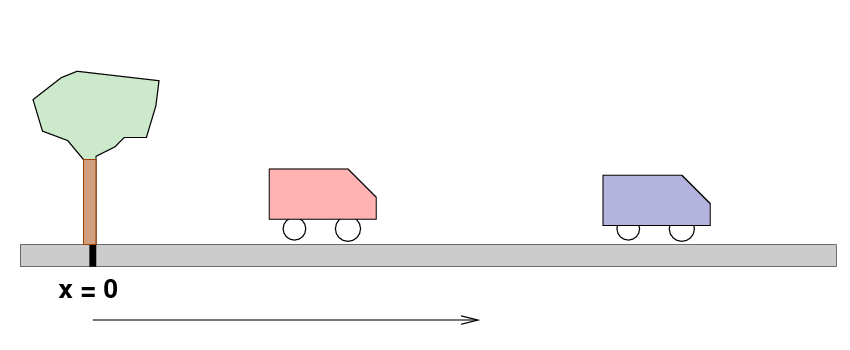
| time | 0 s | 1 s | 2 s | 3 s | 4 s |
| red car | 30 m | 35 m | 40 m | 45 m | 50 m |
| blue car | 75 m | 80 m | 85 m | 90 m | 95 m |
  Q:  Can you write an equation for the position of the red car
          as a function of time?

               x    (t)   =
                red


  Q:  Can you write an equation for the position of the blue car
          as a function of time?

               x    (t)   =
                blue
There's another way to start with velocity and end up with position. Start with a graph which shows velocity as a function of time instead of position as a function of time. For our standard example, this is pretty boring.
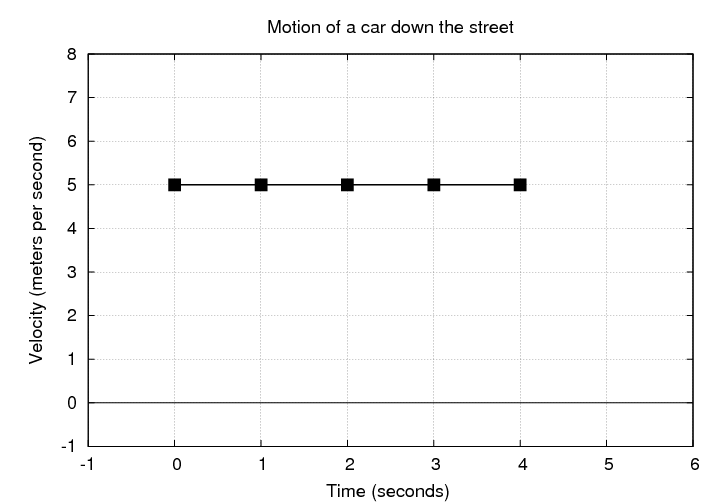
Now, if you look at the area under this curve, it tells you how far the car moved from one time to another. For example, suppose we pick a starting time of t = 1 s and an ending time of t = 3 s.
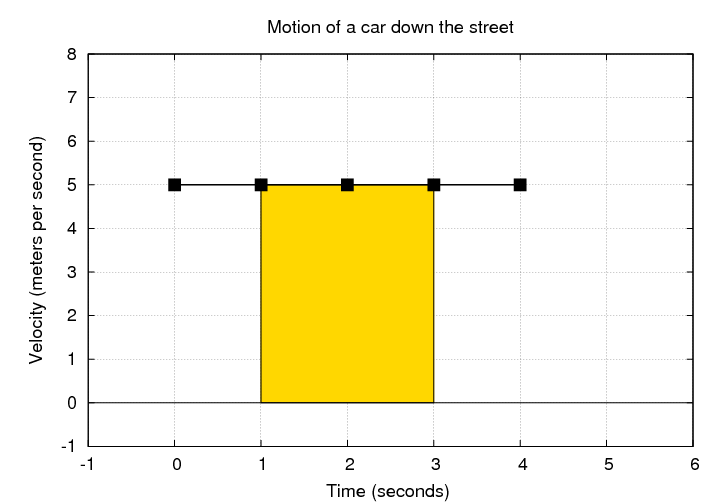
   Q:  What is the area underneath the curve (between the velocity values
            and the v = 0 axis) between t = 1 and t = 3?


   Q:  How far did the car move between t = 1 and t = 3?
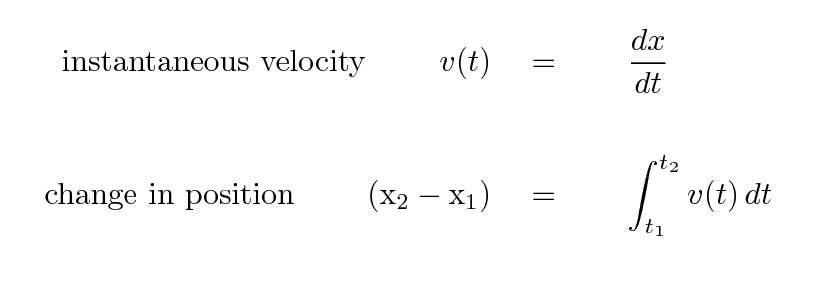
So, to summarize,
Let's do an example. Fred fires a bullet from his AK-47.
| time | 0 s | 0.3 s | 0.6 s | 0.9 s | 1.2 s |
| position | 54 m | 298 m | 541 m | 785 m | 1028 m |
  Q:  What is the average velocity between t = 0.3 s and t = 0.9 s ?

  Q:  What is the average velocity between t = 0.6 s and t = 1.2 s ?


  Q:  Write an equation of motion for the bullet of the form


           x(t)  =  ____________   +   _______________
One more example: a car skids along a snowy driveway.
| time | 12 s | 14 s | 16 s | 18 s |
| position | 42 m | 15 m | -12 m | -39 m |
  Q:  Write an equation of motion for the car of the form


           x(t)  =  ____________   +   _______________
 Copyright © Michael Richmond.
This work is licensed under a Creative Commons License.