 Copyright © Michael Richmond.
This work is licensed under a Creative Commons License.
Your job in this project: use Euler's method to determine the height and speed of a man who jumps out of an airplane.
The situation is: an airplane moves in level flight at a height of H = 10,000 meters above the ground. Joe opens the door and steps out at t = 0. What are his
You should use Euler's method in this project. Apply a first-order expansion of both y(t) and v(t) around the current time t0, to predict the height and velocity at the next time t1.
There is an equation which gives the velocity at time t1, in terms of quantities known at time t0.
        v(t1)  =  v(t0)  +   v'  * (t1 - t0)

               =  v(t0)  +  (-g) * (t1 - t0)
since the first derivative of velocity is acceleration,
which is simply -g = -9.8 m/s^2.
Write a MATLAB routine which calculates position and velocity as a function of time for this problem. It should look like this:
function skydiver(start_height, timestep, output_file)where
      start_height            is the starting height, in meters

      timestep                is the size of the timestep (t1 - t0) to use
                                  in calculations, in seconds

      output_file             is the name of a file in which you will
                                  write values of time, height, and speed
As you go through a loop, calculating height and speed at each time, you should write the values into a text file, for later use. Here's how to do it:
       % (near the start of the program)
       fid = fopen(filename, 'w');


       % (in the main loop)
           fprintf(fid, '    0.0000     0.0000     0.0000 \n', time, height, velocity);
       % (end of loop)


       % (near the end of the program)
       fclose(fid);
Examples of simple functions which read and write data from and to files can be found on the course WWW page:
The output file should contain data like this:
  0.0          10000.0         -0.0
  1.0           9995.1         -9.8
  2.0           9980.4        -19.6
where the first column is time (in seconds), the second column is height above the ground (in meters), and the third column is velocity (in meters per second, upwards positive and downwards negative).
Use a timestep of 1.0 seconds. Stop the loop when Joe reaches the ground.
function plot_skydiver(datafile, y_var)
where
            datafile           is the name of a file in which the data
	                           for the simulation have been placed

            y_var              is a string which indicates the value
	                           to plot versus time: it must be either
				         'height'
                                   or
				         'velocity'
To get you started, look at a program I wrote which does most (but not all) of the tasks:
You can copy this program and then modify it as necessary.You'll probably want to know how to compare two strings in MATLAB; that is, how to check if the user supplied 'height' or 'velocity' as the second argument to your function. You can use the strcmp function to do the trick, as illustrated in this sample function:
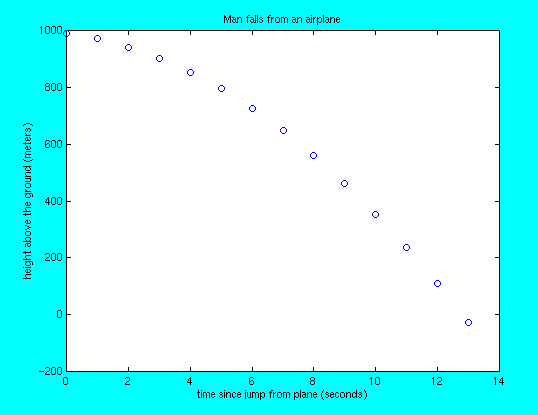
Your program should produce a graph which looks something like this:

                          G*M
               accel  =  ------  =  9.80  m/s^2
                          R*R
Now, modify the formula so that it yields the acceleration
of an object at some height H above the surface.
Expand the formula so that it shows the acceleration
to first order in H/R, assuming that H << R.
Use this formula to calculate Joe's acceleration as he falls;
it will not be constant, but grow very slightly as he comes
closer to the ground. Use a value R = 6380 km
in your calculations.
How big a difference does this variable acceleration make in the time it takes Joe to hit the ground?
You can do this in several ways. One is to figure out how to pause the program's execution for just the right amount of time between dots. Another is to use MATLAB's movie functions to create a movie which plays one frame per second, and draw the appropriate dot for each second. You can find some very terse information on making MATLAB movies at
http://www.nwl.ac.uk/staffpages/cjsc/MATLAB_Movies/movies.html
This page maintained by Michael Richmond. Last modified Apr 13, 2003.
 Copyright © Michael Richmond.
This work is licensed under a Creative Commons License.