 Copyright © Michael Richmond.
This work is licensed under a Creative Commons License.
Copyright © Michael Richmond.
This work is licensed under a Creative Commons License.
Project 5: Different Methods of Numerical Integration
Due Dates
- Monday, April 16, at noon
- The finished Scilab code and analysis
Your job in this project:
write programs to
- integrate a given function of one variable over a given interval,
using three different methods
- analyze properties of the diffraction pattern when
light passes through a rectangular slit,
and when light passes through a circular aperture
You may find some notes of the properties of
light and diffraction in
lecture notes on diffraction.
You may not use Scilab's built-in functions for
finding maxima or performing numerical integration -- instead,
please implement these algorithms yourself.
You'll need to modify some of your existing Scilab source code
files from last week
in order to write two new functions.
Don't worry -- they are all very much
alike, and you'll be able to cut and paste.
- rect_integ.sci
- trap_integ.sci
- simp_integ.sci
I'll provide a couple of functions that you may use this week:
Use different methods to analyze light passing though
a rectangular slit
When light of a wavelength lambda passes through
a rectangular slit of width a and then falls on a
distant surface, we see a set of parallel bands,
bright and dark, which gradually grow indistinct.
In order to find
the intensity of light at an angle
θ from the center of the pattern,
we first define an auxiliary quantity -- it will make the
computations simpler --
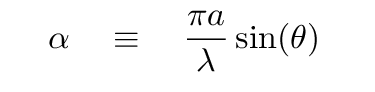
and then we compute
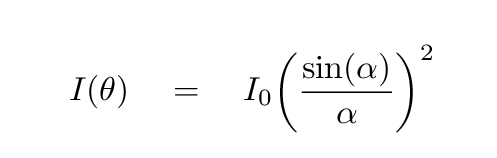
Your job is to integrate this function over various ranges of
angle θ.
You may use the sinc_squared.sci
function I wrote, or one of your own.
You must provide three (very similar) functions this week:
 function y = rect_integ(start_x, end_x, epsilon, func)

 function y = trap_integ(start_x, end_x, epsilon, func)

 function y = simp_integ(start_x, end_x, epsilon, func)
where the arguments are
              start_x          start of the interval to integrate

              end_x            end of the interval to integrate

              epsilon          termination criterion: stop iterating
                                    when the fractional change in integral
                                    drops to this level

              func             the function to integrate

              y                (output argument) is the result of the
                                    integration
Each routine integrates the given function over the given interval
and returns as its output argument the result.
For example, if I provided the simple function
simple_func.sci
  function y = simple_func(x)
    y = 2*x;
  endfunction
and then called the rect_integ function like so:
a = rect_integ(1, 3, 1e-4, simple_func);
I should end up with a = 7.9995... .
I suggest that you test your functions by using them
to integrate simple functions, to which you know the correct
answer.
Questions about the numerical algorithms:
- Set the wavelength lambda = 1.0
and the width of the slit a = 10.0.
Use each method (rectangular, trapezoidal, Simpson's)
to integrate the intensity
of the diffraction pattern from an angle
θ = 0 to θ = 0.3.
For each of the three methods, you must divide the
interval into 16, 32, 64, 128, 256 little pieces.
Make a table which shows for each method
     # of slices                      fractional change
                                    since previous iteration
   ----------------------------------------------------------
       16
       32
       64
      128
      256
- Using your tables as evidence, answer the following question:
- Which method converges most rapidly?
- How fast does each method converge? That is, if
you double the number of slices, does the fractional
change go down by a factor of 2? Or a factor of 4?
Or what?
- For each method, find out
how many pieces into which you must break
the interval in order to reach a fractional change of 1e-5.
Make a table which shows the number the pieces, and the time
it took your program to reach this point and evaluate the integral,
for each method.
That is, include the time it takes your program to iterate
until it reaches the number of pieces required to satisfy
the criterion.
Which is fastest?
Let's now ask a few questions about the physics --
properties of the pattern of light itself.
You may use whichever method you wish to answer them.
Continue to use lambda = 1 and a = 10.
- At what angle does the first dark spot occur?
That is, at what angle will the light intensity first
drop to zero?
- At what angle does the second dark spot occur?
- At what angle does the third dark spot occur?
- What fraction of the total light
falls in the central bright spot?
- What fraction of the total light
falls in the second bright spot?
- What fraction of the total light
falls in the third bright spot?
Bells and Whistles
- Using the same conditions as in question 1 above,
make a graph which shows the fractional change on the x-axis,
and the number of iterations required to find the
integral to that precision
on the y-axis.
Use logarithmic axes in both directions.
Plot the points for each method together on the same graph,
so that you can compare the methods directly.
It's okay if some methods have a different range
than other methods (that is, the rectangle method may
only go to epsilon = 1e-3, but the trapezoid method
to epsilon = 1e-5, or something like that).
What does the graph tell you about the efficiency
of the different methods?
- Light which passes through a circular aperture
will show a bright spot at the center
of the diffraction pattern, surrounded
by rings which gradually fade away.
The mathematical description of the intensity of light
as a function of angle away from the center is called
the Airy function, after the Astronomer Royal who
first analyzed it.
I've written a routine,
airy_func.sci,
which will give you the intensity as a function of angle:
function y = airy_func(lambda, diam, theta)
Use this function, and one of your routines,
to simulate starlight focused by the Hubble Space Telescope,
which has a diameter of 2.4 meters.
Adopt a wavelength in the middle of the visible range,
lambda = 550 nm.
- Make a graph showing the intensity as a function
of angle, with limits
theta = 0 to theta = 10 microradians.
- The resolution of HST is set roughly by the point
in this diffraction pattern at which the intensity
first falls to zero. What angle is this?
- Suppose HST takes a picture of one of the Apollo landing sites
on the Moon. Using your answer to the previous question,
estimate the linear size (in meters) of the smallest object
that HST could resolve. Could HST detect the
base of the lunar module which still sits on the
lunar surface?
This page maintained by Michael Richmond.
Last modified Apr 10, 2007.
Copyright © Michael Richmond.
This work is licensed under a Creative Commons License.