 Copyright © Michael Richmond.
This work is licensed under a Creative Commons License.
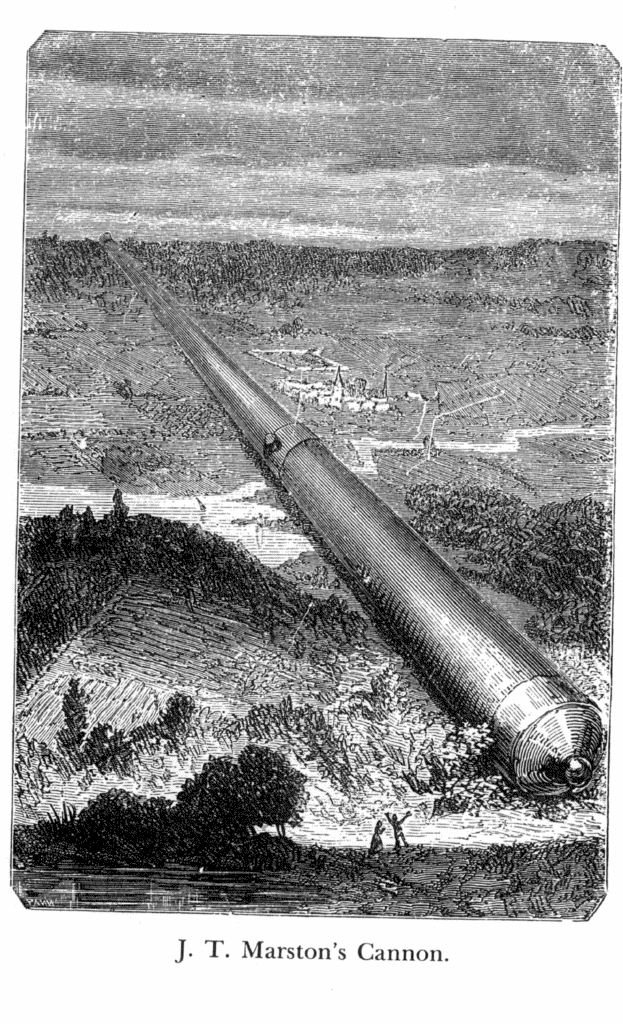
Your job in this project: use Euler's method to determine the height and speed of a projectile fired vertically upward from a cannon. This project is inspired by the Jules Verne novel "From the Earth the Moon", in which a group of retired Civil Way artillerymen decide to build a REALLY BIG cannon and fire it at the Moon.

The situation is: a cannon fires a projectile from ground level vertically upward with an initial velocity V0 = 1000 m/s (this velocity is small enough that the projectile eventually drops back to Earth). At all times t between launch and landing, you must calculate
You should use Euler's method in this project. Apply a first-order expansion of both y(t) and v(t) around the current time t0, to predict the height and velocity at the next time t1.
There is an equation which gives the velocity at time t1, in terms of quantities known at time t0.
        v(t1)  =  v(t0)  +   v'  * (t1 - t0)

               =  v(t0)  +  (-g) * (t1 - t0)
since the first derivative of velocity is acceleration,
which is simply -g = -9.8 m/s^2.
Write a Scilab routine which calculates position and velocity as a function of time for this problem. It should look like this:
function cannonball(start_velocity, timestep, output_file)where
      start_velocity          is the starting velocity, in meters per second

      timestep                is the size of the timestep (t1 - t0) to use
                                  in calculations, in seconds

      output_file             is the name of a file in which you will
                                  write values of time, height, and speed
As you go through a loop, calculating height and speed at each time, you should write the values into a text file, for later use. Here's how to do it:
       // (near the start of the program)
       fid = mopen(filename, 'w');


       // (in the main loop)
           mfprintf(fid, "    %9.4f  %9.2f  %9.2f \n', time, height, velocity);
       // (end of loop)


       % (near the end of the program)
       mclose(fid);
Examples of simple functions which read and write data from and to files can be found on the course WWW page:
The output file should contain data (something) like this:
  0.0              0.0       1000.0
  1.0            900.0        995.3
  2.0           1720.4        989.2
where the first column is time (in seconds), the second column is height above the ground (in meters), and the third column is velocity (in meters per second, upwards positive and downwards negative).
For the questions below, use an initial velocity of v = 1000 m/s. Start with a timestep of 1.0 seconds. Stop the loop when the cannonball reaches the ground.
function plot_cannonball(datafile, y_var)
where
            datafile           is the name of a file in which the data
	                           for the simulation have been placed

            y_var              is a string which indicates the value
	                           to plot versus time: it must be either
				         'height'
                                   or
				         'velocity'
To get you started, look at a program I wrote which does most (but not all) of the tasks:
You can copy this program and then modify it as necessary.You'll probably want to know how to compare two strings in Scilab; that is, how to check if the user supplied 'height' or 'velocity' as the second argument to your function. You can use the == operator to do the trick, sort of like this:
        if (plotvar == "height") then
           // plot the height
        else
           // plot the velocity
        end
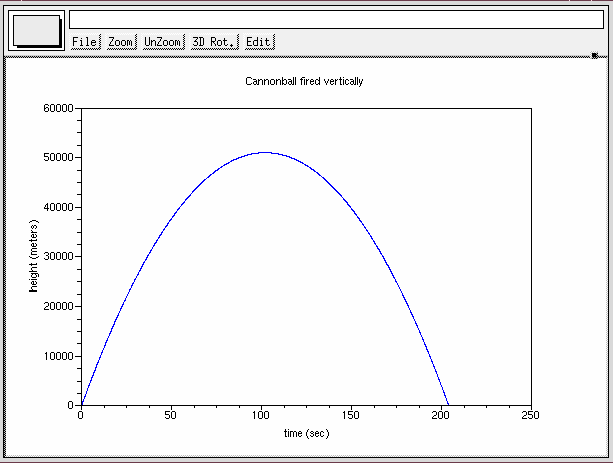
Your program should produce a graph which looks something like this:

How big a difference does this variable acceleration make in the time it takes the cannonball to hit the ground?
              KE  =  0.5 * mass * velocity^2

             GPE  =  mass * g * height

         total E  =   KE + GPE
In an ideal world, the total energy of the cannonball would be constant throughout its flight.
Use your program to compute the separate components and the total energy at each timestep. Make a graph of total energy versus time. Is it constant? If not, what percentage is lost or gained during the entire flight? Does the energy lost (or gained) grow in some simple way as a function of time? How does the overall energy change, from launch to landing, depend on the timestep?
This page maintained by Michael Richmond. Last modified Apr 17, 2007.
 Copyright © Michael Richmond.
This work is licensed under a Creative Commons License.