 Copyright © Michael Richmond.
This work is licensed under a Creative Commons License.
In this experiment, you will measure forces exerted over time on a cart as it bounces off an obstacle. Your job is to figure out the pre-bounce and post-bounce velocities of the cart, calculate the change in its momentum, and compare that to the impulse.
First, prepare by turning on the computer at your table and running the LabPro software.
Now, set up a track so that one end is slightly higher, at an angle between 3 and 4 degrees. Draw a picture and show your calculations for the angle.
Remove the hook from the force sensor and replace it with the rubber bumper. Place the force sensor at the bottom end. Put two mass bars or other heavy weights into the force sensor to hold it in place (you might even tape it into place on the track). Make sure that a heavy item sits next to the bottom end of the track to prevent the track from sliding across the table.

Put the cart so that the end of the plunger is 45 cm from the sensor. Call this your "starting point."
Minimize the LabPro window -- we are not going to use the sensors yet.
To make one set of measurements, release the cart from its starting point. The cart should roll down, bump into the force sensor, bounce off and roll back up the ramp. Watch carefully and mark the location it reaches at the apex of its motion.
Make three trial runs. Create a table showing all your results. How consistent are the results from one run to the next?
We will now find out how well you can predict the impulse given to the cart.
Maximize the LabPro window. Place the cart at the same starting point you used earlier. Press the Collect button on LabPro, and release the cart. The cart will roll down, bounce off the bumper, and roll back up the ramp. Measure the final position of the cart and mark it down.
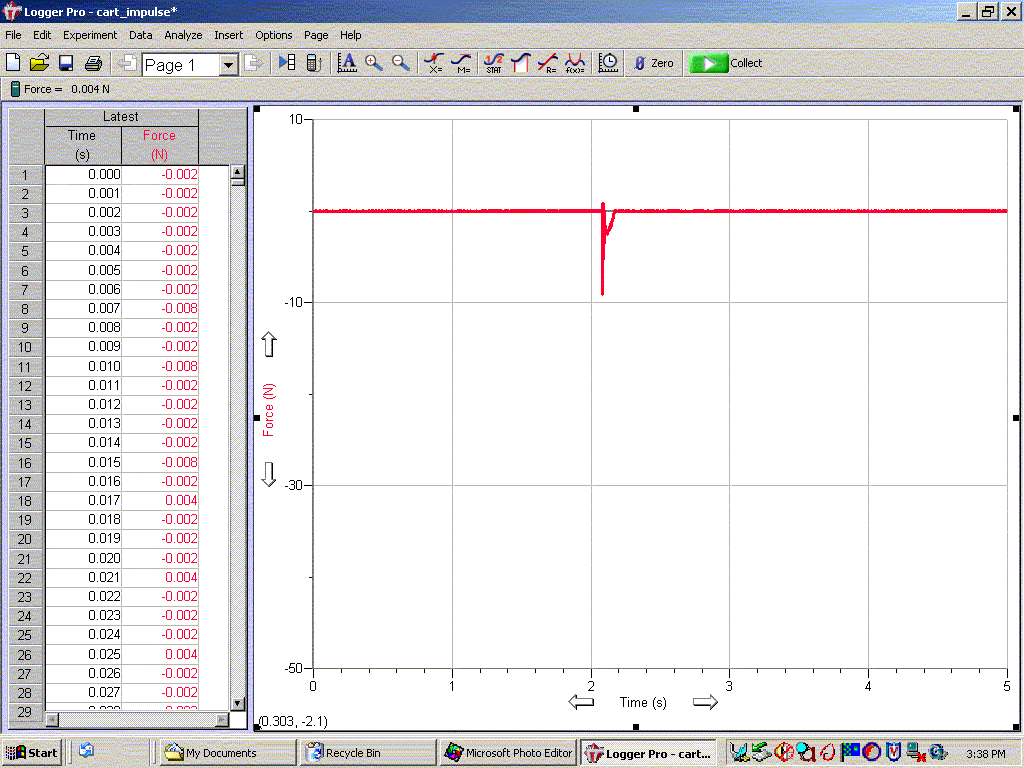
LabPro should show you a graph like this:

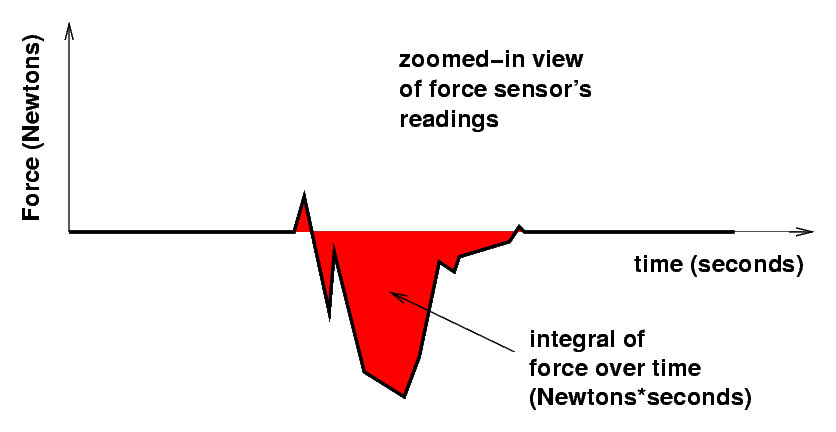
You can calculate the impulse on the cart by integrating the area under the curve: that will integrate force over time during the collision.

Compare the impulse given to the cart by the bumper (from the graph of force versus time) to your prediction (based on the cart's velocity before and after the collision). Do the computed impulse values agree with the measured impulse value(s) within this uncertainty?
Hand in your answers to all these questions, written neatly. Include a table with ALL your measurements, and include all your calculations, too.
 Copyright © Michael Richmond.
This work is licensed under a Creative Commons License.