I collected sample measurements on Oct 27, 2006, using the standard setups: the new "tiny" springs holding a 50-g mass hanger. I have 5 datasets. The "vanilla" datasets have Unix-type newlines, and I've removed the alternating lines which had only force measurements.
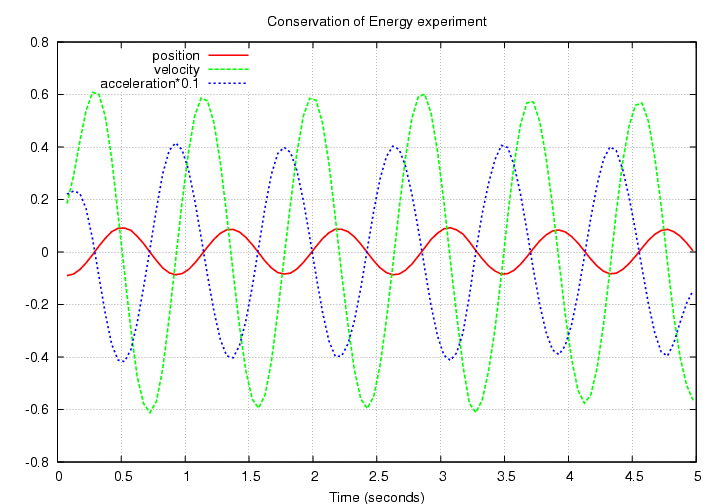
Let's look at properties of each dataset. Here's a simple graph of position, velocity, acceleration versus time for the large-amplitude version.

We can use the short datasets to compute the effective mass of the system:
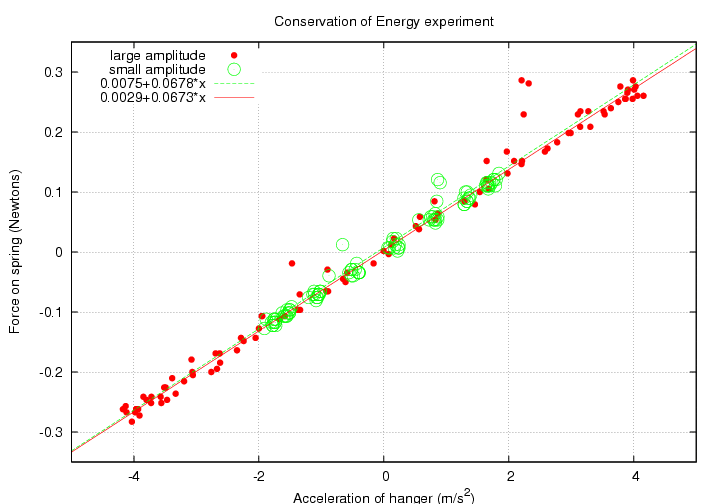
I find values:
Next, we can use the short datasets to compute the spring constant of the spring:
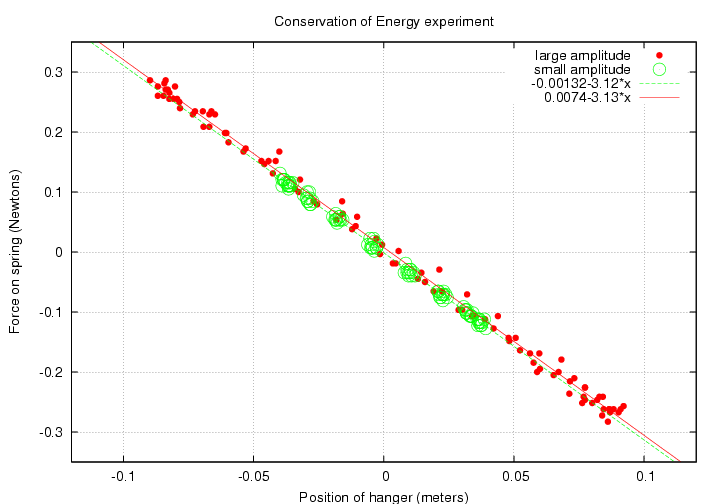
I find values:
If we use these values for m and k to compute kinetic and potential energy, then the total energy, we see some variation over the 5-second span of measurements:
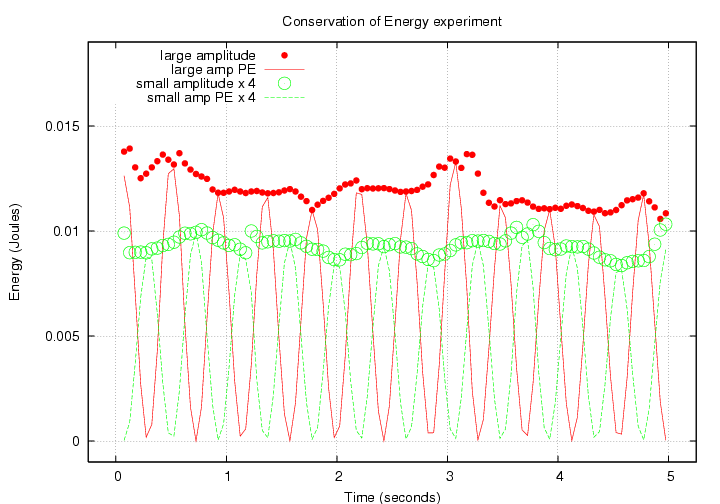
There is clearly some long-period variation in the potential energy (and possibly kinetic energy) due to oscillations of low frequency. I find variations in the total energy of
I tried a small amount of fiddling with the parameters m, k, but could not make the total energy appear more constant in any significant way.
If we look at the total energy of the system over long scales, then there is a clear decay. Here are values for the three situations: no sail (cross-section area 13.2 sq.cm.), small sail (cross-section area 25 sq.cm.), large sail (cross-section area 50 sq.cm.).
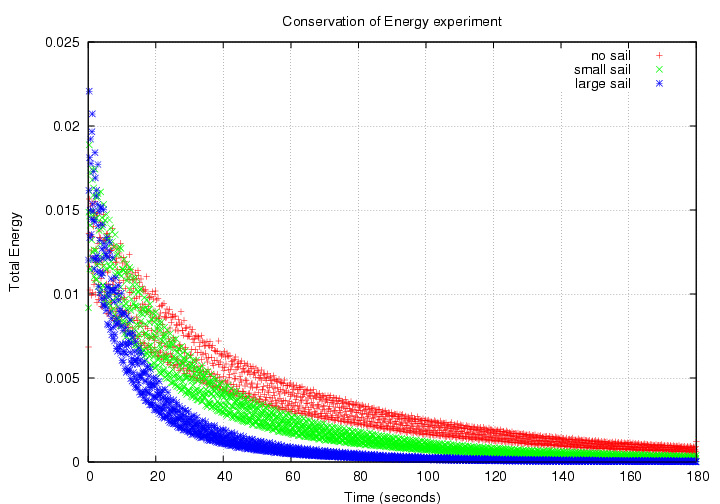
Note that each set of data creates a broad locus, rather than a tight line. It is possible that the lower rate of sampling (10 data per second, rather than 40 per second) has something to do with this. Another possibility is that there were large anharmonic motions at the start of the measurements, since I gave the system a large push to start it and didn't wait long for wiggles to die out. However, I wondered if different values for k and/or m might lead to a tighter locus. I found that
I don't know what that means, if anything.
Finally, I tried to fit each of the decaying total energies with an exponential function. Here they are again, plotted on a logarithmic scale in energy:
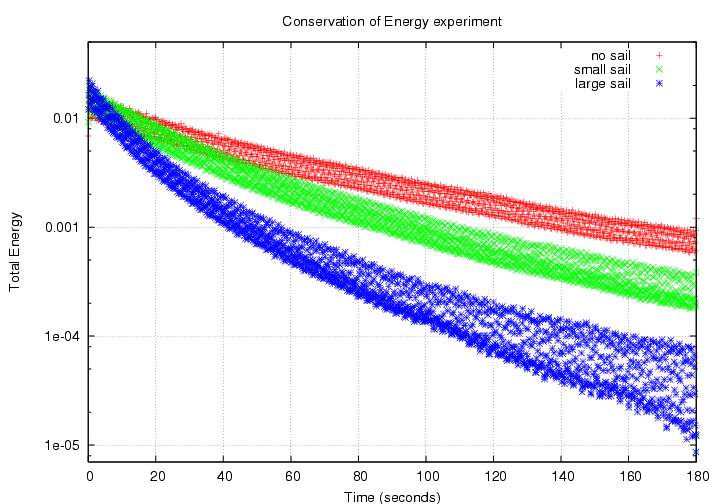
It seems clear that the larger the cross-section area, the more non-linear the locus in this diagram -- and thus, the more non-exponential the energy decay. The best fits I could find to pure exponential decays are shown in the graph below; the placement of the lines is somewhat arbitrary, as was my fitting procedure, but you'll see the general idea:
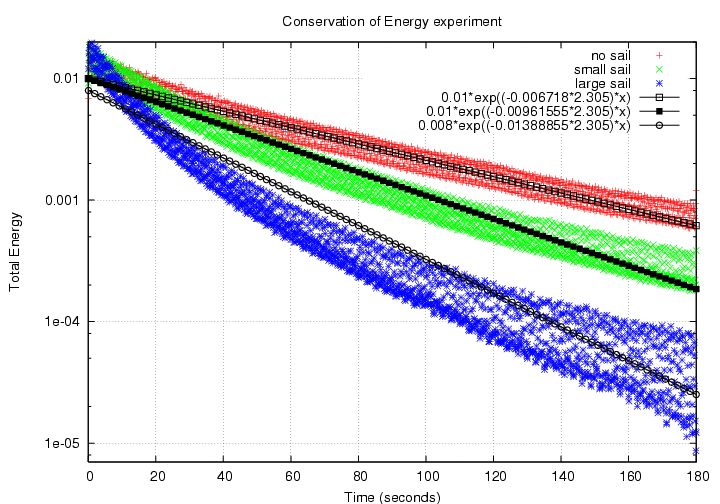
                no sail           small sail        large sail
----------------------------------------------------------------

time const       65 sec              45 sec            31 sec

good fit?        yes                not really          no way
----------------------------------------------------------------
I have created a toy model of the spring experiment, using an ideal spring, a point mass, and simple Heun's method numerical integration. I find that if we ascribe all energy loss to air resistance, then
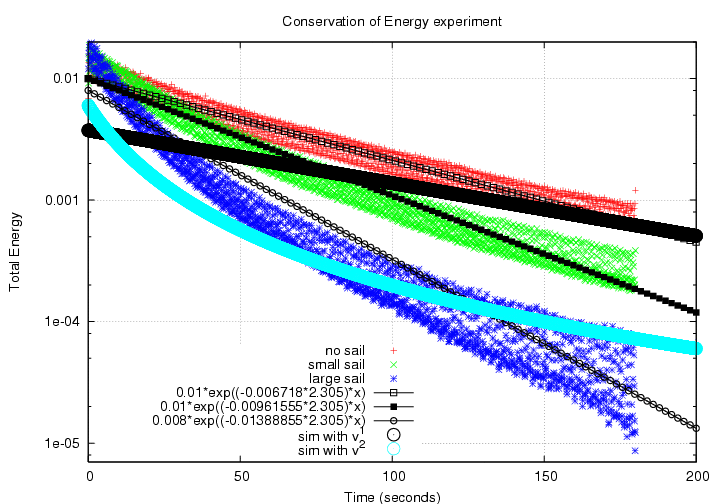
My measurements support the notion that the force of air resistance may indeed be approximately velocity to the first power when the amplitude is small (just 2-3 cm, with speeds approx 0.1 m/sec), but velocity to a higher power when the amplitude is large (perhaps 10-12 cm, with speeds 0.5 m/sec).