 Copyright © Michael Richmond.
This work is licensed under a Creative Commons License.
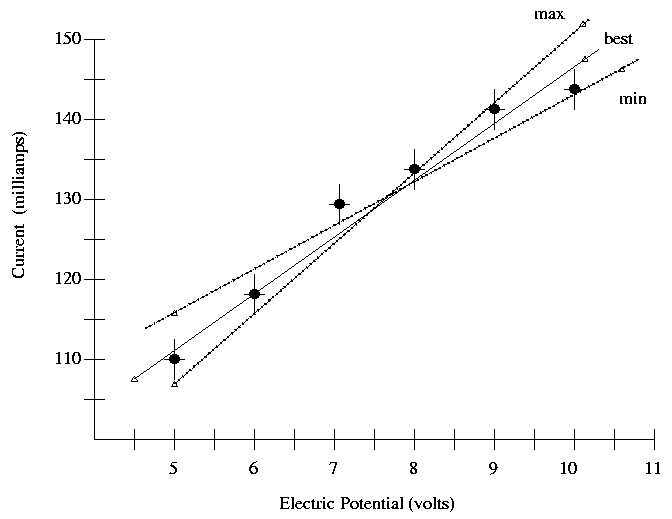
If one has more than a few points on a graph, one should calculate the uncertainty in the slope as follows. In the picture below, the data points are shown by small, filled, black circles; each datum has error bars to indicate the uncertainty in each measurement. It appears that current is measured to +/- 2.5 milliamps, and voltage to about +/- 0.1 volts. The hollow triangles represent points used to calculate slopes. Notice how I picked points near the ends of the lines to calculate the slopes!

In the example above, I find
                            147 mA - 107 mA             mA
        "best" slope   =   ------------------  =  7.27 ----
                             10 V  - 4.5 V               V

                            145 mA - 115 mA             mA
        "min"  slope   =   ------------------  =  5.45 ----
                            10.5 V - 5.0 V               V

                            152 mA - 106 mA             mA
        "max"  slope   =   ------------------  =  9.20 ----
                             10 V  - 5.0 V               V

                                                                mA
        Uncertainty in slope is  0.5 * (9.20 - 5.45) =  1.875  ----
                                                                 V
There are at most two significant digits in the slope, based on the uncertainty. So, I would say the graph shows
                                         mA
             slope  =   7.3  +/-  1.9   ----
	                                  V
Last modified 7/31/2007 by MWR.
 Copyright © Michael Richmond.
This work is licensed under a Creative Commons License.