 Copyright © Michael Richmond.
This work is licensed under a Creative Commons License.
Copyright © Michael Richmond.
This work is licensed under a Creative Commons License.
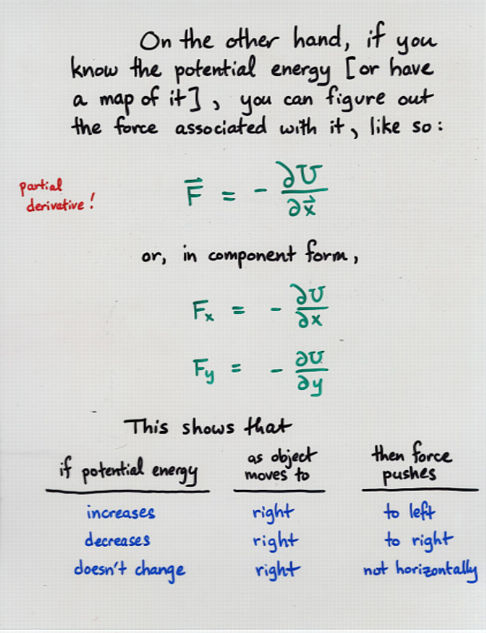
Here's a somewhat more sophisticated map showing potential energy -- electric potential energy in this case -- as a function of position on a table.
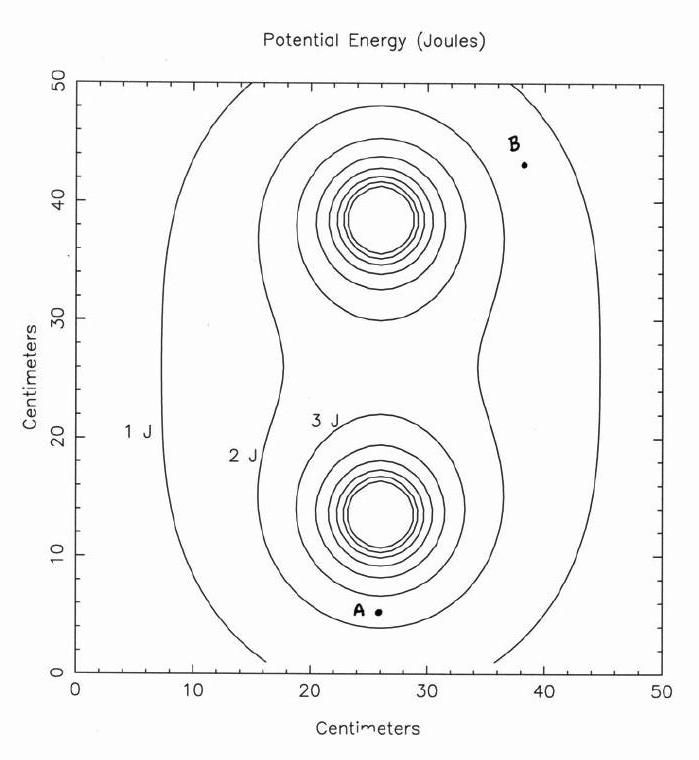
  Q:  What is the change in potential energy
      per centimeter at location A, if one
      moves to the right on this map?  If one moves
      downwards on this map?

  Q:  What is the change in potential energy
      per centimeter at location B, if one moves
      to the right on this map?  If one moves
      downwards on this map?
The graphical way of taking a partial derivative is to make a slice on a map, like this:
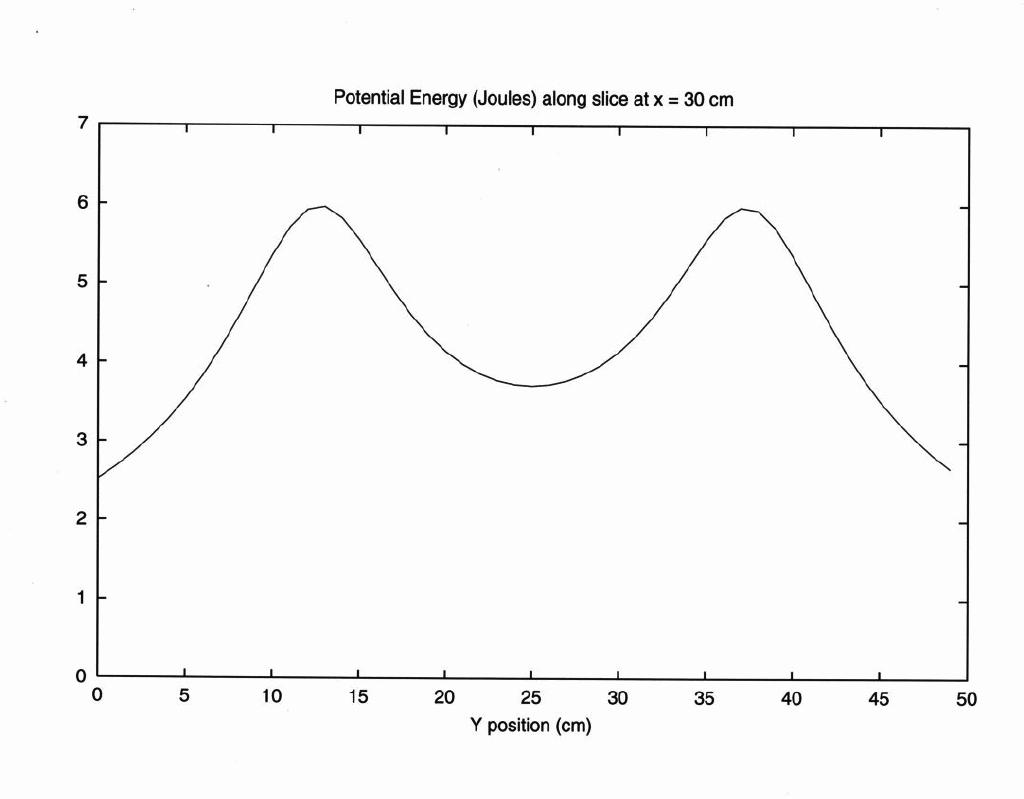
  Q:  What is the size, and direction, of the
      y-component of the force on a particle at
      (y = 20 cm)?


  Q:  At what locations is the y-component of the
      force zero?  At which of these places
      is the y-position stable?
Try your hand at a more realistic example, using a topographic map near the RIT campus.
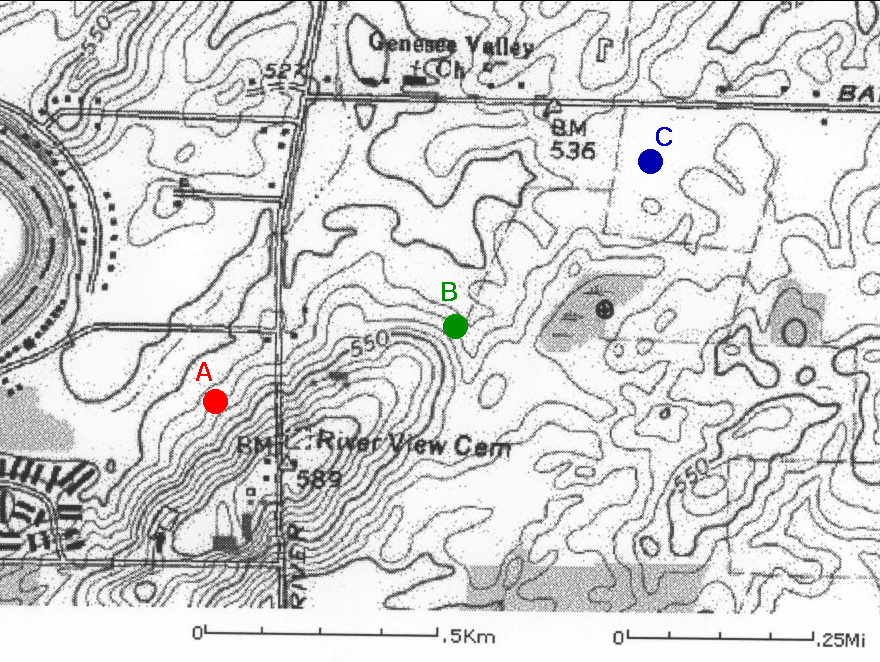
Imagine that the landscape is covered with a perfectly frictionless blanket of snow. You pull a sled of mass M = 20 kg across the snow ....
Copyright © Michael Richmond.
This work is licensed under a Creative Commons License.