Measuring the acceleration of a cart quantitatively
Once again, you'll send a cart sliding up and down a ramp;
but this time, you'll make quantitative measurements of the
position and velocity the cart as it goes.
You have three main tasks:
- find the acceleration as the cart goes UP the ramp
- find the acceleration as the cart goes DOWN the ramp
- determine if the two accelerations are the same to
within the uncertainties
There are some extra jobs for you to do if you manage to
finish these major ones.
Setting up
Arrange a ramp to lean at about theta = 4.5 degrees
from the horizontal.
Fix a white plastic "flag" into a cart
and place it on the track.
Practice gently pushing the cart upwards so that it slides
about two-thirds of the way up the track, stops,
then slides back down.
Set up the laptop computer in your drawer.
Turn it on and log in using your DCE account name.
Take the "LabPro" interface unit, and its power supply,
out of the laptop case. Use the USB cord in the laptop
case to connect the LabPro unit to the computer.
When you have logged into the computer,
open the folder
   My Computer
      Student Shares on 'svphy01' (S:)
         University Physics Students
            Team Physics 311
                Lab Pro
Drag the item cart_up_and_down
from the "LabPro" folder to the desktop.
Double-click on the copy on the desktop.
You should see a screen sor of like this,
but without the data points:
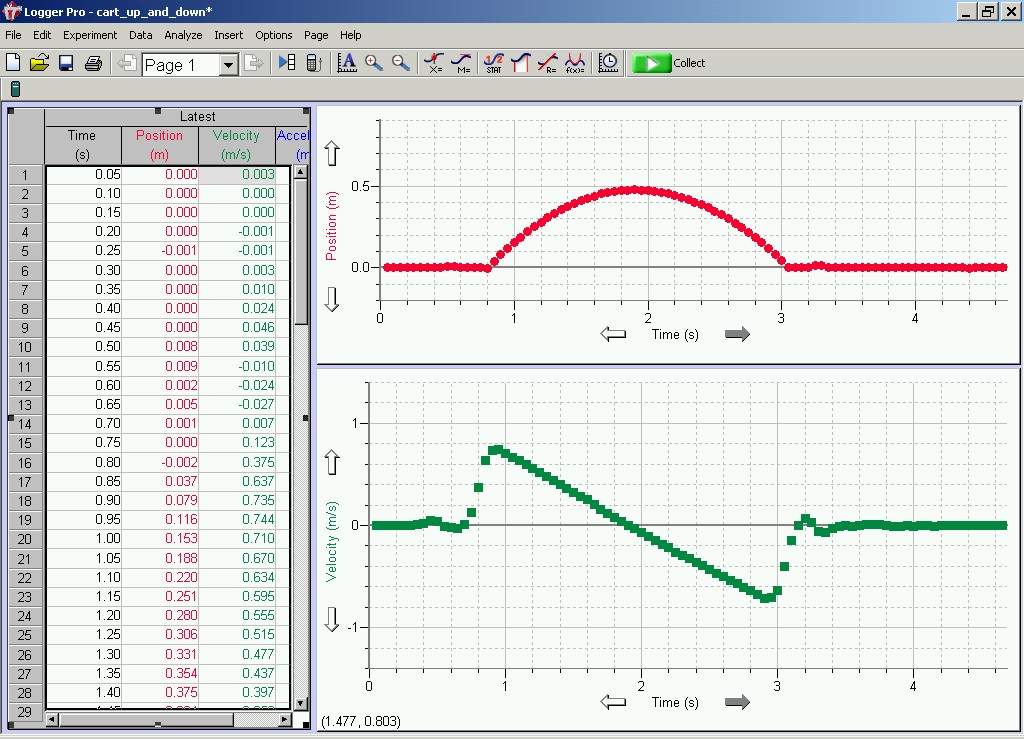
Making the measurements
When you click on the Collect button at the top of the
screen, the motion sensor will start taking 5 seconds of measurements --
you'll hear it clicking as it works.
Practice the following:
- start with cart at bottom of ramp
- start collecting data
- wait a moment, then gently push the cart up the ramp
- let it slide up and then back down
- catch the cart at the bottom before it rolls off the ramp
until you manage to acquire a "good" set of data.
"Good" data will look like that in the example screen above:
the position versus time will make a nice parabolic curve,
and the velocity versus time will have a roughly linear section.
There should be short segments of data before the cart
starts to move and after the cart stops moving.
Ideally, you'll have about 1 second of "cart going up"
and another 1 second of "cart going down".
When you think you have a set of "good" measurements,
ask an instructor to verify that they are fine.
If you can't succeed, ask an instructor for help.
Analysis
First, figure out three special times:
- when the cart starts sliding freely (after your hand releases it)
- when the cart reaches the peak of its travel
- when the cart stops sliding freely (because you catch it)
Use your times to split the motion into two segments:
- when the cart is moving freely up the ramp
- when the cart is moving freely down the ramp
You can use the LoggerPro program to figure out the
change in velocity with respect to time during each of these
two segments.
Click-and-drag on the velocity vs. time graph window
to highlight data in the first segment;
then click on the "Linear Fit" icon near the top
of the screen.
The program will draw the best-fit straight line to the
highlighted data and show you the equation of this
line.
What is the acceleration of the cart as it moves up the ramp?
What is the acceleration of the cart as it moves down the ramp?
Use the File -> Print Graph feature to print out
onto paper a copy of your data with the linear fits.
Now, the real question is -- are these accelerations the same?
LoggerPro will not tell you about the uncertainty in its fits
to the data, unfortunately, so you'll have to do this yourself.
- pick roughly 10 measurements during each time segment
(10 going up, 10 going down)
- make a table showing these 20 measurements
- make one graph for each time segment, showing velocity
on the vertical axis and time on the horizontal axis
- draw two lines on each graph: one showing the "min" slope
which seems consistent with at least some of the
data, and another showing the "max" slope
- calculate the slope of each line
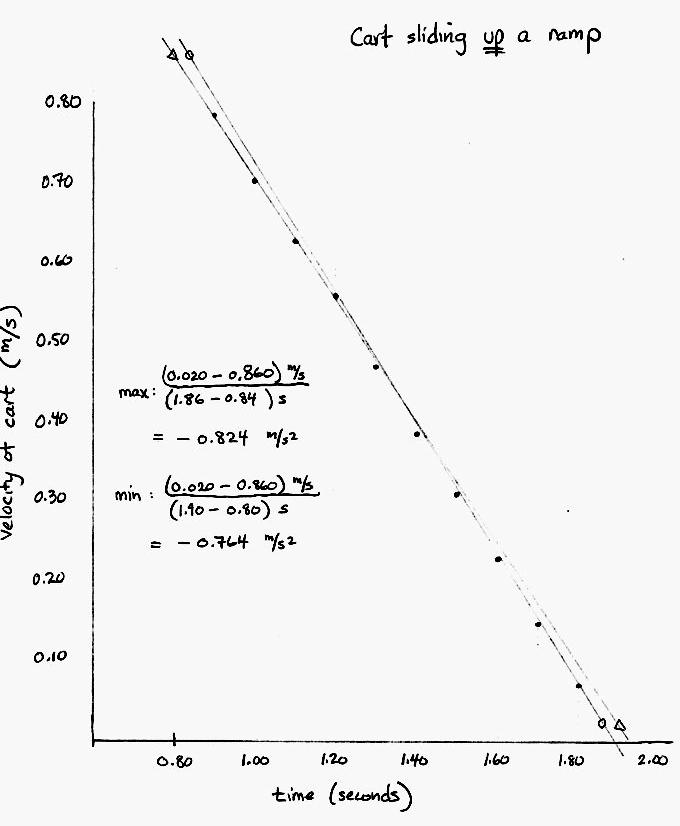
You can use these graphs to estimate the uncertainty in
the acceleration during each time segment.
Is the acceleration of the cart while it slides up the ramp
EXACTLY equal to that of the cart while it slides down the ramp?
Are they the same to within the uncertainty?
If the two accelerations are NOT equal, explain why not.
Use both text and pictures in your explanation.
If you have time ....
Do as many of the following as time permits.
- How do your min and max accelerations compare to the
best-fit accelerations determined by LoggerPro?
- What was the DIRECTION of velocity and acceleration
while the cart was going up the ramp?
- What was the DIRECTION of velocity and acceleration
while the cart was at the very top of its motion?
- What was the DIRECTION of velocity and acceleration
while the cart was going down the ramp?
- What was the velocity of the cart when your hand released it?
- Calculate the average acceleration of the cart.
Assuming that the acceleration of the cart
was constant and had this value,
write an equation which gives the velocity
of the cart
as a function of time-after-release.
- Using this equation with average acceleration,
determine when the cart should have stopped moving.
How close is it to the time that the cart actually
stopped moving?
- Again assuming that the acceleration was constant, with
the average value,
write an equation which gives the position of the
cart as a function of time-after-release.
- Using this equation, where should the cart have been
exactly 1.2 seconds after you released it?
How close it that to the actual position
of the cart at 1.2 seconds after release?
- Using LoggerPro, fit the graph of position versus time with
a quadratic function.
Write down the parameters of this function,
including the units of each one.
How does this function compare to your equation for
position as a function of time?
- In theory, the acceleration of a cart rolling freely along
a ramp tilted at angle theta should have magnitude
g sin(theta).
Is this equal to your measured acceleration(s) within
the experimental uncertainty?
If not, try to explain any difference.