"Courtesy of SOHO/MDI consortium. SOHO is a project of international cooperation between ESA and NASA."
 Copyright © Michael Richmond.
This work is licensed under a Creative Commons License.
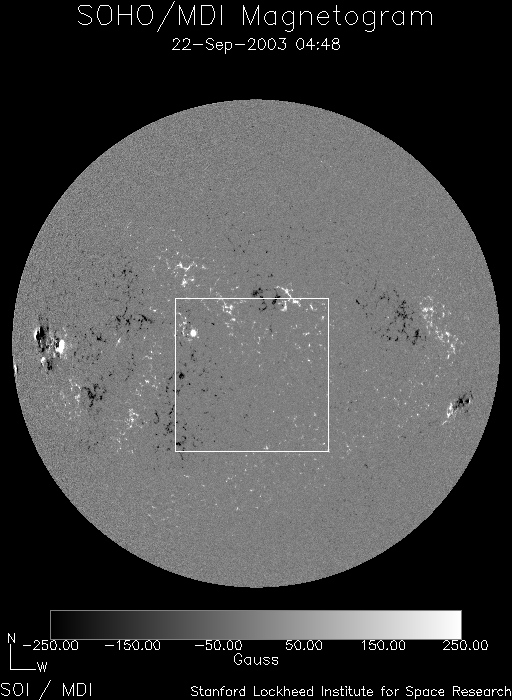
The SOHO spacecraft orbits the Sun, not the Earth. It has many instruments to observe the Sun at different wavelengths and at different levels of detail. One of those instruments is the SOHO Michelson Doppler Imager or MDI for short. MDI can take pictures of the entire disk of the Sun at wavelengths near 6768 Angstroms (in the red portion of the spectrum). Several times a day, it takes magnetograms, which show the magnetic field. White denotes a region in which the magnetic field is positive, black a region in which it is negative, and gray regions where the magnetic field is weak or absent. Sunspots show up very clearly on these images, usually in pairs: one with a positive magnetic field, the other with a negative field.
You can find an archive of recent SOHO MDI magnetograms at
http://mdisas.nascom.nasa.gov/health_mon/gif_mag_index.htmlLook at the column marked "Full Disk Mag".
For example, if I choose the image taken on Sep 22, 2003 at 04:48 UT, I see this:

"Courtesy of SOHO/MDI consortium.
SOHO is a project of international cooperation between ESA and NASA."
Your job: using this archive of images, measure the period of rotation of the photosphere. You could do it like this:
There's one tricky part to this sort of analysis. Your graph in step 5 will not show a simple linear relationship between a sunspot's horizontal position and time. Perhaps you can figure out what sort of a relationship this is .... but don't worry about too much.
How does your value compare the value(s) quoted in your textbook?
Submit all your work, including all graphs and several representative pictures. Explain how you derived your final answer. What is a reasonable uncertainty?
 Copyright © Michael Richmond.
This work is licensed under a Creative Commons License.