 Copyright © Michael Richmond.
This work is licensed under a Creative Commons License.
Estimate the age of the Gemstone Cluster
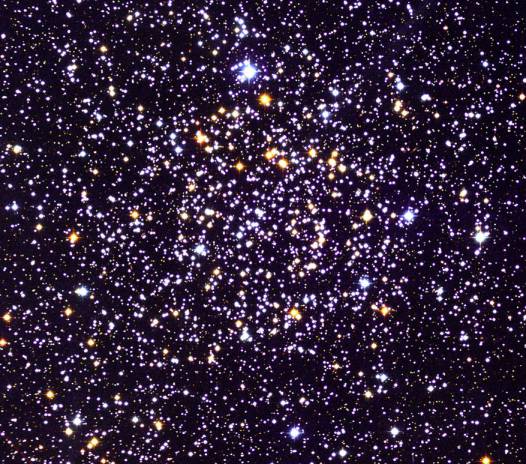
Astronomers find a beautiful open cluster of stars in
the midst of the Milky Way. It contains a mixture of
hot, whitish stars and cooler, orange stars.
One romantic scientist sees in it a treasure of diamonds
and topazes, and gives it the name "The Gemstone Cluster."

Your job is to estimate the properties of this cluster using
its HR diagram as a guide.
Other astronomers have already measured the B and V
magnitudes of stars in the area, all the way
down to stars of magnitude 16.5 or so (about as faint as
we can measure well with our telescopes here at RIT).
The datafile has one line per star, like this:
  17.66    16.82
  17.38    16.45
  17.95    16.97
The first column is the star's B-band magnitude, and the second
column is the star's V-band magnitude.
You can calculate the (B-V) color of each star
from these numbers.
By plotting the V-band magnitude on the vertical axis,
and (B-V) color on the horizontal axis, you can
make your own HR diagram.
- Make an HR diagram of the cluster, with a horizontal axis
running from -0.2 to 2.2 and a vertical axis running
from 17 to 10. Be sure to label your axes.
- Print out onto paper your HR diagram.
The diagram should fill most of the paper -- I don't
want to see all the data crammed into a tiny region
at the very center.
- Mark in pen or pencil on the paper
- the main sequence
- the turnoff point
- the red giant branch
Warning: you may see some points which lie far from
the places you might expect, or scatter in all directions.
Those are stars which aren't really members of the cluster,
but just happen to lie in the same general direction,
either in front of or behind the cluster. Try to
ignore them and pay attention only to the main features
on your graph.
- What is the (B-V) color at the main-sequence turnoff point?
What is the V-band magnitude at the main-sequence turnoff point?
- Get data on models of stellar evolution from one of the two following
sources:
- Use Lionel Siess' stellar model WWW form
http://www-laog.obs.ujf-grenoble.fr/activites/starevol/FILES/iso.html
to create models of an HR diagram for stars of metallicity z=0.03
and ages ranging from 50 million (5.0d7) to 5 billion (5.0d9) years.
For each age,
- save the output data table
- delete all entries from the table which have the "flag" field set to 1
(because those stars have died)
Or, if the Siess web site is down,
- Take data from these files, which are based on models
made by
the Padua stellar evolution group.
The data were published in
B. Salasnich, L. Girardi, A. Weiss, C. Chiosi, 2000, A&A 361, 1023.
- make an HR diagram for models of
each age, using the "B-V" column on the horizontal
axis and the "Mv" column on the vertical axis;
you don't need to print out this diagram
- note the (B-V) color and the "Mv" magnitude of the main-sequence
turnoff point in this diagram; be sure to write these down
together with the age in a neat table
- based on the (B-V) color of the turnoff point, what is
the age of the Gemstone Cluster?
How massive are the stars which are just running out of
hydrogen in their cores?
If you want to show your brilliance, use the difference between
the observed (apparent) V-band magnitude of the turnoff point and the
theoretical (absolute) V-band magnitude of the turnoff point
to estimate the distance modulus and the distance to the
cluster.
You might read
the manual to the CLEA Pleiades exercise.
 Copyright © Michael Richmond.
This work is licensed under a Creative Commons License.

 Copyright © Michael Richmond.
This work is licensed under a Creative Commons License.

 Copyright © Michael Richmond.
This work is licensed under a Creative Commons License.