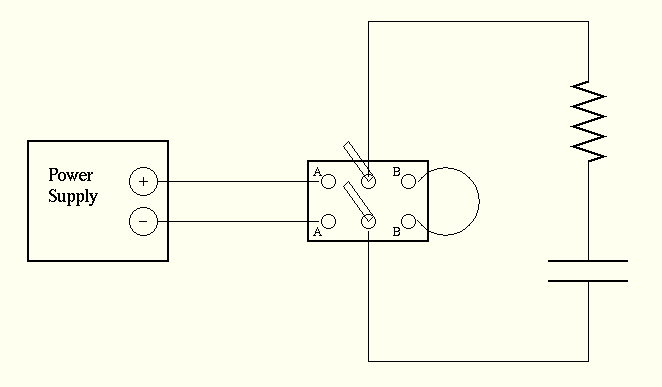
Figure 1
You will study the dynamic behavior of a series RC circuit by measuring the voltage across a capacitor as it charges and discharges. Graphical analysis of the data will reveal the time constant of the circuit, and the unknown resistances.
First, to see with your own eyes how RC circuits behave. Second, to give you some experience with exponential functions.
Capacitors: Cutnell and Johnson 19.5
RC circuits: Cutnell and Johnson 20.13
Exponential functions: Cutnell and Johnson Appendix D
Examine the circuit diagram shown above in Figure 1. When the three-way switch is closed to the left, it completes a circuit in which current may flow from the power supply, through the resistor, and pile up on one plate of the capacitor; a corresponding amount of charge may be ripped from the other plate of the capacitor and flow back into the power supply. As time goes by, a equal and opposite charges +q and -q will build up on the plates of the capacitor.
Kirchoff's Loop Rule states that the potential drop across the resistance, I*R, plus the potential drop across capacitance, q/C, must equal the voltage V provided by the power supply; that is,
V = I*R + q/C
Since the current is the rate at which charges flow though the
circuit,
                dq
           I = ----
                dt
this expression represents a differential equation in q.
               dq       q
           V = -- R  + ---
               dt       C
The solution yields the charge on the capacitor as a function of
time; specifically,
                    -t/T
   q  = Q    { 1 - e     }        Q    = C*V,   T = R*C
         max                       max
Using this result, one can determine the expression for the voltage across the plates of the capacitor as a function of time; specifically,
                    -t/T
   V  = V    { 1 - e     }                      T = R*C
         max
where Vmax is the voltage given by the power supply.
This relation indicates that the voltage across the capacitor will start at 0 and increase quickly at first, then more slowly. It will approach the value Vmax but never quite reach it. Over a time interval of one time constant T = R*C, the difference between the voltage and Vmax is decreased by 63% = (1 - 1/e).
If you can fit an exponential curve of form
                    -t/T
   V  = V    { 1 - e     }
         max
to the data values for voltage as a function of time,
you can determine the time constant.
If you know the time constant and the capacitance C,
you can figure out what the resistance R must be.
Fitting exponential curves directly is difficult. It's easier to modify the equation by doing a little algebra and then taking the logarithm of both sides:
        V                 -t/T
     -------      =  1 - e
       Vmax


      V                 -t/T
    -----  -  1   =   -e
     Vmax

              V         -t/T
      1  -  ----- =    e
             Vmax

    (      V    )        1
log ( 1 - ----- ) =  -  ---  * t
    (      Vmax )        T
If you can measure voltage V and time t
as the circuit charges, you should find a simple,
linear relationship:
plotting log(1 - V/Vmax) on the y-axis and t on the x-axis
should yield a straight line with slope -1/T.
So the time constant is
                1
      T   =  - -----
               slope
On the other hand, if you throw the switch to the right, then you remove the power supply from the circuit, and complete a short circuit running in a circle around the resistor and capacitor. This will discharge the capacitor: the charge which was stored on its plates will now run back together, bringing the capacitor back to a neutral state. In this case, the voltage across the capacitor ought to decrease:
               -t/T
   V  = V     e                                 T = R*C
         max
Once again, to find the time constant T, it helps to take the logarithm of both sides:
              Vmax
  log V  =  - ----- * t
                T
Plotting log(V) on the y-axis, and t on the x-axis,
you should find a straight line going down and to the right.
The slope of this line is -Vmax/T, so if you know Vmax,
you can calculate the time constant:
               Vmax
     T   =   - -----
               slope
It ought to agree with the time constant you measured
as the capacitor was charged.
You should complete all the following steps by the end of your class period. They are explained in detail below.
Be sure to answer all Questions in your lab report.
First, you must set the power supply to provide a constant voltage of about 3 volts.
Next, you need to set up the Logger Pro program to read data from the voltage sensor.
Now build the circuit shown in Figure 1. You should have a plastic box, inside of which is a Y-shaped section of wire with a capacitor and two branches with resistors:
For this experiment, connect the branch of the wire containing one resistor, as well as the branch containing the capacitor.
Leave the switch in its "Open" position, with the handle straight up, so that there is no complete circuit.
Connect the voltage sensors to your circuit. Make sure that the red sensor is attached to the positive side of the capacitor (marked with a little "+" plus sign).
Charge the capacitor by throwing the switch to the left; this will build up a charge on the capacitor's plates, until the voltage across the plates matches the voltage provided by the power supply. Wait about one minute for this to occur.
Okay, you're ready to make some measurements!
You should see voltage decrease from an initial value of about 3 volts down to zero.
Question: why does the voltage across the capacitor decrease as soon as you throw the switch?
Print the graph showing the decrease of voltage versus time as the circuit discharges.
It would be wise to save your data at this point. Please save all data to a floppy disk, rather than the hard disk of the computer.
Make three simple sketches of the circuit which is completed when you throw the three-way switch to the right. Each should include the power supply, resistor, and capacitor. Call one sketch the "Before" version -- show on it the charge on the plates of the capacitor, and size of the voltage across the capacitor, before you throw the switch. Call one sketch the "During" version -- show what happens as the current flows and the voltage changes. Call the last sketch the "After" version -- show on it the charge on the plates of the capacitor, and the size of the voltage across the capacitor, at the end of the charging process. Indicate on your drawings
You must use your data to figure out the time constant of the circuit. If you could analyze exponential curves in your head, the shape of the curve of voltage versus time would tell you the time constant. But that's pretty difficult -- humans are better at dealing with straight lines. Fortunately, there is a simple connection between the voltage and time which does involve a straight line. See the explanation in the "Theory" section of this manual of the connection between the time constant T and the logarithm of the voltage log(V).
What you need to do is
Question: What is the time constant of your circuit, based on the data taken while charging the capacitor? Be sure to include the units of the time constant.
You can check your value of T by comparing it to a value derived from the curve of voltage versus time. The Logger Pro program can fit mathematical functions to curved lines, as well as straight ones. Adjust the windows on your computer screen so that the graph of voltage versus time is shown.
A * { exp(-C*x) } + B
Question: How well does the time constant you determined from your hand-drawn graph agree with the time constant determined by the computer?
Now, prepare to charge the capacitor. Before you can take data, you must
You should see voltage now increase from an initial value of zero to a final value which should be about 3 volts.
Print out a copy of the graph showing the increase of voltage versus time as the capacitor charges. Compare this graph with the graph showing voltage as the capacitor discharges.
It would be wise to save your data at this point. Please save all data to a DIFFERENT file(s) on the floppy disk -- don't overwrite your first results!
Question: Describe the similarities and differences of the two curves.
Make another three sketches of the circuit which is completed when you throw the three-way switch to the left. Again, show a "Before", a "During", and an "After" sketch. Each should include the resistor, capacitor, and short-circuit wire. Indicate on your drawing
Now try to determine the time constant of your circuit from the voltage during the charge. As the capacitor charges, there's a somewhat more complicated relationship between voltage and time; see the explanation in the "Theory" section of this manual. You could make a table of selected values of time t and the quantity log(1 - V/Vmax), plot them by hand, find the slope, and then figure out the time constant from the slope, just as you did before.
Extra Credit: Determine the time constant of the charging circuit from a hand-made graph.
But it's also possible to let the computer do the work.
A * { 1 - exp(-C*x) } + B
Question: What is the time constant of the circuit as it charges, based on the computer's fitted parameter value? Be sure to include units.
Question: How do the time constants of the circuit as it charges and discharges compare?
If you want to impress your instructor, and you have time, you might make two (or three) sets of measurements while charging the capacitor, and two (or three) while discharging. Comparing the time constants from each run might give you some idea for the uncertainty of the value from a single run.
At this point, you should know the time constant T = R*C for the circuit with a single resistor. You can read the capacitance from the surface of the capacitor. Do so.
Question: What is the capacitance of the capacitor?
Question: Calculate the resistance of the single resistor.
Now check your calculation: throw the three-way switch to its middle position, breaking the discharge circuit. Then use the digital Fluke multimeter as an ohm-meter to measure the resistance across the single resistor.
Question: How close was your calculation to the actual resistance of the single resistor?
Last modified Sep 9, 1999 by MWR