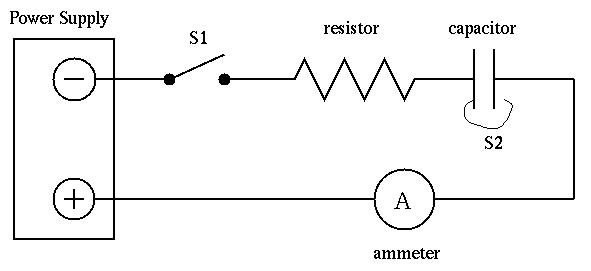
Figure 1. Series RC Circuit
The dynamic behavior of a series RC circuit will be studied by applying a constant emf to a resistor and an initially uncharged capacitor. Measurements of the circuit current as a function of time will provide the data for a graphical demonstration of the exponential nature of this behavior.
First, to gain an understanding of exponential behavior. Second, to learn how (and when) to use semi-log graph paper. Third, to verify that a capacitor really does behave as described in your textbook.
Capacitors: Cutnell and Johnson 19.5
RC circuits: Cutnell and Johnson 20.13
Examine the circuit diagram shown in Figure 1. When the switch S1 is closed to complete the series circuit composed of an emf, the resistance R, and capacitance C (switch S2 open), a current will pass through the resistance and charge will be deposited on the plates of the capacitor. By conservation of energy, the potential drop across the resistance, IR, plus the potential drop across capacitance, q/C, must equal the voltage V; that is,
V = IR + q/C
Since the current is the rate at which charges flow though the
circuit,
                dq
           I = ----
                dt
this expression represents a differential equation in q.
               dq       q
         V   = -- R  + ---
               dt       C
The solution yields the charge on the capacitor as a function of
time; specifically,
                 -t/T
q  = Q    { 1 - e     }        Q    = CV        T = RC
      max                       max
Using this result, one can determine the expression for the current flowing through the circuit as a function of time; specifically,
        -t/T               V
I = Io e     ,      Io = ----- ,      T = RC
                           R
where Io is the peak current, at time t = 0.
This relation indicates that the current will decrease exponentially
as time increases.
For a time interval of magnitude RC,
the current value becomes 1/e times the initial value at the
start of the interval. This specific time interval is called the
time constant T of the circuit and can be used to determine either
R or C if the other is known.
In this experiment you will demonstrate the exponential time dependence of the current.
Figure 1 shows the circuit to be studied. S2 represents a switch for by-passing the capacitance. Actually, it is a wire with one end fixed to one plate of the capacitance and a free end which can be attached to the other plate.
Figure 1. Series RC Circuit
Use the Simpson analog meter as the ammeter.
The meter should have been set up for you already, but in just in case it needs to be re-set:If all is set up correctly, and the power supply is set to its maximum voltage (about 30 Volts), then the Simpson meter ought to read about 35 microamps.
- Set the left-hand knob on the meter to "+DC"
- Set the central knob on the meter to "25V 50uA"
- Connect the positive lead to the terminal in the upper-right portion of the meter, labelled "+50uA 250mV"
- Connect the negative lead to the terminal in the lower-left portion of the meter, labelled "- common"
- Read the middle of the 3 black scales on the meter's face: it shows the current running through the circuit in the range 0 to 50 microamps
Describe the behavior of electrons in the circuit when the switch S1 is closed, and switch S2 is open. Is the capacitor charging or discharging? Which side of the plate attracts electrons? Describe what happens if switch S2 is now closed.
With the circuit set up as shown, close both switches and adjust the power supply to provide as large an initial current (Io) as possible. Measure this current with the ammeter. Use the voltmeter to measure the voltage (V) being supplied by the power source. It is important to keep this value constant for the duration of the experiment, so don't fiddle with the knobs on the power supply after you've set up the circuit.
Use these measurements of the initial current and voltage to calculate the resistance R of the resistor, via
             V
        R = ----
             Io
Now open switch S2 and roughly determine the time constant of the circuit. This is done by measuring the time for the current to decrease to 0.4 (1/e = .368) of the initial value. If the value found is not in the range of 10 - 20 seconds, see your instructor because you have a defective circuit. This is a first guess at the time constant.
It is possible to make a much more accurate measurement. Pick a set of 5 values of the current, spaced roughly equally and covering the range from about 70 percent of the initial value to about 10 percent of the initial value (for example: 70%, 50%, 30%, 20%, 10%). Call these currents I1, I2, I3, I4 and I5. The initial current may be called Io.
As the capacitor discharges, the current drops. Measure the time it takes for the current to drop from its initial value, Io, to each one of these values. Make at least 3 runs for each value. What's a good way to open switch S2 and start the timer simultaneously?
Calculate the average time taken for the current to drop to each of the 5 values you chose.
Plot the current I versus the time t on Cartesian paper. Does your graph show a linear relationship between current and time? Why or why not? Locate on the current axis the current corresponding to
                          -1
          0.368 Io =  Io e
Draw a dotted line horizontally to intersect your curve and draw a dotted line vertically down until it intersects the time axis. Record this time. It is (we hope) a more accurate value of the time constant T than you found earlier.
Plot the current I versus time t on two-cycle semi-log graph paper. Semi-log paper has the very convenient property that if one plots on it a relationship of the form
                x
           y = e
the data points will form a straight line, with a slope x.
Does your graph show
the expected decreasing exponential
dependence of current with increasing time? Calculate the slope
of the line:
             ln (I2 - I1)
     slope = ------------
              (t2 - t1)
where (t1, I1) and (t2, I2) are the coordinates of any two points
on the "best" straight line. Using
the slope, calculate the time constant T.
This should be even more accurate.
Using the measured value of R and the value of C stamped on the capacitor, calculate the time constant T.
Finally, compare the four values of T and discuss any differences which occur.