In this experiment you will study the operation of a diffraction grating spectrometer. After calibrating the instrument you will measure the wavelengths of the first four lines of the Balmer se- ries of hydrogen and compare your results to the predictions of Bohr model.
To see how one can measure, quantitatively, the wavelength of a beam of light, using a simple instrument on a table top.
Bohr model of the atom: C&J 30.3
Line spectra: C&J 30.2
Diffraction: C&J 17.2, 17.3, 27.5, 27.7. See Figures 27.37 and 27.38
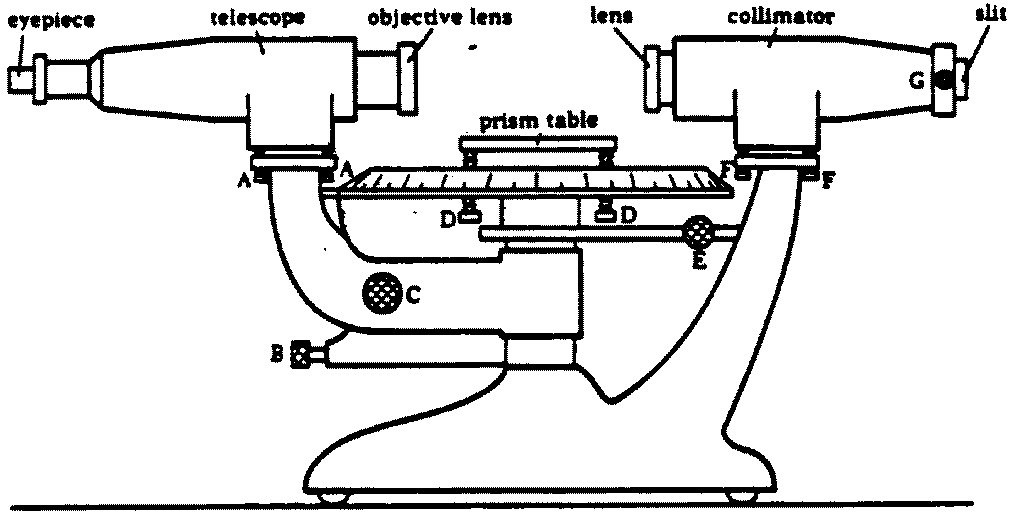
The essential parts of the spectrometer are shown in Figure 1.
A sketch of a spectrometer showing the various adjustments A; Screws to level or align the telescope B; Knob to fix the position of the telescope. This knob must always be loosened before moving the telescope by hand and locked only to make fine adjustments with knob C. C, Fine adjustment knob. S, Screws to level or raise the prism table. E, Knob to fix the position of the graduated disc and prism table. When readings are taken with the telescope, this knob must be in the locked position. F, Screws to align the collimator. G, Knob for adjusting the slit width. The slit should be wide enough to allow a sufficient amount of light to pass through but as narrow as possible to allow accurate measurement.
The spectrometer has around its base a scale graduated in degrees, with a least count of half a degree. There is also a vernier scale above the main one, which runs from 0 to 30, subdivided into smaller units; this vernier scale measures arcminutes. Recall that there are 60 arcminutes in a degree.
In order to take a reading of the angle at which the spectrometer is set, do the following:
Example: a student find that the value 156.5 on the main scale is closest to the "0" on the vernier (without going past the "0"). She then looks at the vernier and chooses 17 as the best match on that scale. The total angle is
angle = 156.5 degrees + (17/60) degrees = 156.78 degrees.
The diffraction grating is discussed in detail in your text. Despite its great simplicity, the diffraction grating spectrometer is a very precise measuring instrument, and it is still the most commonly used device for measuring the wavelengths of spectral lines.
If parallel light of wavelength w is incident normally on a grating, then the angle theta at which the intensity of the transmitted light is a maximum is given by the grating equation
d sin(theta) = n w, n = 1,2,3... (1)
In the equation d is the spacing between the slits of the grating, and the integer n is the order number. The grating spectrometer permits very precise determination of the angle theta. If the grating spacing d is known, then w can be calculated.
Historically, the diffraction grating spectrometer was in use long before the line spectra emitted by atoms were understood. In 1885, Balmer found a simple mathematical expression which described some of the wavelengths of the lines observed to be emitted by hydrogen. There was no explanation of why those particular wavelengths were emitted until the advent of the Bohr model in 1913.
The wavelengths of the Balmer series are given accurately by the simple formula
              1     1
     1/w = R(--- - ---),  m = 3,4,5...                       (2)
             2^2   m^2
The symbol R is called the Rydberg constant and has the value
                   7    -1
     R = 1.097 x 10    m                                     (3)
Note: Usually, the violet line is to dim to be seen. Sometimes there is a fuzzy green line in this spectrum; do not measure it. If you cannot see two yellow lines, your slit is probably too wide; adjust the width to make the slit narrower.
             DIFFRACTION GRATING SPECTROMETER


Date__________                       Name_______________________________
                                     Lab Partner(s)________________________


Measuring Devices              I.D. No.      Range               Least Count
==============================================================================

Angle Scale on Spectrometer


                               Data Table

1.  Mercury Spectrum

------------------------------------------------------------------------------
color   wavelength   theta      theta       theta     sin(theta)        d
                          Left       Right       avg           avg
        (Angstroms)  (degrees)  (degrees)   (degrees)               (Angstroms)
______________________________________________________________________________

Violet       4047
______________________________________________________________________________

Blue-violet  4358
______________________________________________________________________________

Green        5461
______________________________________________________________________________

Yellow (1)   5770
______________________________________________________________________________

Yellow (2)   5790
______________________________________________________________________________


   Average Value of d = _______________


2. Hydrogen Spectrum

------------------------------------------------------------------------------
color       order  theta      theta       theta     sin(theta)      wavelength
              n         Left       Right       avg           avg
                   (degrees)  (degrees)   (degrees)                (Angstroms)
______________________________________________________________________________

Violet        1
______________________________________________________________________________

Blue-violet   1
______________________________________________________________________________

Blue-green    1
______________________________________________________________________________

Red           1
______________________________________________________________________________

Violet        2
______________________________________________________________________________

Blue-violet   2
______________________________________________________________________________

Blue-green    2
______________________________________________________________________________

Red           2
______________________________________________________________________________


  For comparison, the actual wavelengths of Hydrogen lines are:

        Violet:       4102   Angstroms
        Blue-violet:  4340   Angstroms
        Blue-green:   4861   Angstroms
        Red:          6563   Angstroms

  How close were your measurments in each case?