CURRENT - VOLTAGE RELATIONSHIPS
PURPOSE:
The current - voltage relationships for three different
electrical devices will be determined experimentally.
WHAT'S THE POINT?
To show that some materials do not obey Ohm's
Law in a simple fashion; that is, some materials possess resistance
which changes under different circumstances.
BACKGROUND READING:
Cutnell and Johnson 20.2, 20.3. Note Equation 20.2.
THEORY:
A material can be characterized electrically by measuring
the current (I) that flows through the material as a result
of an electric potential difference (V) applied across it. This
information is most readily displayed in an IV
curve (called the
characteristic curve) which is a graph of the resulting current
flow versus applied potential difference. A material is said to
be "Ohmic", or to obey Ohm's law, if the ratio of the voltage V
to the current I is a constant.
This constant is called the resistance R
and has the units of volts / amperes, or ohms.
Graphically, an ohmic device is characterized by a linear IV
curve. Most metals are ohmic provided the temperature is not allowed
to vary appreciably. For materials that are nonohmic, the
current - voltage relation can be a complicated function of the
voltage. With some nonlinear IV curves, the definition of
resistance given above is of little use in allowing a determination of
the current for given potential difference. A more useful quantity
is the dynamic resistance
R = deltaV / deltaI
which is defined by the small change in current (deltaI)
resulting from a small change in the potential difference (deltaV).
Graphically, this is the reciprocal
of the slope of a tangent line drawn to the characteristic curve.
PROCEDURE:
During the course of the experiment, do not allow
the current to exceed the range of the ammeter (500mA). Before
you construct each circuit, turn the coarse and fine adjustment
knobs on the power supply to their minimum positions, fully counterclockwise.
- Ohmic Resistor
Hook up the circuit shown in Figure 1 without connecting the power
source until checked by the instructor. Do not put more than
two connecting leads on the same terminal unless really necessary.
Have the circuit checked by the instructor before you
start to make measurements.
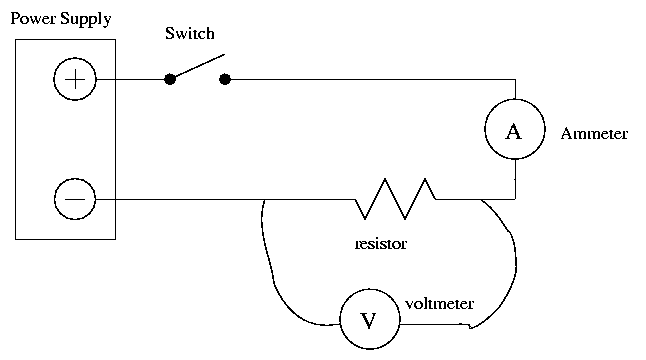
Figure 1.
The resistor provided to you has a value of 5 ohms.
You must vary and record the voltage
in 1/2 volt steps from 0 to 3 volts. For each value, measure and
record the current. Be sure that both meters are read to the
maximum number of significant figures.
Plot current versus voltage
and from the slope determine the resistance. Calculate the
percent difference from the nominal value of 5 ohms.
Note: The slope
is not equal to the resistance if the graph is plotted as instructed.
- Semiconductor Diode
Remove the resistor and substitute the silicon diode
(see Figure 2). Connect the diode so that its end with the silver
band is closest to the negative terminal of the power supply.
In this case it is important that the voltage does not exceed 1.2
volts. When you begin this part, be sure that the voltage is at
0 and proceed in steps of 0.1 volt, using the "fine" adjustment
knob only. If the diode is biased in the forward direction you
should obtain a measurable current at about 0.6 volt. From this
value proceed in steps of 0.1 volt until you reach 500mA or 1.2
volts, whichever comes first. If the diode is biased in the reverse
direction you will not obtain a measurable value for the
current in the range from 0 to 1.2 volts. DO NOT APPLY VOLTAGES
GREATER THAN 1.2 VOLTS for either biased condition.
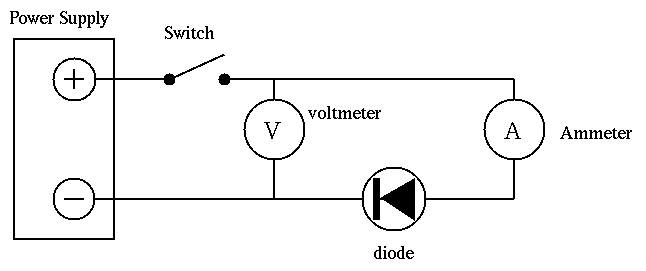
Figure 2.
Plot the current versus the voltage for the diode in the forward
bias situation. Determine the dynamic resistance
of the diode at V = 0.8 volts.
How does the resistance vary
as the voltage applied to the diode increases?
- Light Bulb
Referring to Figure 1, replace the 0-3 volt voltmeter with a 0-10
volt voltmeter and replace the resistor with a standard
light bulb and obtain current - voltage data for voltages from 0
to 8 volts in increments of 0.5 volts. Is the resistance of the bulb
constant over this voltage range?
Plot the current versus voltage.
Calculate the dynamic resistance of the light bulb at
5 volts.
Since the
filament of the bulb is metallic, it might be expected to behave
as an ohmic resistor. Clearly the shape of your IV curve is inconsistent
with this notion.
Why does the resistance of the light bulb's filament change
with voltage?
Largest source of experimental error
This week's experiment is very simple:
there are only two instruments from which you read values.
Which of these is responsible for most of your
experimental uncertainty?
Consider your measurements of the light bulb.
You varied voltage between 0 and 8 volts,
so a typical setting is halfway between: at V = 4 volts.
Fill in the table below to determine the percentage
uncertainty in the readings from each instrument
at this setting.
                                      Voltmeter                Ammeter
----------------------------------------------------------------------------

smallest division
 (= least count)

reading at V = 4 volts


raw uncertainty
 (i.e. the +/- value)


fractional uncertainty
 (raw uncertainty/reading)


percent uncertainty
 100*(fractional uncertainty)

----------------------------------------------------------------------------
If you had enough money to replace just one of these instruments
with a more precise version,
which should you choose to improve
your experiment the most?
Optional
If you have time -- pick a fourth item from your pocket or bookbag,
and try to measure its resistance.
Coins and pencil leads are good ones to try.
Please show your item to the instructor before you place it into a circuit.
Last modified 11/12/2003 by MWR.