 Copyright © Michael Richmond.
This work is licensed under a Creative Commons License.
Copyright © Michael Richmond.
This work is licensed under a Creative Commons License.
There are many models for the structure and evolution of the universe. How can we check these models against reality? We need to perform large surveys of the universe, collecting data on the positions and redshifts (and, thus, indirectly, the distances) to thousands or millions of galaxies. There are several large collaborative efforts at the current time. Let's look at one, called the Sloan Digital Sky Survey.
The Sloan Digital Sky Survey (or SDSS for short) has ambitious goals. There are two main observational tasks:
The SDSS telescopes are located at Apache Point, about 9000 feet above sea level in the San Francisco range of New Mexico:
The telescopes sit at the western edge of the mountain top, so that the prevailing winds will blow freely past them, with little turbulence.
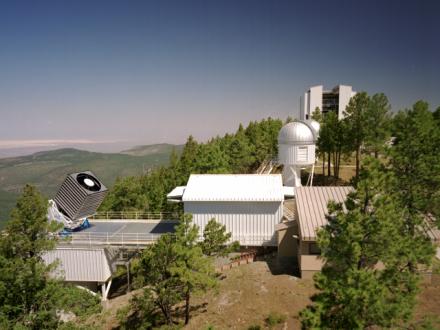
Image courtesy of the Sloan Digital Sky Survey
Picture of Apache Point, facing north.
The west winds, coming from the left,
sweep past the SDSS telescopes before
striking local surface features.
There are two telescopes

Image courtesy of the Sloan Digital Sky Survey
The Big Telescope lives out on a pad which projects
beyond the cliff's edge, so that the air blowing past
it is free of ground-induced turbulence.
Image courtesy of the Sloan Digital Sky Survey
This wierd-looking baffle system is designed to let
air flow through the telescope, while blocking light
from reaching the instruments.
Image courtesy of the Sloan Digital Sky Survey
The PT is perched high above the ground in order to
avoid turbulence, due to the wind striking the ground,
and due to thermal currents from the warm earth after
sunset.
Image courtesy of the Sloan Digital Sky Survey
This telescope used to sit on top of the Physics building
at Johns Hopkins. It now measures the relative brightness
of a network of bright standard stars and fainter objects
detected by the Big Telescope.
The first job is to make a map of about one quarter of the sky -- that's about 10,000 square degrees. Most big astronomical telescopes have very small fields of view. For example, consider the Moon: the Hubble Space Telescope can (with some effort) take pictures of the moon, but its instruments can see only a tiny portion of the Moon at one time:
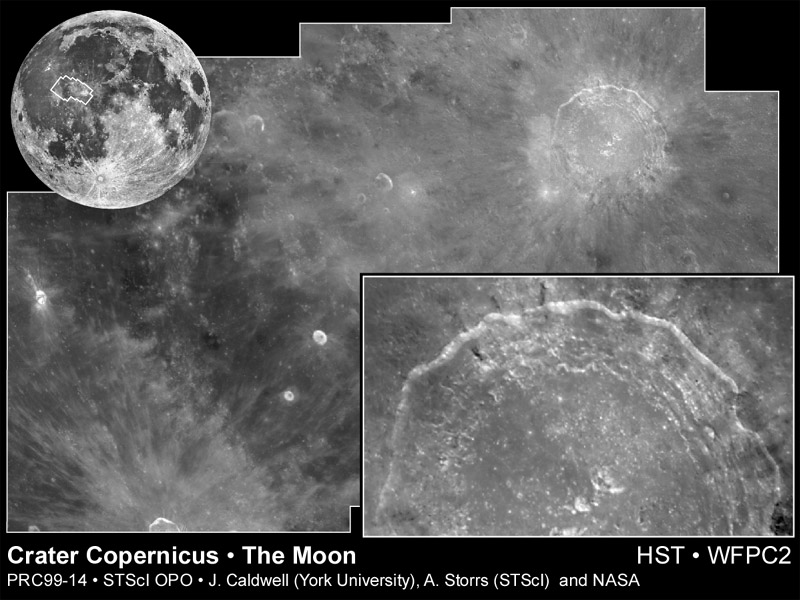
The SDSS Big Telescope, on the other hand, was designed especially to cover a very wide field of view. Here's how it would see the Moon:

The red box shows the field of view of the Hubble Space Telescope. In order to take a picture of the entire Moon, HST would have to combine images from about 150 different pointings -- that would take a long time. The SDSS telescope, on the other hand, has a field of view which is large enough to hold over 20 Moons! Technically,
HST can certainly resolve smaller details, and can also detect fainter objects (since it doesn't have to fight scattered light in the Earth's atmosphere). But the SDSS Big Telescope can cover large areas on the sky much, much faster -- literally thousands of times faster.
One of the advantages of the SDSS over previous surveys is its detector: instead of a photographic plate, the SDSS camera uses an electronic device called a "CCD" (for Charge Coupled Device) to measure light. There are two big advantages of CCDs over photographic plates:
The high efficiency of CCDs means that they can detect even faint sources of light in a short exposure time -- very important for a survey which plans to cover very large areas of sky. The linearity of CCDs means that one can make much more accurate measurements of brightness and color than are possible with the older photographic surveys.
But CCDs are small devices; it isn't possible to build one a foot across (unlike large photographic plates). In order to cover the large field of view of the Big Telescope, it was necessary to build a camera which combined many devices:
Image courtesy of the Sloan Digital Sky Survey
The camera contains six columns of CCD chips. Each column has a series of 5 chips, each with a different filter. The Telescope is scanned across the sky so that stars move across the camera in straight lines, exactly along the columns of the CCDs:
Image courtesy of the Sloan Digital Sky Survey
Now, there are two ways to operate a CCD chip:
The SDSS camera is designed to be used in drift scan mode: the telescope lets objects in the sky drift across the camera, and the CCDs are read out in sync with the drifting. The result is still a sharp image, with no smear or trailing ... and, since the shutter is always open, the camera collects more light than one which must close its shutter to read out the image.
An object takes about one minute to drift across one of the CCDs. It then drifts to the next CCD in the column, takes about a minute to drift across it, and so on. The result is a set of 5 exposures of each object through 5 different filters, ranging from blue to near-infrared. The images in different filters can be combined to create a (false) color picture of the sky:
Image courtesy of the Sloan Digital Sky Survey
Color can tell us quite a bit about an object. Compare the information in the color picture above with that in the monochrome image below, taken from the photographic Palomar Sky Survey:
The colors of galaxies in this image make it clear that they belong to a distant cluster (click on the image for a larger, more impressive picture):
Image courtesy of the Sloan Digital Sky Survey
Sometimes, unexpected things appear in the images.
Image courtesy of the Sloan Digital Sky Survey
This is a satellite which passed through this area of the sky while it was being scanned by the "g" filter, but was long gone a few minutes later when the same area drifted across the "r" and "i" filters. The "g" image was used as the Blue component of this image, the "r" as the Green component, and the "i" as the Red component. Since the satellite's trail appears only in the "g" image, it has only Blue coloring in this false-color reproduction.
As it makes the map of its quarter of the sky, the SDSS will process its images to detect and identify all the objects in them. A few days after each image is taken, computers at Fermilab perform detailed calculations to find, measure, and classify all the stars, galaxies, and other objects. The information is placed into a big database on the computers at Fermilab.
The plan is to use the database to pick out one million or so of the brightest galaxies in the survey area. We want to take a spectrum of each of these million galaxies. Why?
                                velocity (km/sec)
            distance (Mpc)  =  ------------------
                                 H0 (km/sec/Mpc)
It would take a very long to measure a million spectra, one at a time, so we use a trick to speed things up: we point the Big Telescope at an area of the sky, and mount a thin plate of metal on its back. This plate has a set of about 500 holes drilled into it ... in exactly the locations of 500 galaxies in that area of the sky. Each hole is plugged with an optical fiber, which carries the light from one galaxy down to a big spectrograph.
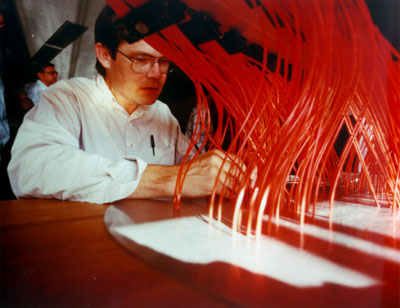
Image courtesy of the Sloan Digital Sky Survey
The spectrograph can split the light from each fiber into a spectrum, and then measure all the spectra at once.
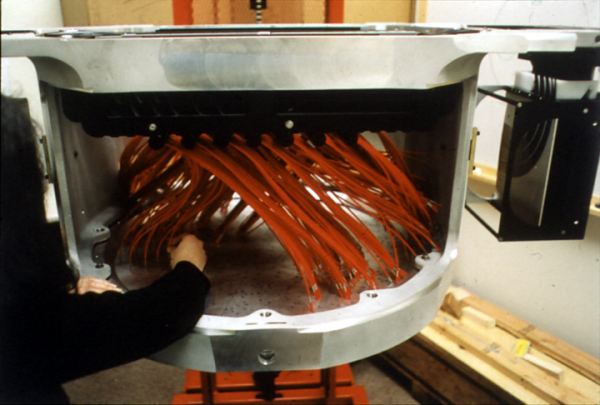
Image courtesy of the Sloan Digital Sky Survey
So, we take the spectra of 500 galaxies in a single pointing, instead of just one. Each spectrographic exposure takes about one hour. This is much longer than the exposure time of one minute for an imaging scan, because the light from each object is split up by wavelength. The bottom line is that the multifiber spectrographs are able to measure the spectra of about 500 galaxies (and about 100 stars and quasars) per hour.
The very first galaxy for which a redshift was measured appears in this image:
Image courtesy of the Sloan Digital Sky Survey,
Steve Kent, and Bob Nichol
Its spectrum shows emission lines of oxygen gas, excited by hot stars in the galaxy.
Image courtesy of the Sloan Digital Sky Survey
and Bob Nichol
The wavelengths of the emission lines are shifted to the red: the strong oxygen emission has a rest wavelength of 5007 Angstroms, but appears at about 5375 Angstroms. That tells us that this galaxy is moving away from us; the size of the redshift
                   observed wavelength
   redshift z  =  ---------------------  -  1
                     rest wavelength

                     5375 Angstroms
               =  ---------------------  -  1
                     5007 Angstroms


               =  0.07
indicates the speed of recession:
   velocity    =   (redshift)  *  (speed of light)

               =     0.07      *    300,000 km/sec

               =     21,000 km/sec
Using Hubble's Law, we can estimate the distance to this galaxy. The Hubble Constant H0 is about 70 km/sec/Mpc:
                                velocity (km/sec)
            distance (Mpc)  =  ------------------
                                 H0 (km/sec/Mpc)

                                 21,000  km/sec
                            =  ------------------
                                  70 km/sec/Mpc


                            =    300 Mpc
The light we detect from this galaxy has been travelling through space for about one billion years!
We can do the same thing for many other galaxies:
We can then make a map showing the distribution of these galaxies in space. During the Fall of 1999, during commissioning tests, the SDSS Big Telescope and spectrographs measured the redshifts of more then 4000 galaxies, in an area about 50 degrees wide. Here's a "pie-slice" plot, showing the positions of those galaxies in space, as seen from far "above" the location of the Earth:
Image courtesy of the Sloan Digital Sky Survey
and Bob Nichol
One of the major goals of the SDSS is to map out the positions of about 1,000,000 galaxies in this manner. This is a simulation of what we might see:
Image courtesy of the Sloan Digital Sky Survey
The SDSS has started making scans of the sky, but it has a long way to go. As of February 14, 2001, only about 14 percent of the imaging scans had been completed (as of May 10, 2000, only about 9 percent of the imaging scans had been completed).
Image courtesy of the Sloan Digital Sky Survey
It will probably take about two more years to scan all the lines in the survey area (I wrote this in May, 2000, and suspect it's still true now, Feb 14, 2001).
The spectroscopic portion of the survey has also begun, but it must wait for the imaging survey to cover large chunks of the sky before it can measure the redshifts of objects in those areas. So far, as of Feb 14, 2001, about 2 percent of the spectroscopic plates have been taken:
Image courtesy of the Sloan Digital Sky Survey
The spectroscopic survey will probably continue for another five years or so.
When it has been finished, the SDSS will provide a wealth of information:
| raw pixel data | 12000 GB |
| merged pixel maps | 8000 GB |
| atlas images | 250 GB |
| object catalog | 25 GB |
| spectroscopic catalog | 1 GB |
The plan is for most of this information (not the raw data, and probably not the large chunks of blank sky in between stars and galaxies) to be stuffed into a big database and made available to scientists over the Internet.
For more information,
Copyright © Michael Richmond.
This work is licensed under a Creative Commons License.