 Copyright © Michael Richmond.
This work is licensed under a Creative Commons License.
Copyright © Michael Richmond.
This work is licensed under a Creative Commons License.
In the nineteen fifties, Bell Laboratories was trying to figure out how to send information more effectively across long distances. One possibility was to transmit data via radio waves, bouncing them off balloons floating high in the atmosphere. Bell Labs built a big radio transmitter/receiver in Holmdel, New Jersey, to test this idea.
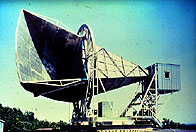
Several years after it was built, a rival company launched a set of satellites, which proved much more effective for radio transmission. The balloon idea was scrapped, and the radio horn was turned over to a pair of scientists for astronomical research.
Arno Penzias and Robert Wilson started to use the antenna to study radio emission from the Milky Way in 1962. They soon discovered that there was an annoying source of noise, like static, which contaminated their measurements. It didn't seem to be related to manmade sources of radio waves, or the Sun, or any planet, or any celestial source they could identify. In desperation, Penzias and Wilson scared away the pigeons which were nesting in the antenna, and scraped out all the guano (eeeewwwww), hoping that it might be the source of the static. But they couldn't get rid of the noise.
Meanwhile, just a short distance away, in Princeton, New Jersey, physicist Robert Dicke and his colleagues had a theory about the evolution of the universe. Their theory predicted that the universe should be filled with faint radio waves, coming from all directions. They called this the cosmic microwave background. In the early sixties, the scientists at Princeton started to build radio antennas and receivers to look for this radiation.
In 1965, Penzias came across an article by Dicke, and realized that the "static" in the Bell Labs antenna might be this cosmic microwave background. The two groups got together, shared their results, and published a pair of papers in the Astrophysical Journal. Penzias and Wilson described their measurements of the "static" with their antenna, and the Princeton scientists interpreted their measurements in terms of their theory.
Penzias and Wilson were awarded the Nobel Prize in Physics in 1978 for their discovery. Dicke received nothing. Oh, well.
The COBE satellite had three main instruments, but we'll discuss only two of them:
One of the instruments aboard the COBE satellite was called FIRAS, which stands for "Far-Infrared Absolute Spectrometer." This device measured the intensity of radiation as a function of wavelength, very precisely. Scientists had guessed that the spectrum of the microwave background ought to have a particular shape: that of a blackbody. A blackbody is an object which absorbs equally all the radiation which strikes it. Theoretically, a perfect blackbody should emit radiation with an intensity which depends only on the blackbody's temperature, in a very specific fashion:
Note that the peak wavelength at which a blackbody emits becomes shorter as the object becomes warmer:
| Object | Temperature (K) | Peak wavelength | Radiation |
| cold molecular cloud | 10 | 2.9 mm | microwave |
| warm gas cloud | 100 | 0.29 mm | far infrared |
| live human | 310 | 9355 nm | infrared |
| Sun | 5770 | 530 nm | visible |
Early measurements of the cosmic background radiation showed that it peaked in the microwave (hence the name Cosmic Microwave Background). The peak wavelength was around 2 mm, and the shape of the spectrum seemed roughly consistent with that of a blackbody. The FIRAS instrument measured the spectrum of the CMB precisely, and found ...
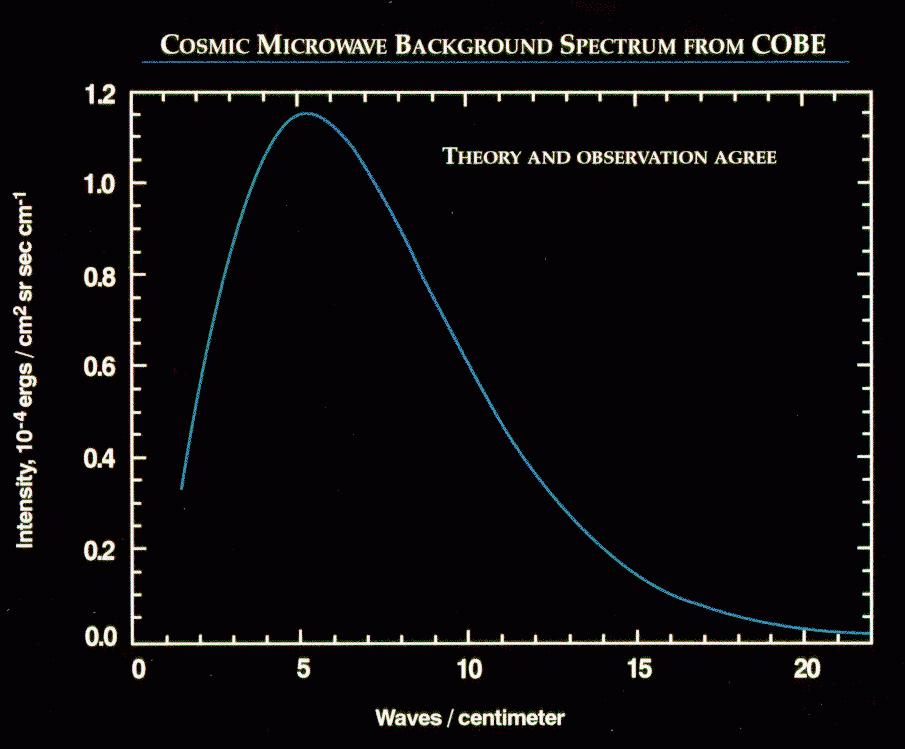
... exactly a blackbody spectrum, with a peak wavelength of 1.869 mm, corresponding to a temperature of T = 2.726 +/- 0.010 K .
This plot from Mather et al., ApJ 420, 439 (1994) shows the DIFFERENCES between the COBE measurements and a theoretical blackbody spectrum. Note the size of the scale on the left.
Early measurements showed that, no matter which direction one looked, the background radiation had the same intensity. It was uniform, as far as we could tell. But was it really uniform?
One of the main tasks of the COBE satellite was to look for any variation in the intensity of the CMB, down to levels of much less than one percent. The instrument called Differential Microwave Radiometers, or DMR for short, consisted of three small antennas, spaced 120 degrees apart from each other on the top of the spacecraft. As the satellite spun around its central axis at 0.8 rpm, the antennas gathered microwaves repeatedly from a circular strip of sky. The signals from the three antennas were compared against each other very carefully, revealing tiny differences in the intensity of radiation from different spots along the circular strip. Over several years, the satellite scanned the entire sky. By combining data from the entire mission, scientists were able to detect variations as small as 1 part in 100,000.
Here is what the DMR instrument saw:
The big red stripe across the middle of the picture is due to radio emission from material in the disk of our Milky Way galaxy. If we make a model of the Milky Way's emission and subtract it from the observations, we are left with a more subtle set of ripples and splotches:
The variations in this map are tiny: about 0.001 percent. They correspond to differences in temperature of about plus or minus 0.0001 degree Kelvin.
What could cause these variations?
When we look at the microwave background, our view depends on the instrument we use. The COBE satellite, for example, had a resolution of about 7 degrees: any details smaller than that were blurred together. New instruments have much better resolution, and can distinguish fine detail.
Does that make a difference? Yes! For example, take a look at this picture:

What is it?
Not sure? Try looking at this version:

Do you know now?
At higher resolution, it looks like this:
Note how new details come into view. We can answer a new set of questions with the additional information in the higher resolution views.
Even higher resolution:

Finally, take a look at the highest-resolution image of them all:

The COBE satellite had a resolution of about 7 degrees, so its picture of the microwave background can't show any fine detail.
Radio emission from gas in the disk of the Milky Way fills the center of this COBE map, but the true microwave background can be seen above and below the center. The hot (red) and cold (blue) blobs are actually the averages of temperature variations on much smaller scales. Unfortunately, we can't see those smaller variations with COBE.
There are a number of ongoing experiments which attempt to measure the microwave background with better resolution than COBE. One of them, BOOMERANG , is based at the South Pole, because only there is it cold enough to permit ground-based instruments to detect the miniscule variations in the microwave background. The BOOMERANG instruments are flown on a balloon, which flies at an altitude of about 35 km for days at a time.
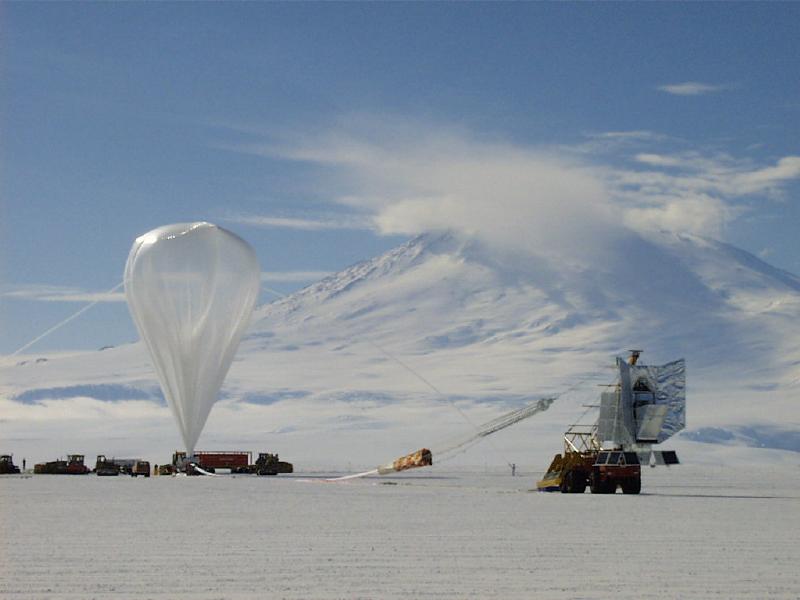
BOOMERANG provides images with a resolution of about 0.2 degrees:
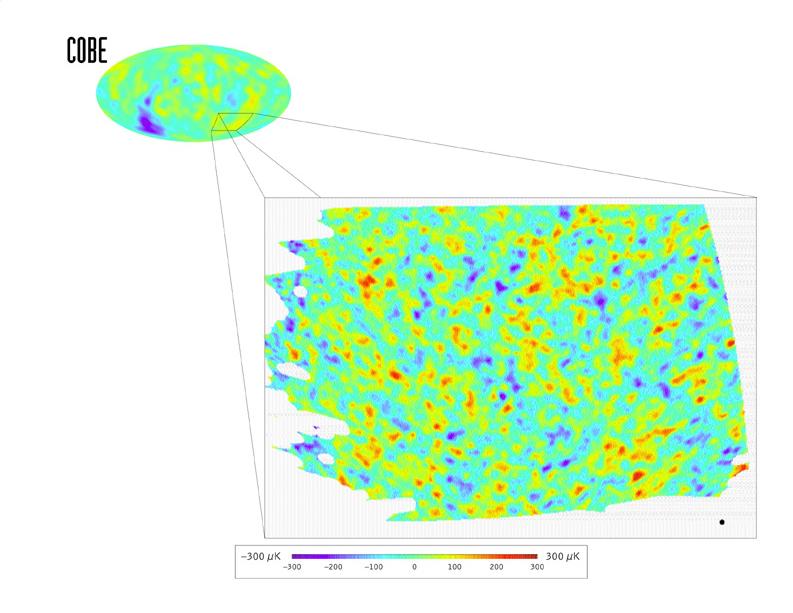
These images provide a much better view of the structure of the microwave background, but they only cover a small fraction of the entire sky.
Another project is MAXIMA, which also uses a balloon to lift microwave detectors high above most of the atmosphere. An excerpt from their WWW site describes the measurements:
During our first overnight flight (MAXIMA-1, 1998) we observed 124 deg.2 of the sky which corresponds to >4,500 beam-size pixels, 6 times as many as the COBE-DMR satellite data set using the same pixelization scheme. The data are proving to be of high quality. We have produced maps of the sky from several different array elements and these maps show consistent structure from one to another. We have produced preliminary angular power spectra and are performing a battery of tests for systematic errors. Data from the second flight (MAXIMA-2, 1999) have nearly twice the area of sky coverage (230 deg.2) of the first flight.The MAXIMA instruments have measured fluctuations which are very similar to the BOOMERANG ones:
The MAP satellite, on the other hand, will cover the entire sky with a resolution between 1 degree and 0.2 degrees (depending on the wavelength of microwaves measured). It also will be able to make out the true small-scale variations. Here's a guess at the kind of map it will provide:
For more information, see
Copyright © Michael Richmond.
This work is licensed under a Creative Commons License.