 Copyright © Michael Richmond.
This work is licensed under a Creative Commons License.
Copyright © Michael Richmond.
This work is licensed under a Creative Commons License.
One of the main reasons for constructing the Hubble Space Telescope was to measure light curves of Cepheid variables in other galaxies. It is especially important to use Cepheids to measure distances to the galaxies in two nearby clusters: the Virgo Cluster (the nearest rich cluster), and the Fornax Cluster (a somewhat sparser collection of galaxies).
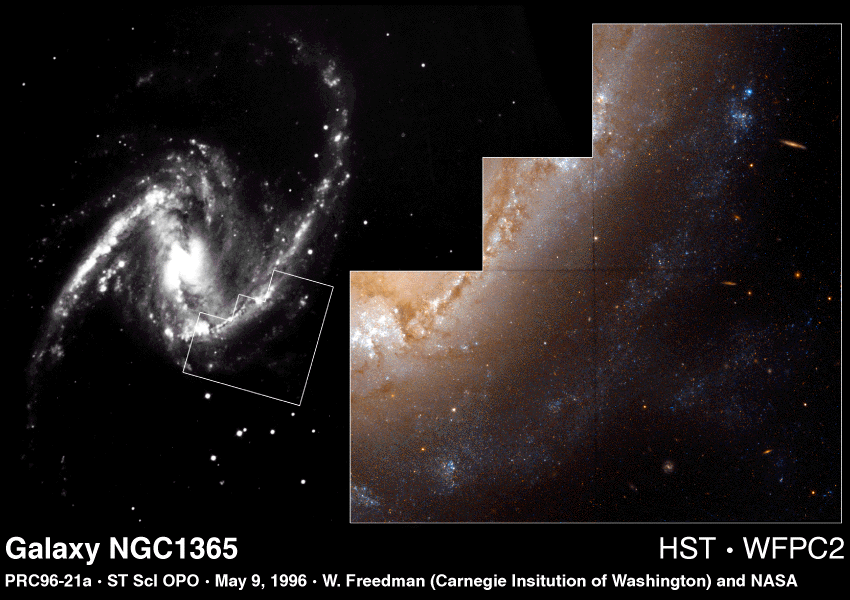
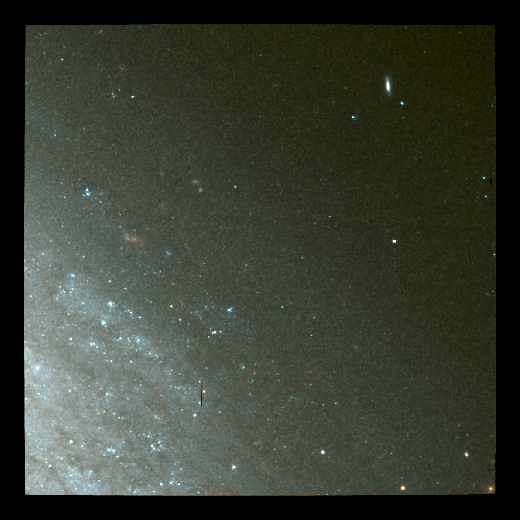
HST can zoom in on a small portion of a galaxy to find and measure Cepheids:
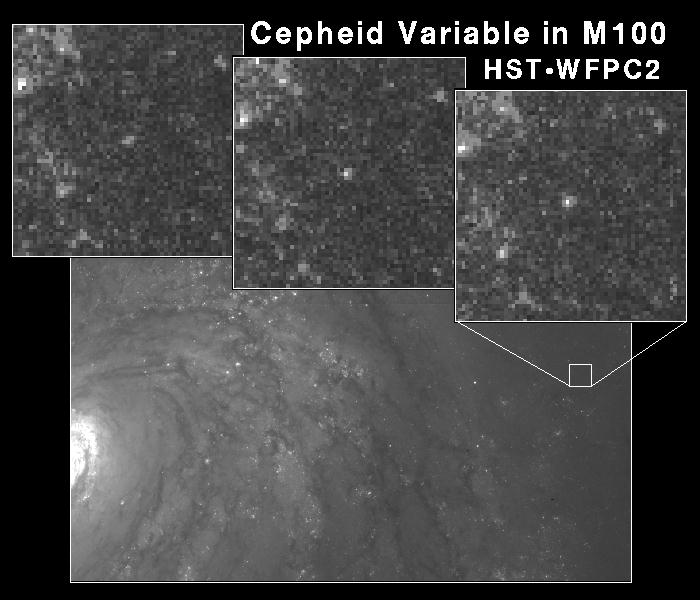
Even the HST has a hard time measuring the light of Cepheids at such great distances:
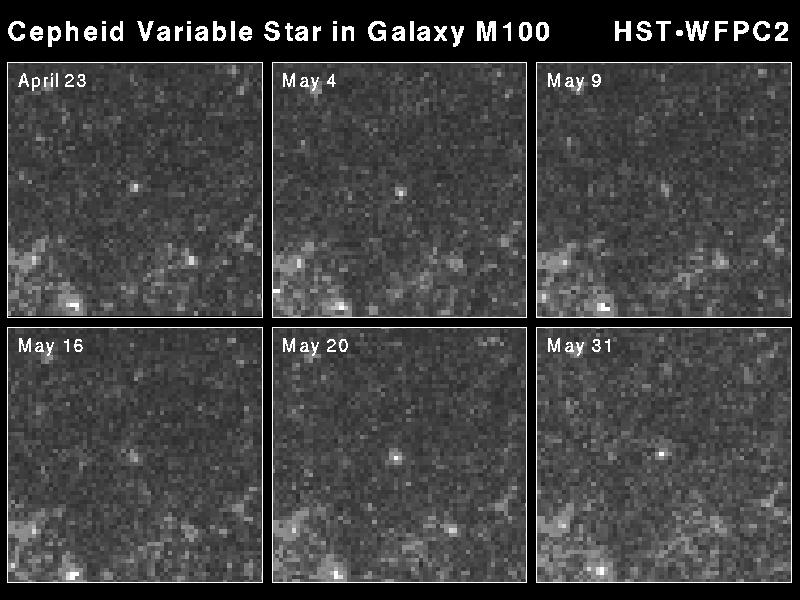
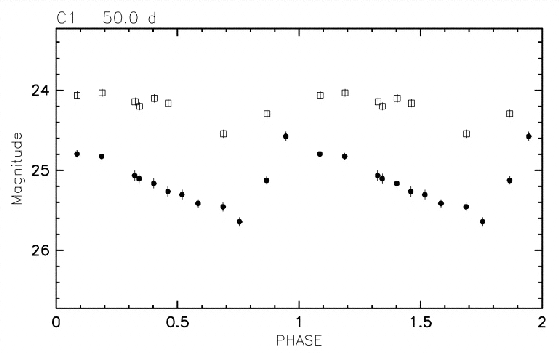
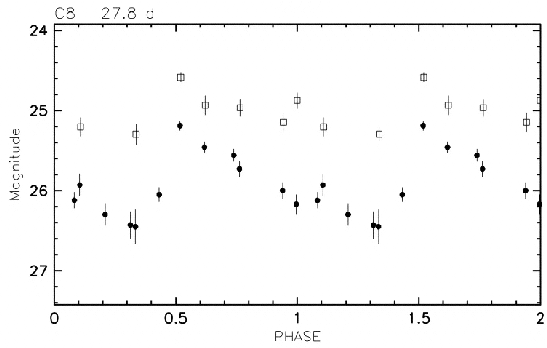
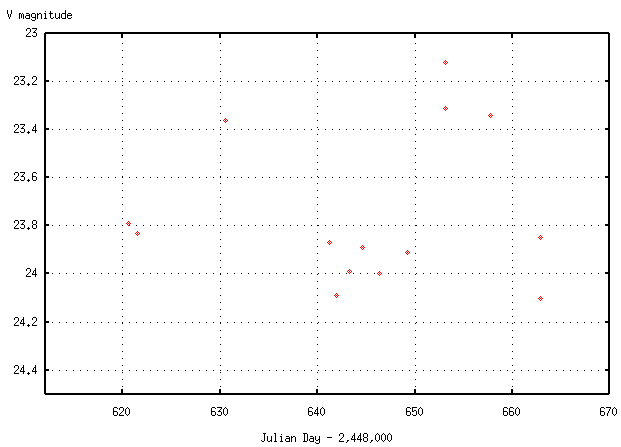
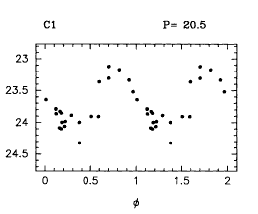
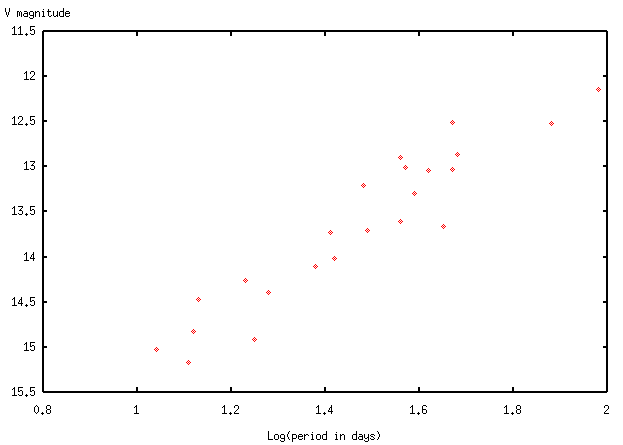
The light curves measured by HST for Cepheids in these galaxies are rather ratty:
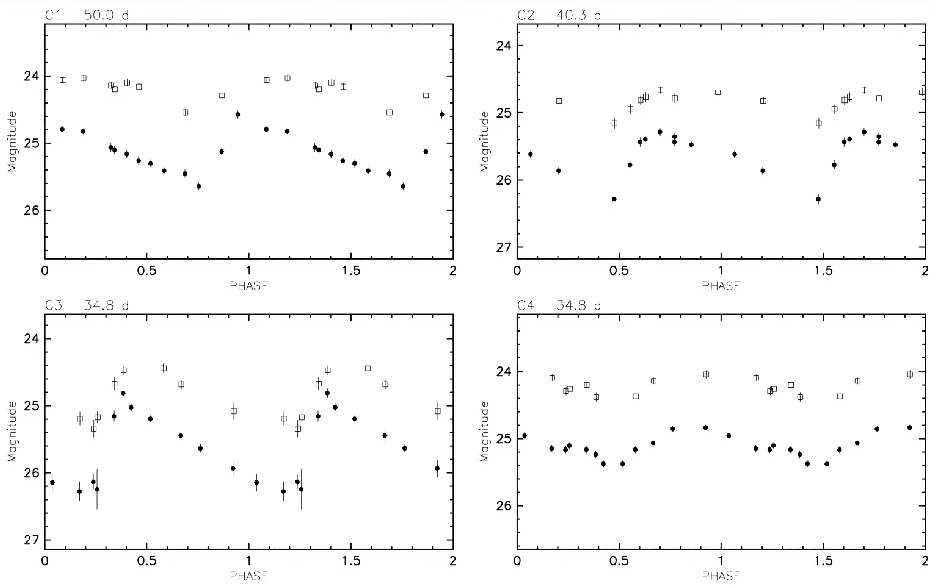
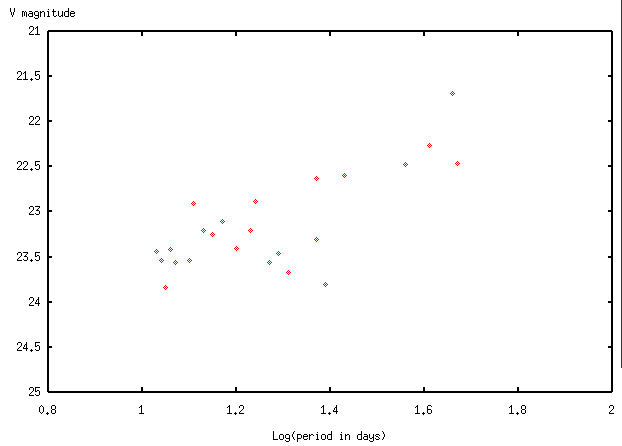
Here are closeups of a long period (50 days) and shorter period (28 day) Cepheid. Note that the star with a shorter period has a significantly larger (fainter) magnitude.
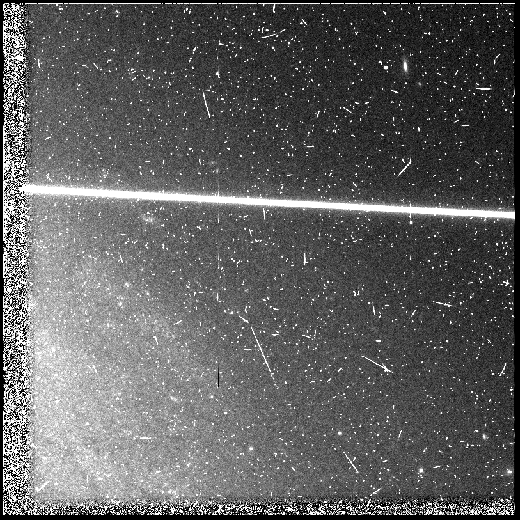
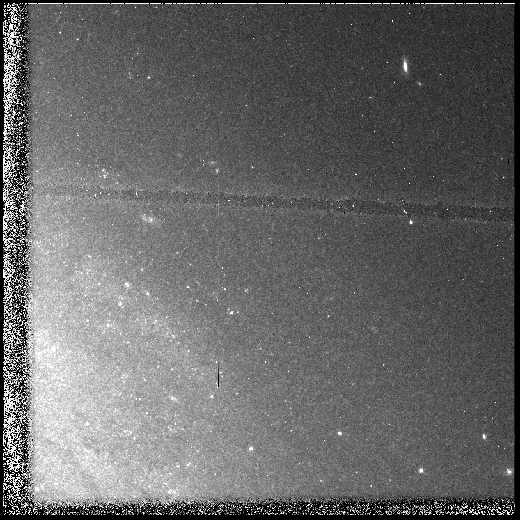
Here's a combination of two HST images, taken back-to-back,
which allows one to remove most of the cosmic ray hits
(and most of the satellite trail):
And here (just for fun) is a combination of many epochs
of HST images of NGC 2841.
I've combined V and I images to make a pseudo-color image:
The last two steps involve calculations in wierd units. Astronomers measure brightness in "magnitudes", which decrease with increasing brightness (I told you they were wierd). The simplest way to compare Cepheids in two different galaxies involves finding the shift in magnitudes which brings the "magnitude vs. log(period)" relationships together. If you measure this shift in magnitudes, then the ratio of distances between Galaxy 1 and Galaxy 2 is
        (dist 2)       0.2 * (mag 2 - mag 1)
        -------   =  10
        (dist 1)
The usual method is to compare Cepheids in some distant galaxy (Galaxy 2) against those in the nearby LMC (Galaxy 1). Since we know the distance to the LMC, we can calculate the distance to the distant Galaxy 2:
                                        0.2 * (mag 2 - mag 1)
        distance  =   (dist to LMC) * 10

                                        0.2 * (mag 2 - mag 1)
                  =      50 kpc     * 10
Cepheids aren't perfect distance indicators. For one thing, their brightness and periods of pulsation can vary with their chemical composition. There's also the problem of crowding and confusion: what if our view of a distant galaxy appears to show a single, varying Cepheid star .... but is really a combination of light from the Cepheid and several nearby stars, all mixed together?
Let's see how this could cause a systematic error in the distance measured via Cepheids:
That's the basic idea. A discussion has been going on in the astronomical literature for the past several years on the size and importance of this effect.
We investigate the influence of blending on the Cepheid distance scale. Blending is the close association of a Cepheid with one or more intrinsically luminous stars. High-resolution HST images are compared with our ground-based data, obtained as part of the DIRECT project, for a sample of 22 Cepheids in the M31 galaxy. The average (median) V-band flux contribution from luminous companions that are not resolved on the ground-based images is about 19% (12%) of the flux of the Cepheid. This is a large effect-at the 10% level for distances. The current Cepheid distance estimates to M31 are all ground based and are thus affected (underestimated).
We find that while the photometry in individual images can be biased too bright by up to 0.2 mag in the most crowded fields due to confusion noise, the effects on distance measurements based on Cepheid variables are insignificant, less than 0.02 mag (1% in distance) even in the most problematic cases. This result, which is at odds with claims that have recently surfaced in the literature, is due to the strict criteria applied in the selection of the variable stars, and the photometric cross-checks made possible by the availability of multiple exposures in different filters which characterize Cepheid observations.Note in the last sentence the way that scientists express the opinion, "we're right and you're wrong."
After nine years of hard work, the Key Project team has measured distances to 18 different galaxies using Cepheid variables. Other groups of astronomers have used HST to look at Cepheids in another 10 or so galaxies. The most distant of these galaxies are about 25 Megaparsecs away. That sounds like quite a distance -- in fact, it's barely far enough to include galaxies in the Virgo Cluster, the nearest cluster of galaxies to our own Milky Way.
On the other hand, it's still only a tiny fraction of the distance to most of the galaxies we can see. The figure below shows a map of the local universe: each little blue dot represents a galaxy (there are many more galaxies in this volume than blue dots, by the way). The tiny red circle near the center represents the distance out to which we can measure distances with Cepheids. Obviously, Cepheids won't allow us to measure distances to most of the galaxies we can see.

So how did we make this plot, you might ask? Good question -- and a topic for next week. See the lecture on the distance-velocity connection.
For more information, see
Copyright © Michael Richmond.
This work is licensed under a Creative Commons License.