 Copyright © Michael Richmond.
This work is licensed under a Creative Commons License.
Copyright © Michael Richmond.
This work is licensed under a Creative Commons License.
The Inferior Planets
Today we will use SkyMap Pro to observe the positions of the planets Mercury
and Venus relative to the position of the Sun.
The necessary observations (in
the real world) would have to be made over an extended period of time.
SkyMap
Pro will let us speed up time so that we can acquire all of the necessary
observations.
From these observations we will make scale drawings of the inner
part of the solar system.
- Elongation: the angle between the Earth-Sun direction
and the Sun-planet direction.
(i.e. the angle in the sky between
the Sun and a planet)
- Synodic Period: a period for some series of events
which are measured relative to the Sun
- Conjunction: when two objects are seen to be
in the same direction as seen from Earth.
(i.e. they appear close together in the sky)
I. Observations of elongations and brightness.
- Start at May 1, 2001 (18:00, 6pm EDT).
- Find, center, and lock on the sun.
- Click on Scroll in RA/Dec (button is near top left of screen).
- Make sure that the horizontal width of your view is at least 70 degrees.
- Turn off everything but the Sun, the planets and the ecliptic.
(even though we will only take data for Mercury and Venus),
- If the dot showing Mercury's position is too small to see easily,
use the Lower Mag Limit control to increase it.
- Place the compass on the sky.
- Measure the angular distance between the Sun and Mercury,
and between the Sun and Venus.
If you left-click on the Sun, then left-click on a planet,
the angular separation will appear at the bottom of the
Sky Map window.
- Use a time step of 7 days to acquire data for Mercury, 28 days for Venus.
(Take data for Venus each fourth interval for Mercury.)
For each planet, generate a table with columns giving date,
number of days since the start,
and elongation in degrees (use negative for East, positive for West).
Leave room for a comment column.
Continue to take data for a given planet until you see at least
one complete cycle.
Since you are measuring the position of each planet relative to
the Sun, this period is the synodic period of the planet.
II. Calculations & Questions
- Determine the dates of maximum western elongation and maximum eastern
elongation for each of the planets. Determine the following time intervals:
- maximum eastern elongation to next maximum western elongation
- maximum western elongation to next maximum eastern elongation.
- For each planet, are the two
maximum elongations the same? If so, what is the value?
If not, what is the average value?
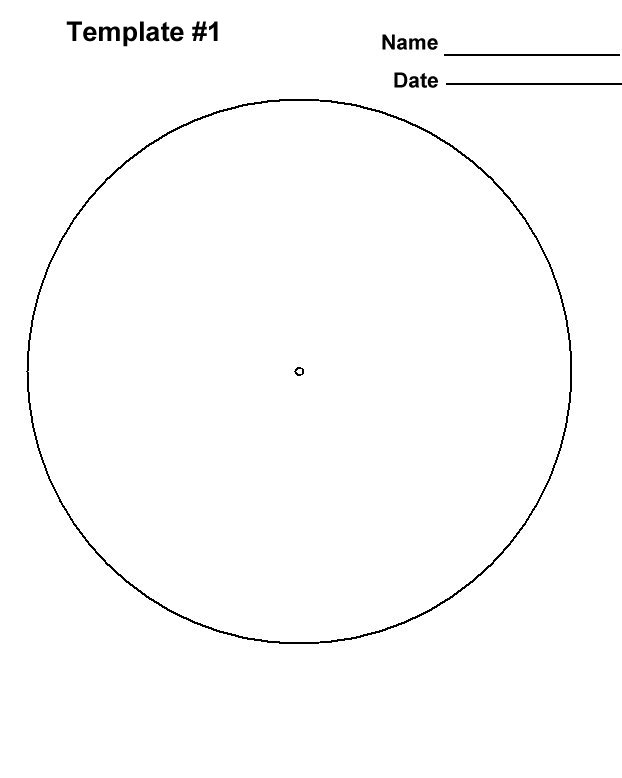
- Template #1
shows a small dot at the center, representing
the Sun, and a large circle, representing the Earth's orbit.
Using the template, draw orbits for each planet consistent
with the maximum elongations observed.
Use the protractor and compass provided.
- Using this drawing, determine the radius of each
orbit in units of the radius of the earth's orbit.
The radius of the Earth's orbit is called 1 Astronomical Unit
(1 AU).
- What is the relationship between a plaeet's maximum
elongation from the Sun as seen from Earth,
and its orbital radius in AU?
- For each planet, determine the maximum and
minimum distance from the earth in AU.
Using this information, find the ratio
of maximum and minimum apparent angular diameters
that you would expect to observe for each of these planets.
- Indicate the following planetary configurations on the diagram:
- inferior conjunction
- greatest western elongation
- superior conjunction
- greatest eastern elongation
III. Comparison with Telescopic Data
In Sky Map Pro, reset the time to May 1, 2001. Using the search and zoom menu
items, examine the disk of Mercury and lock onto it.
Just as before, step
forward in time by 7 day intervals,
observing and recording any information you
find important.
In particular, note the maximum and minimum angular
diameters of the planet throughout a cycle,
as well as the relation between phase of the planet
and the size of the disk.
Repeat the same procedure for Venus (using a 28 day
interval).
- Calculate the ratio of the maximum and minimum angular sizes for
Mercury and Venus. Compare these values to those obtained from your scale
drawings based on the Copernican model.
- Compare the phase of each planet to
your expectations, given your experience with observing the Moon's phases.
What are the similarities, what are the differences?
- Plot your data sets through at least one complete cycle,
with elongation on the Y-axis and time on the X-axis.
Indiciate above terms and features in
your diagram.
Copyright © Michael Richmond.
This work is licensed under a Creative Commons License.