 Copyright © Michael Richmond.
This work is licensed under a Creative Commons License.
Copyright © Michael Richmond.
This work is licensed under a Creative Commons License.
Modified 2/13/2020 to use a local source of imagery. MWR
Your task in this experiment is to examine images of the sky to find a variable star, and then to monitor its changes in brightness over several months. The end result will be a light curve for the star, showing how its apparent magnitude varies as a function of time.
You will use images of the night sky taken by the Stardial instrument: see
Stardial is simple: an ordinary camera lens focuses light onto a CCD detector, which records a digital record of the image. The whole device fits into an enclosure about the size of shoebox, which sits on the roof of the astronomy department at the University of Illinois Champagne/Urbana. It operates every night of the year, taking pictures which cover a swath of the sky eight degrees wide, from Declination = 0 degrees to Declination = -8 degrees.
All the images Stardial has collected since 1996 are available on-line: you can browse them by date, or by location on the sky. For this experiment, you will need to examine images near the location Right Ascension = 21h 15m, Declination = 0. You can find sets of images over the period 1996 - 2006 in following locations:
When you look at any particular image, your WWW browser should show a picture something like this (but without the red box):
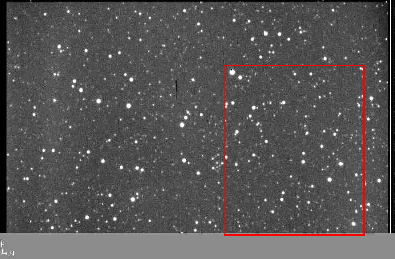
The images are shown "on their side": North is to the right, and East is up. The normal orientation of astronomical images and charts is North up, East to the left. So, in order to compare these Stardial images to charts from Sky Map Pro, for example, you'll have to rotate the image ninety degrees counter-clockwise.
Each image covers an area 8 degrees long by about 4 degrees wide. The celestial equator (Declination = 0) is at the right side, and Declination = -8 degrees is at the left side. East is at the top of the image, and West at the bottom. The name of each image describes the date it was taken, in the form MMDD.jpeg. For example, an image called "0723.jpeg" was taken in July 23 of its year.
The red box in the picture above outlines an area in the constellation Aquarius which contains a variable star called "RR Aqr". Your first job is to figure out which of the stars is the variable. Here are two Stardial images of the field, one taken when the variable was at its brightest, the other when it was at its faintest:
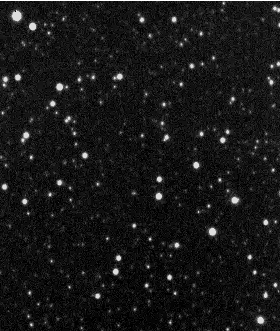
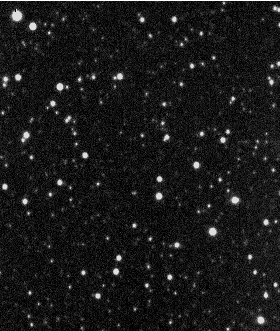
Can you find the star which changes its brightness?
Astronomers use a method called "blinking" to search for variable stars: they alternate rapidly between two images, displaying registered versions of each for just a second or two. You can "blink" the two images above by selecting the link below. You will see one image by itself; click on it to display the other image. Keep clicking (or using the Alt-Left and Alt-Right buttons) to alternate the images until you find the variable. Click on the text at the bottom to return to this exercise when you have found it.
Once you've found the variable star, you may verify that it is RR Aquarii by using Sky Map Pro. Remember that the Stardial images must be rotated counterclockwise by ninety degrees to match the usual orientation!
Now that you've found the variable star, you must measure its change in brightness over an entire season. You can compare the appearance of RR Aqr against those of stars nearby to gauge its magnitude. Below is a chart of stars inside the red box (perhaps you'd prefer a Postscript version of the chart).

The chart has reversed the usual color scheme: astronomers often use a "negative" portrayal of the sky as white and stars as dark in publications, both because it's easier on printers, and because most people can discern faint details more clearly.
The chart provides magnitudes in the "V" passband for eight stars in the area. As you examine images from the Stardial archive, compare the appearance of RR Aqr to these eight stars. If it looks just like one of them, then its magnitude must be close to that of the star; so if RR Aqr looks just like star "D", it would have a magnitude of 8.1. On the other hand, if RR Aqr seems to fall between two of the marked stars, its magnitude must be between those of the two stars; for example, if it looks fainter than star "E", but brighter than star "F", then its magnitude must be between 9.4 and 10.0: perhaps 9.7.
Now, turn your table of measurements into a graph. Using a piece of graph paper, make a plot which shows time T on the horizontal axis (running from 0 to 180 days), and magnitude on the vertical axis. Remember that the magnitude scale used by astronomers runs backwards: bright objects have smaller magnitudes, so arrange the vertical scale so that it runs from 11.5 at the bottom to 7.5 at the top. Now, plot each point from your table onto this graph.
Using the Stardial images, your table and graph as references, describe the behavior of RR Aqr.
Now, make a second graph, this time running from 0 days to 900 days on the horizontal axis, and from 11.5 to 7.5 on the vertical axis.
RR Aqr is a member of the Mira class of variable stars. It is an old star, near the end of its lifetime, which has swollen into a red giant. Its outer layers undergo a periodic cycle of pulsation: first they heat up a bit, and slowly expand outwards; then cool off, and slowly contract back inwards. You can read more about such pulsating variables in your textbook.
Extra Credit
Pretend for a moment that the outer layers of RR Aqr don't change heat up and cool off, but maintain a constant temperature as they expand and contract. If that were the case, then the brightness of the star would depend simply on its surface area: the larger the diameter, and larger the surface area, the brighter the star. If RR Aqr varied only in size, what would be the ratio of its diameter at maximum light to its diameter at minimum light?
Last modified by MWR 02/13/2020
Copyright © Michael Richmond.
This work is licensed under a Creative Commons License.