 Copyright © Michael Richmond.
This work is licensed under a Creative Commons License.
Copyright © Michael Richmond.
This work is licensed under a Creative Commons License.
Okay, suppose you use a spectrograph to measure the light emitted by a star at optical wavelengths.
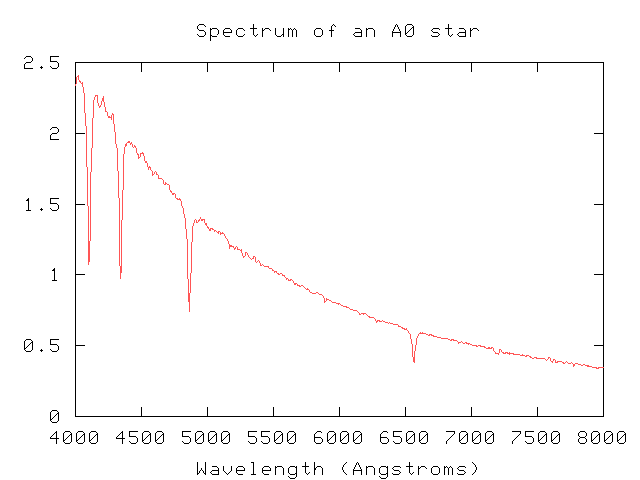
What can you do with it? It turns out that you can learn quite a lot about a star with just a little work. Let me mention just two kinds of information you can extract from a spectrum:
Note that our simple analysis will tell us only about the outermost layers of the star. It is possible to investigate the interior, but it takes quite a bit more effort.
When you look at me, you see light which is emitted by the flourescent bulbs overhead and bounces off me or my clothing. If I turn off the lights, and close all the shades and drapes so that no outside light can enter the room, will you see me? No.
But a rattlesnake could. How? The rattlesnake has organs which can detect the heat my body gives off. Heat is, in fact, one kind of electromagnetic radiation: the kind we call infrared. Even if no lights shine upon me, my skin still emits this infrared radiation.
In fact, to a rough approximation, all objects emit radiation in a manner which depends largely on their temperature. Human eyes can't see this radiation when an object is at room temperature ... but they can begin to sense it when the temperature rises to many hundreds of degrees.
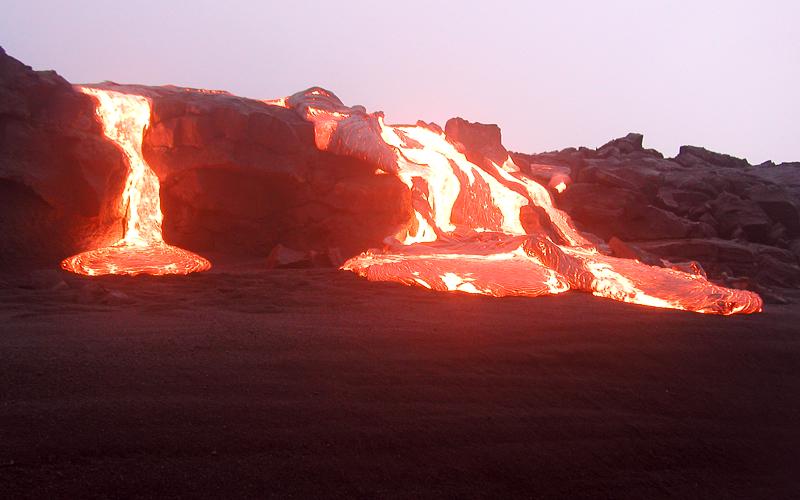
As the temperature of an object rises, the radiation it emits changes in two ways:
   If A is ____ times as hot as B    it emits this much more energy
  -------------------------------    ------------------------------
             1.1                                 1.5
             1.5                                 5
             2                                  16
             3                                  81
            10                              10,000
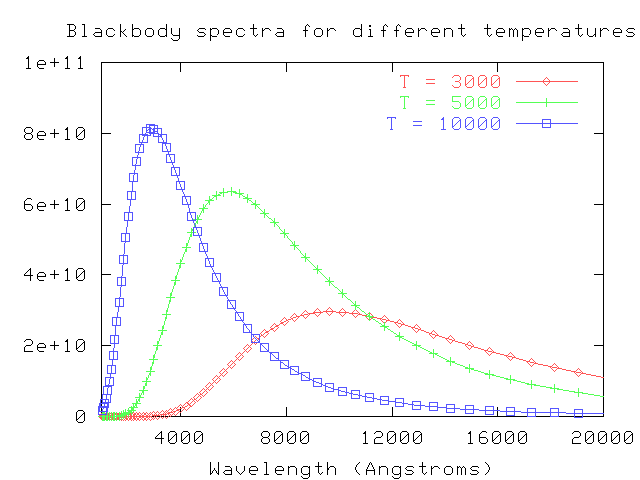
In fact, there is a simple mathematical formula which relates the temperature of a star and the peak wavelength of its spectrum:
                          29,000,000  Angstroms
   temperature (K)  =  --------------------------
                            peak wavelength
You don't need sophisticated equipment to determine temperatures very roughly; just look at the sky with your own eyes.
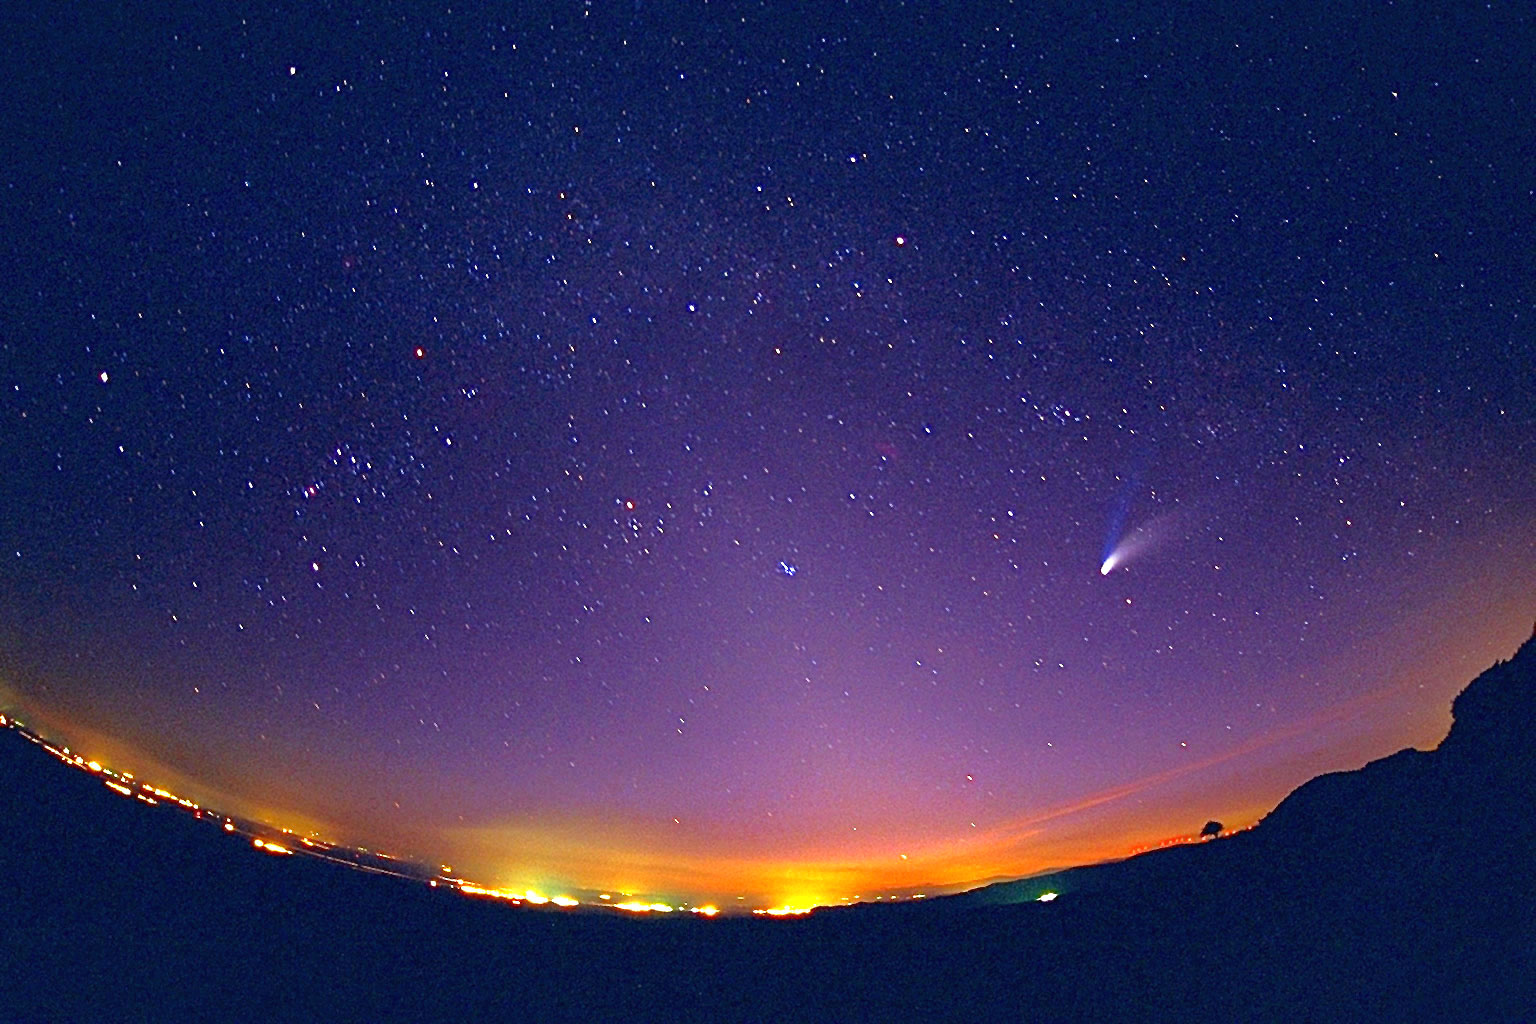
Credit & Copyright: Juan Carlos Casado
Credit and Copyright: Akira Fuji
Red stars are cool (temperatures below 4500 K), and blue or blueish white stars are hot (temperatures above 9000 K).
People have long known that the stars are far, far away; in the nineteeth century, astronomers finally measured the distances to a few nearby stars with reasonable accuracy. The results were so large -- thousand of trillions of miles -- that most people figured we'd never be able to visit them or learn much about them. After all, we can't go to a star, grab a sample, and bring it back to earth; all we can do is look at light from the star. In fact, at least one prominent philosopher and scientist went on the record as saying that we'd never be able to figure out their compositions.
Of all objects, the planets are those which appear to us under the least varied aspect. We see how we may determine their forms, their distances, their bulk, and their motions, but we can never known anything of their chemical or mineralogical structure; and, much less, that of organized beings living on their surface ...
(Comte refers to the planets in the quotation above; he believes that we can learn even less about the stars)
But, it turns out, light from the star encodes a wealth of information about the physical state of its outer atmosphere. Light is produced in the inner regions of a star and works its way out to the "surface" -- which is really a part of the gaseous atmosphere called the photosphere. Photons produced in the photosphere have a good chance to escape outwards into space and, eventually, reach us. As photons fly through the outermost layers of the stellar atmosphere, however, they may be absorbed by atoms or ions in those outer layers. The absorption lines produced by these outermost layers of the star tell us a lot about the chemical compositition, temperature, and other features of the star.
For the details, read Sections 7.2 through 7.4 in your textbook.
There are a LOT of features in stellar spectra, if you look close enough. Here's a teeny section of the solar spectrum, from wavelength 6800 to 6820 Angstroms. First I show it in "photographic" form, with dark lines on a bright background, as you would see if you looked into a spectrograph yourself. Below is a graph showing intensity as a function of wavelength. Note how many lines can be measured and identified, even in this teeny section.

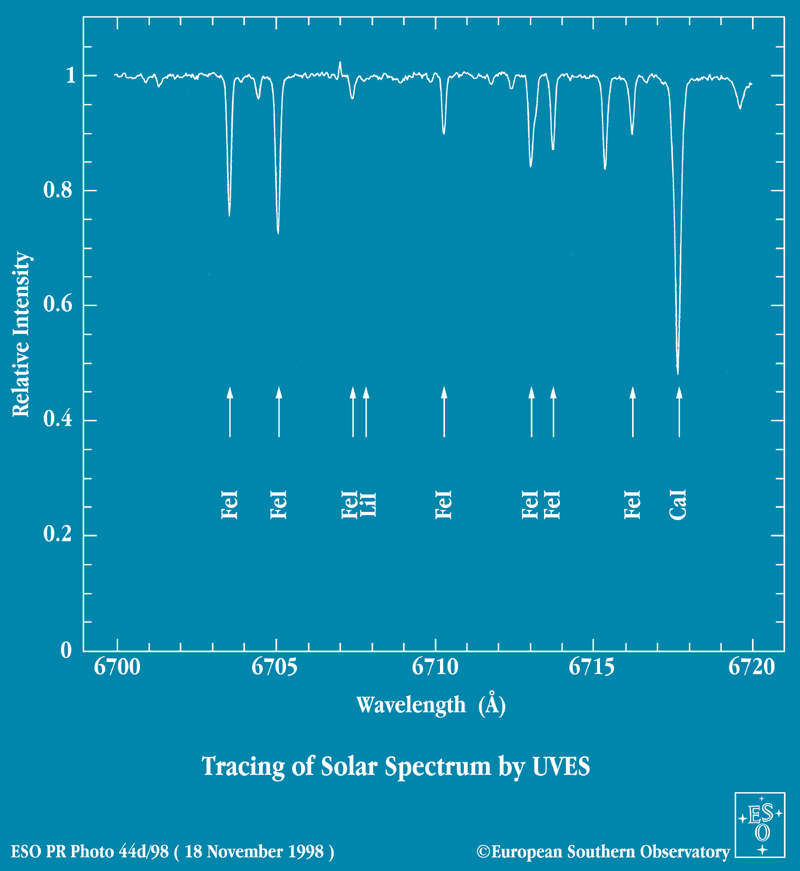
This tiny portion of the solar spectrum tells us
But wait -- look again at the spectrum above. The calcium absorption line is much stronger than the iron lines. Shouldn't that mean that there are more calcium atoms than iron atoms in the solar atmosphere?
This is a complicated and technical subject -- you could take an entire course on it alone! I'll touch on just the basic outlines here. It turns out that light may be absorbed by a particular atom if two conditions are met:
What does that mean, "the right energy state"? The electrons which orbit nuclei of atoms can move only in a few specific orbits. Small orbits have low energy, and large orbits have high energy.
If a photon with just the right amount of energy passes an atom in its ground state, the atom may absorb it, causing the electron to jump up to a bigger orbit and a higher energy state:
If we shine a photon with slightly more energy past a similar atom in its ground state, the atom won't absorb it, because the photon doesn't have exactly the right amount of energy to push the atom up into its next excited state. Instead, the photon will go right past the atom.
If we keep increasing the energy of photons we shine past the atom, eventually one will have just the right amount of energy to raise the atom from its ground state to a second excited state. This photon, too, will be absorbed:
So, if you see absorption lines from some particular element -- say, iron -- in a star's spectrum, then it means two things:
and
Below are spectra of four stars. All of them have hydrogen in the outer atmospheres, which absorbs light at a series of wavelengths: at about 4860 Angstroms, 4340 Angstroms, 4100 Angstroms, and so on. This series of lines is called the Balmer series. It is formed when atoms which are in the first excited state absorb a photon and jump up to a higher excited state.
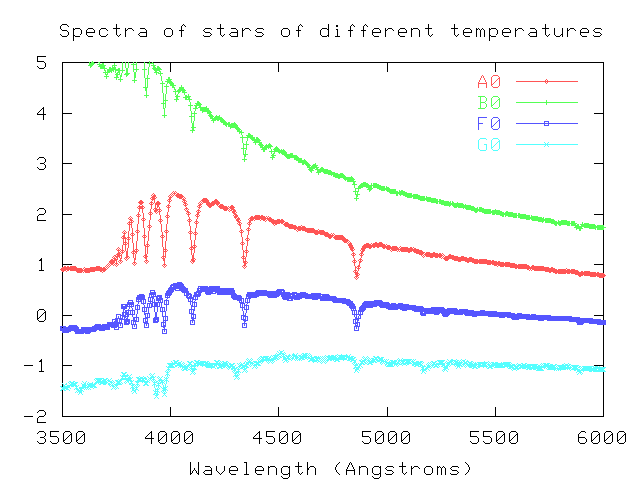
The strength of the lines changes because the temperatures of the stars are different:
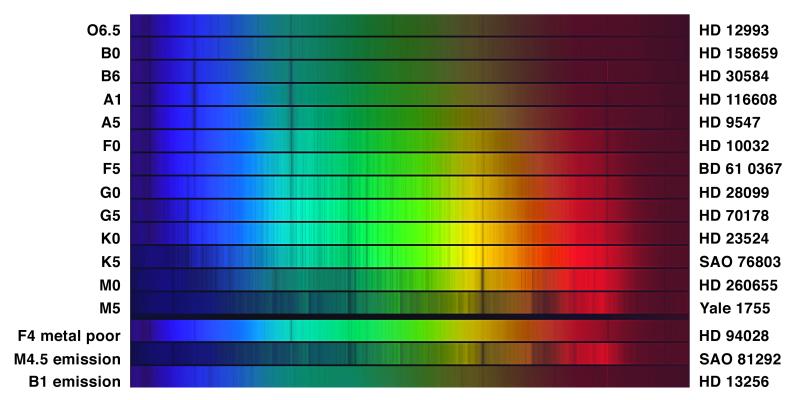
At the turn of the century, astronomers at Harvard Observatory classified stellar spectra by the strength of various absorption lines. They named the classes with letters: A, B, C, etc. Later on, other astronomers figured out that the appearance of the lines depended on the temperature of the stars, and re-arranged the order of the names to go in order by temperature:
      hot                                    cool

       O    B    A    F    G    K    M    L    T
Or, in rather more detail over the limited spectral range from about 3900 to 4700 Angstroms,
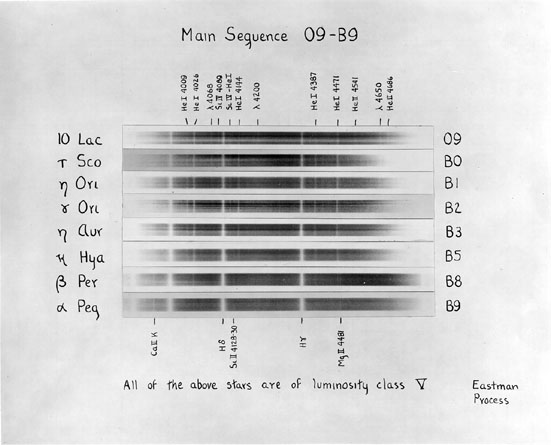
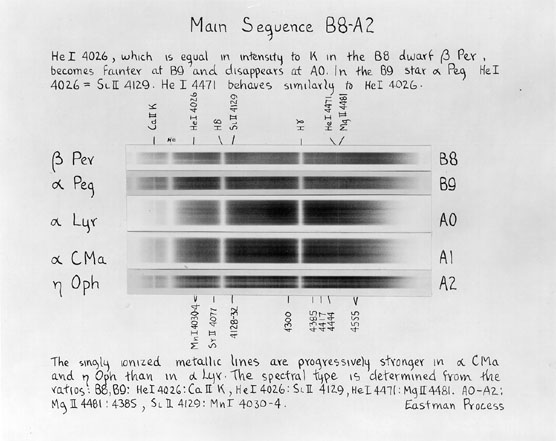
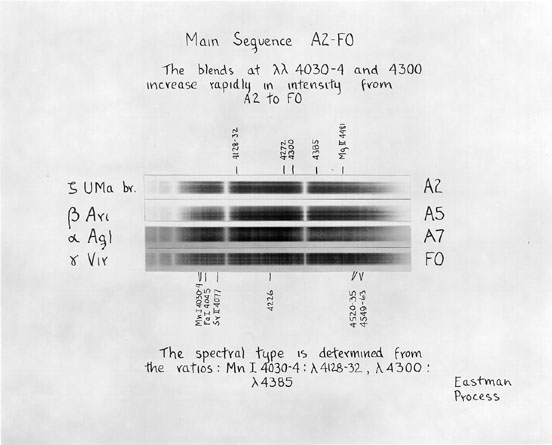
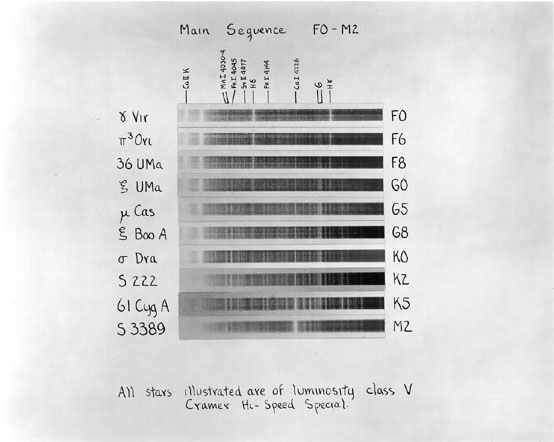
The figures above come from An Atlas of Stellar Spectra with an Outline of Spectral Classification by Morgan, Keenan, and Kellman. Originally published by the University of Chicago press in 1943, you can find the complete contents on-line at http://nedwww.ipac.caltech.edu/level5/ASS_Atlas/MK_contents.html
For more information
Copyright © Michael Richmond.
This work is licensed under a Creative Commons License.