 Copyright © Michael Richmond.
This work is licensed under a Creative Commons License.
Copyright © Michael Richmond.
This work is licensed under a Creative Commons License.
If you look carefully at stars in the sky, you'll see that they aren't all the same color. Some are reddish, some yellowish, some blueish. The effect is subtle, but you can see it if you try.
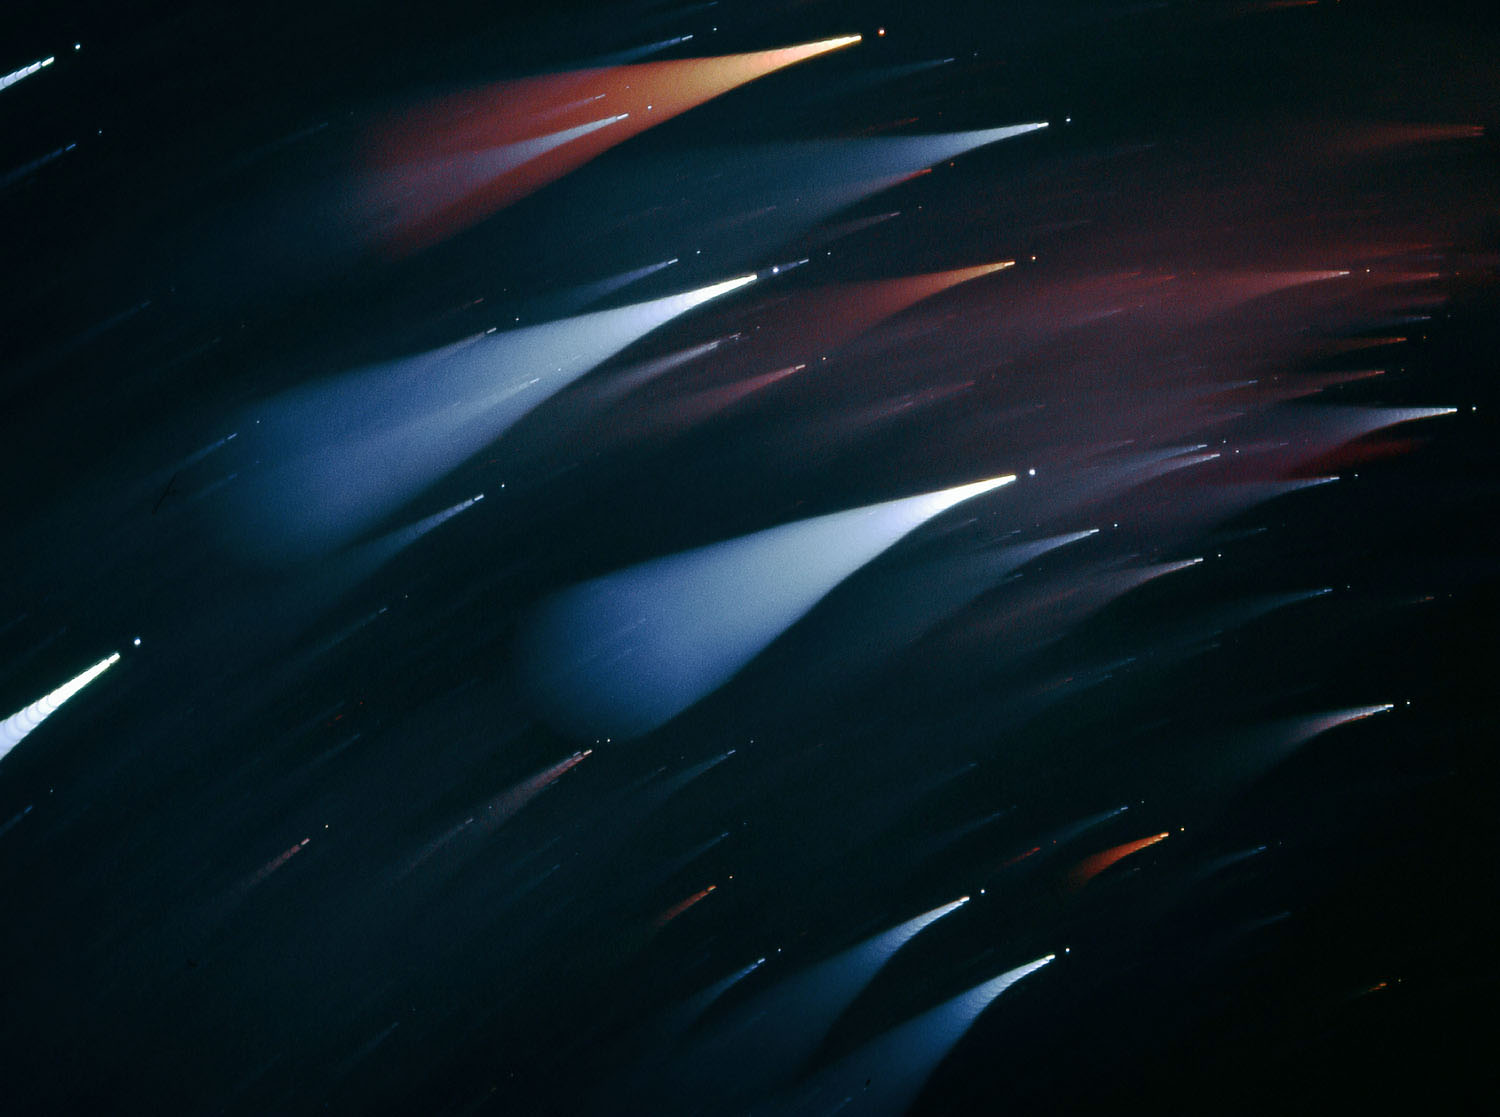
Taken from
APOD.
Credit and Copyright:
Stefan Seip
Is there some way we can use these colors to determine properties of the stars?
The Hipparcos satellite measured the distances to hundreds of thousands of stars. It also measured the magnitude of each star through two filters:
Now, astronomers call the difference between the B and V magnitude of a star its (B-V) color, or sometimes just "color" for short. Remember how magnitudes work: large numbers mean "faint", and small numbers mean "bright". What is the "(B-V) color" of a hot star?
Hot stars emit most of their light at short wavelengths: in the blue and ultraviolet. So when we measure their light through filters, we see
And the result is that (B-V) is (small - large) = negative. So very hot stars have negative (B-V) colors.
On the other hand, cool stars emit most of their light in the red part of the spectrum.
So when we measure their light through filters, we see
And the result is that (B-V) is (large - small) = positive. So cool stars have positive (B-V) colors. In short,
    (B-V) color            temperature
    ----------------      ------------
    small   (< 0.5)          hot

    big     (> 2.0)         cool
To recap, Hipparcos measured three quantities for each star:
We can use the inverse square law to turn the distance and apparent brightness into
"Absolute magnitude" is defined as the magnitude a star would have if we picked it up and placed it exactly 10 parsecs away from the Sun; that's very roughly as close as the star Vega, and a bit more distant than the Sun's closest neighbors. Astronomers long ago worked through all the math to come up with a formula which converts apparent magnitude and distance into absolute magnitude:
(abs mag M) = (app mag m) + 5 - 5 * (log d)
where
Let's practice converting apparent magnitudes to absolute magnitudes.
    Q:  The star Deneb, in Cygnus the Swan, has an apparent
        magnitude m = 1.26 and a distance d = 500 parsecs.
        What is its absolute magnitude?


    Q:  The Sun has an apparent magnitude m = -26.5.  What is
        its absolute magnitude?  (You must convert its distance
        into parsecs -- see Appendix A).
What can we do with this information? Hmmm. Is there any relationship which might suggest a fundamental physical property of the stars? Well, we can try plotting various quantities against each other, and looking for something "meaningful."
Let's try plotting color on the horizontal axis, and apparent V magnitude on the vertical axis.
Hmmm. That looks almost like random scatter, although it does show that there are lots of stars with (B-V) colors around 0.5 (which corresponds to temperatures around 6000 or 7000 Kelvin).
But wait -- since we know the distance to each star, we can convert its apparent magnitude (how bright it appears in our sky) to its absolute magnitude (how much power it actually radiates). Let's try plotting absolute V magnitude against color.
Aha! When we look at the stars in this way, most of them (over 90%) fall along a diagonal strip running from upper left to lower right. This curious fact was first noticed back in the early 1900s by two astronomers, American Henry Norris Russell and Dane Ejnar Hertzsprung. As a result, this sort of graph is called a Hertzsprung-Russell diagram, or "HR diagram" for short.
Norris and Russell called the diagonal strip along which most stars fall the main sequence.
What does this mean?
It makes more sense if we convert the units into some equivalents: we can turn
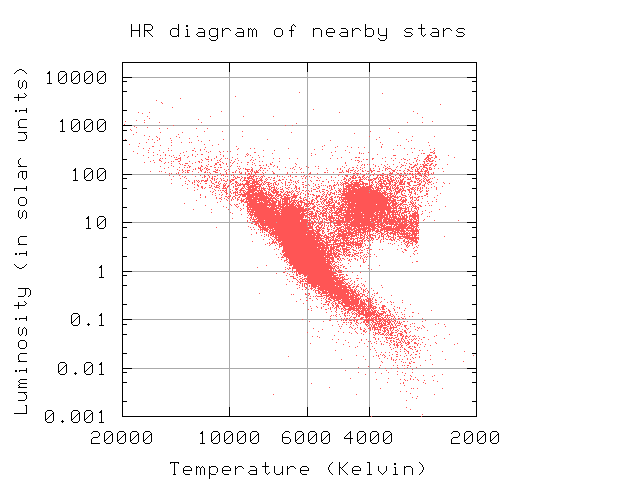
No, your eyes aren't failing. There are sharp edges in the diagram above, due to the approximation I used to convert color into temperature.
Once again you may ask: what does this mean?
What it means is that most stars are roughly the same size. Remember that hot objects radiate more light than cool ones. If two objects are the same size, then their luminosities are simply
                                              4
    Luminosity (A)      [  Temperature (A)   ]
  -----------------  =  [ ------------------ ]
    Luminosity (B)      [  Temperature (B)   ]
Use this rule to figure out:
   Q:  Where would a star of the Sun's size,
          but T = 15,000 K, fall on the HR diagram?

   Q:  Where would a star of the Sun's size,
          but T =  2,800 K, fall on the HR diagram?
You can see that the main sequence can be explained mostly due to differences in temperature: hot stars fall on the upper left, cool stars on the lower right portion of the sequence. But that doesn't tell the whole story: stars hotter than the Sun are apparently a bit larger than the Sun, and cooler stars are a bit smaller. These differences in size are only factors of two or three.
Hmmm. This tells us one thing -- most stars are roughly the same size as the Sun -- but leaves us asking two more questions:
Copyright © Michael Richmond.
This work is licensed under a Creative Commons License.