
 Copyright © Michael Richmond.
This work is licensed under a Creative Commons License.
We can represent waves using equations:

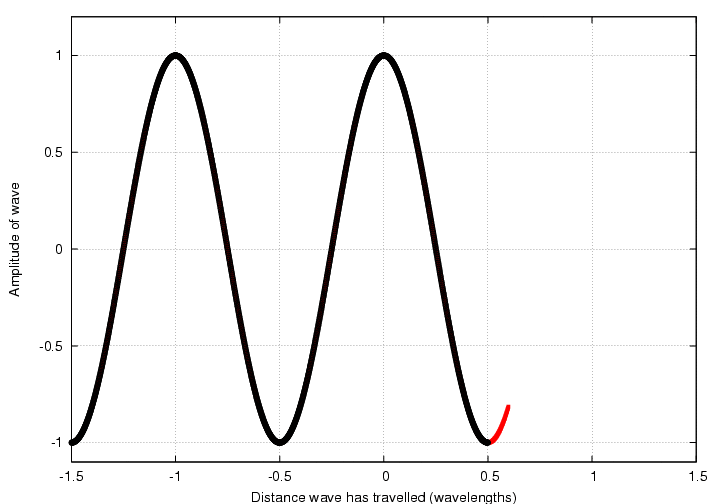
We can represent waves using pictures of wiggling lines:
Today, we will come up with a new way to represent waves: by little clocks.
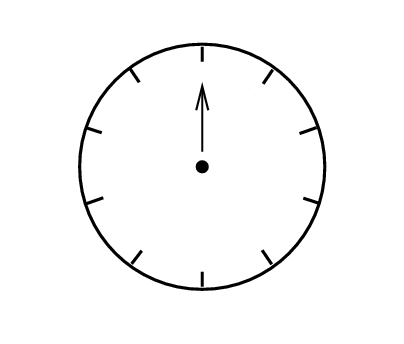
More specifically, we will use
Let me illustrate with an example: watch as one particular wave propagates to the right:
Now, watch again as I put one of the little phasor clocks next to the graph.
The hand on the little clock rotates as the wave progresses -- the position of the hand says something about the phase of the wave. In fact, there are several ways to interpret the position of the hand.
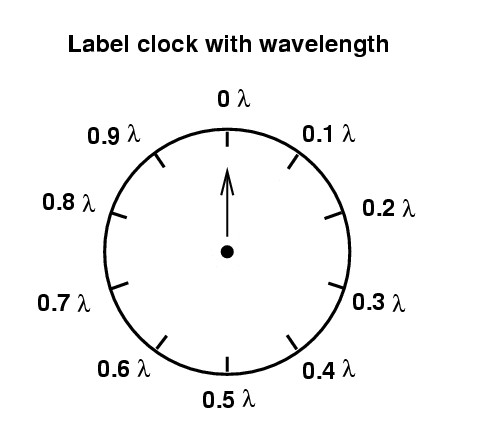
The position of the hand tells us how far the wave has moved since it was at its maximum positive amplitude.
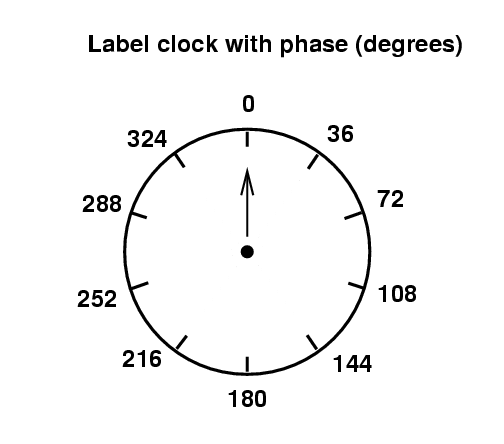
The position of the hand tells us the angular position of the wave -- in other words, the value of all the stuff inside the sine or cosine function.

Of course, we can choose to think of this angular position in terms of degrees, or in terms of radians.
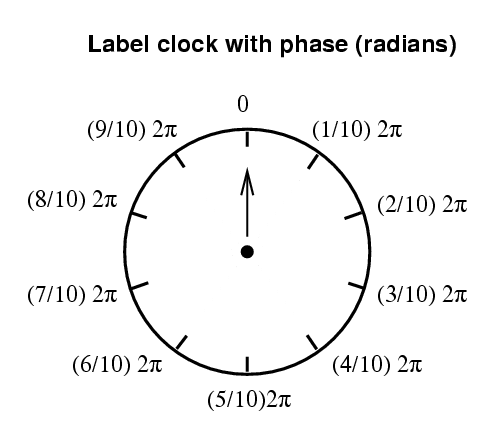
In summary, a phasor uses the hand of a little clock to represent the wave.
So, suppose someone gives us two waves and asks, "What happens when these waves meet? How do they interfere?"
One way to answer the question is to write down equations and use trigonometric identities and algebra ...

Another way to answer the question is to draw diagrams showing each wave function
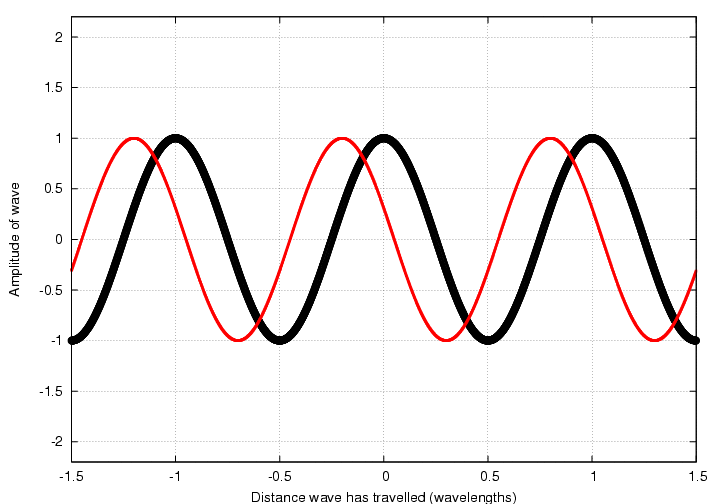
then read the values for each function from the graph, add them, and plot the result:
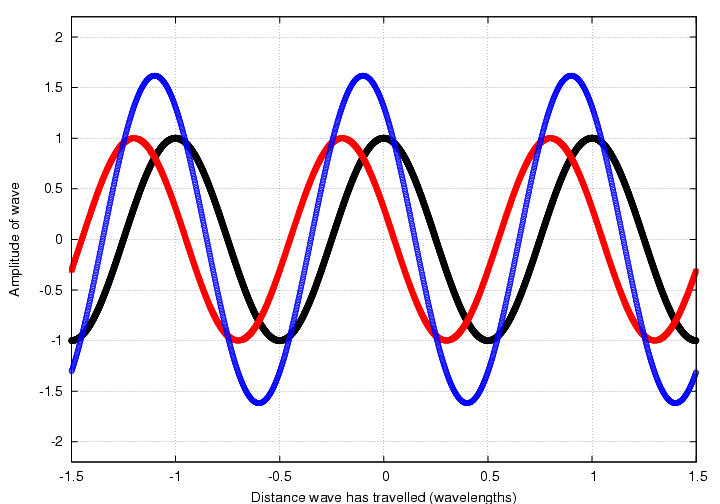
But perhaps the quickest and easiest way to do this is to draw little phasor clocks for each of the waves:
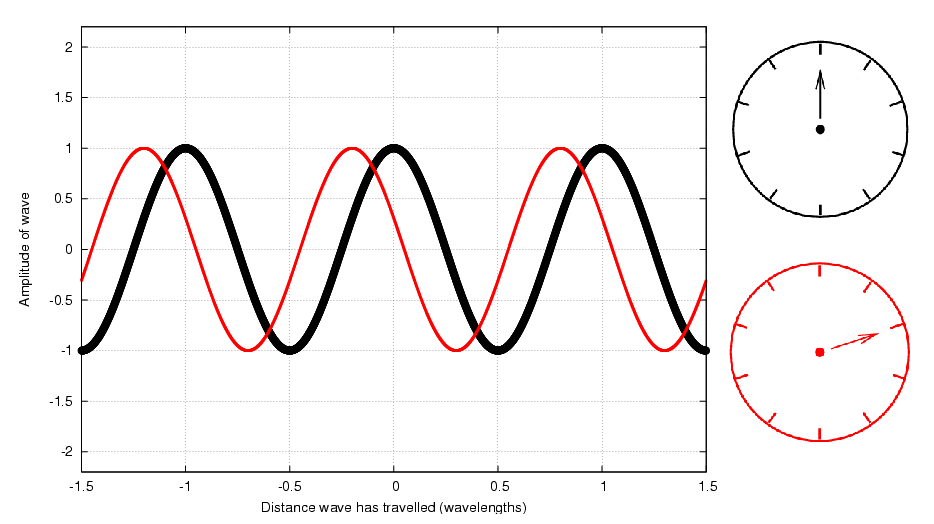
and then use the clocks themselves to do the addition. There is a very simple way to find the sum of two waves using phasors: just treat the little hands as vectors and add them:
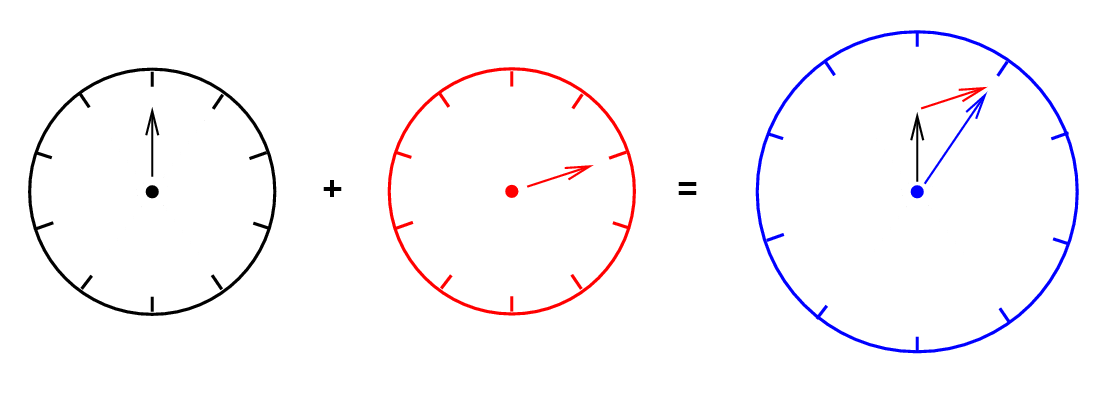
  Q:  Call the amplitude of the black wave A.
      What is the amplitude of the wave
      which is the sum of the red and black waves?


  Q:  What is the phase of this sum relative to the
      black wave?
Let's check your answers by looking at the wave pictures:

 Copyright © Michael Richmond.
This work is licensed under a Creative Commons License.