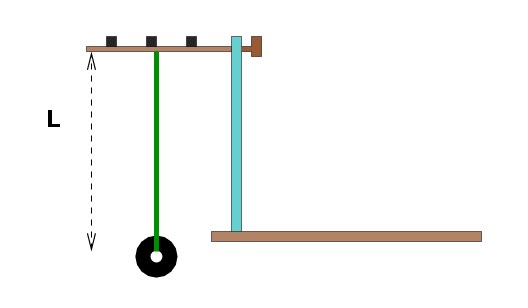
Motion of a simple pendulum

Measure properties of a simple pendulum and perform
some graphical analysis.
- Set things up so that a 50-gram mass hangs from a long piece
of string. Run the string through one of the holes in
the 3-knob bar, and wrap one or two loops around a knob
to hold it in place.
Make sure that you can swing the mass freely when the string
is 110 cm long.
- Make measurements with at least 4 different lengths L:
- one between 7 and 12 cm
- one between 20 and 25 cm
- one between 40 and 50 cm
- one between 95 and 110 cm
Measure L from the top of the string to the middle of mass.
Measure the time to swing back-and-forth 10 times with
small angular amplitude: start at an angle of about
10 degrees from the vertical. Make 2 trials at each length.
- Make a neat table with your results,
showing the average period, and uncertainty in period, in each case.
- Add two columns to your table:
square of the average period,
and uncertainty in square of average period, in each case.
- Create graph A: period vs. length.
Is this a straight line?
- Create graph B: period-squared vs. length.
Is this a straight line?
- Determine the slope of line connecting your measurements in graph B
and the uncertainty in the slope.

