What is the value of g? You may think it is 9.8 m/s2, or maybe 9.81 m/s2; but the actual value depends on a number of factors. The latitude at which the measurements are made affects the value, as does the altitude, and even local topography. The differences are small, but they can be detected with a very careful experiment.
So, what's the local value of g in Rochester? Let's find out.
Once a large number of values have been entered into the spreadsheet, we will turn out attention to using this dataset to measure the local value of g. How?
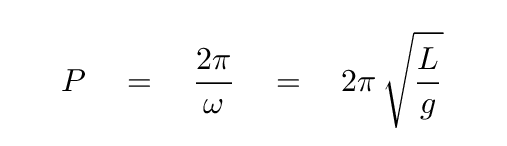
Well, we know that the period of a pendulum is related to its length, and to g.
If one squares both sides of this equation, one will find
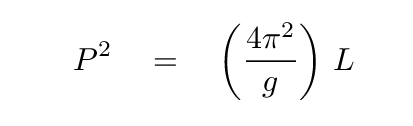
So, if we combine all our measurements onto a single graph, and we choose the axes of that graph properly ... then the slope of the line on that graph will be related to the local value of g.

Your job:
Make a copy of all the data from the class spreadsheet. Use it to create a graph in the format shown above. Determine the slope of the line which best fits the data, and estimate an uncertainty in that slope. Then use that slope (and uncertainty) to compute a value (and uncertainty) for g, the local acceleration due to gravity.
You must submit your graph, and your calculations of "g", into