 Copyright © Michael Richmond.
This work is licensed under a Creative Commons License.
A cart rolling down a track
I raised one end of a long track slightly, so that it was
tilted from left to right.
Then I placed a small cart on the track near the top,
released it, and measured how far it rolled
during several intervals.
Here is a table of my measurements.
  Time (seconds)              Distance rolled (cm)
                        1       2       3        avg      uncert
-------------------------------------------------------------------
    0.5 +/- 0.005       7.0     6.5     7.3             +/-

    1.0 +/- 0.005      24.1    26.0    24.9             +/-

    1.5 +/- 0.005      62.2    54.1    59.3             +/-

    2.0 +/- 0.005     107.2   101.1    99.7             +/-

    2.5 +/- 0.005     153.3   162.8   157.6             +/-

    3.0 +/- 0.005     230.2   228.1   233.0             +/-

    3.5 +/- 0.005     320.9   318.5   312.4             +/-
-------------------------------------------------------------------
How did I compute the uncertainty
in the average distance? I used the methods described in
my guide to uncertainties to calculate the
standard deviation from the average distance.
Your job:
- Using consecutive measurements,
figure out the average velocity between each
pair of positions.
You should end up with 6 values for average velocity
(and the time for each).
Make a
neat table with the average velocities.
- Using your average velocities,
figure out the average acceleration between
each pair of consecutive velocities.
You should end up with 5 values for average acceleration
(and the time for each).
Make a
second neat table with the average accelerations.
- Each person in your group should now make a graph.
- One person should graph position versus time
- One person should graph average velocity versus time
- One person should graph average acceleration versus time
Use the same scale for time on each graph; the vertical
scale will have to change, of course.
- Examine the graphs.
Describe the shape of each graph with words,
and with an equation. Try to include
actual values for as many coefficients as you can.
- Estimate the acceleration of the cart in two ways:
- use the graph of "velocity versus time" to determine the
acceleration of the cart, with an uncertainty
- use your graph of "acceleration versus time"
and/or your table of average accelerations
to determine the
acceleration of the cart, with an uncertainty
Do the two values agree within the uncertainties?
Everyone should get this far. If you have time, keep going as
far as you can below.
- If you drop a cart, it falls through the air with
an acceleration which is about g = 9.8 m/s2.
How does that compare to the acceleration of
my cart as it rolled down a ramp?
Be quantitative!
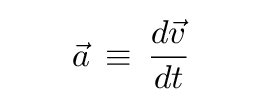
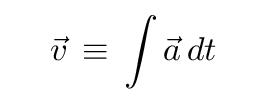
- The definition of velocity is
 So, turning this around, we can find velocity by
 Assume that the acceleration of the cart
does not change with time -- is this consistent with your data?
Integrate to find the velocity ... and don't
forget the constant of integration!
Write down an equation for velocity as a function
of time.
Compare this equation to the information on
your graph of velocity versus time.
- You can also integrate velocity to find position as a function
of time. Do so. Write down an equation for position as
function of time. Does it agree with my measurements
and with your graph?
- What was the angle of my ramp?
(No, I haven't told you how to do this yet ...
so don't worry if you don't know how. )
- What is the percentage uncertainty in the
largest value of position?
What is the percentage uncertainty in your
largest computed value of average acceleration?
What is the percentage uncertainty in your largest computed
value of average acceleration?
(Hint: if you don't know how to
handle the combination of two quantities,
each with uncertainties, in a division,
check
my guide to uncertainties
at
http://spiff.rit.edu/classes/phys273/uncert/uncert.html"
 Copyright © Michael Richmond.
This work is licensed under a Creative Commons License.


 Copyright © Michael Richmond.
This work is licensed under a Creative Commons License.