 Copyright © Michael Richmond.
This work is licensed under a Creative Commons License.
Copyright © Michael Richmond.
This work is licensed under a Creative Commons License.
Even if you don't know the exact for of some potential energy function, you can still figure out quite a bit just by looking at a graph showing potential energy as a function of position. Just remember:
     The force associated with a potential energy is equal
           to (-1) times the slope at any position.
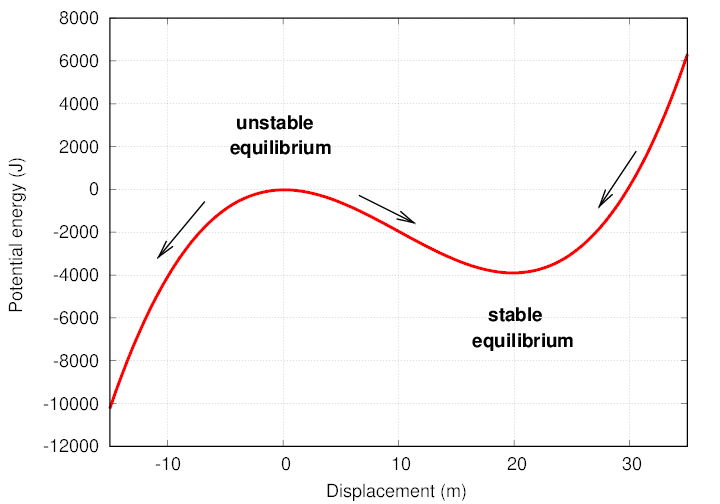
Consider the graph below. Where does the force equal zero?

We call a location where the force on an object is zero an equilibrium point. There are three obvious equilibria in the graph above.
Suppose we place an object at an equilibrium point, hold it motionless for a moment, and then release it. What will happen? It should simply remain at its location. Not very interesting.
However, suppose that we give the object a little nudge to one side, so that it moves a tiny bit. What will happen then? It depends on the nature of the non-zero force that now acts upon it.
Consider the dip in potential energy near x = 3, which at which the slope, and therefore the force, is zero.
  Q:  What is the direction of the force at x = 2?

  Q:  What is the direction of the force at x = 4?

  Q:  Is this dip at x ≈ 3 a stable, or an unstable, equilibrium?
There's another way to identify equilibria as stable or unstable:
By the way, the potential energy function shown in this example has a form I find rather interesting.
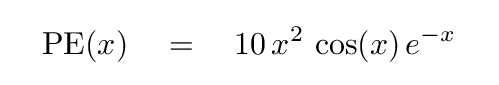
  Q:  Can you list the locations of the first three equilibria
          for this potential function, to three decimal places?
If you can, I suggest you submit your work for an extra credit project.
Copyright © Michael Richmond.
This work is licensed under a Creative Commons License.