 Copyright © Michael Richmond.
This work is licensed under a Creative Commons License.
Copyright © Michael Richmond.
This work is licensed under a Creative Commons License.
We will often make measurements in this class -- time, distance, mass, etc. In most cases, our measurements will have a significant uncertainty. One way to figure out the size of this uncertainty is to make repeated measurements and compare the values.
For example, suppose that we watch as a cart rolls down a ramp which is exactly L = 1.0 meter long.
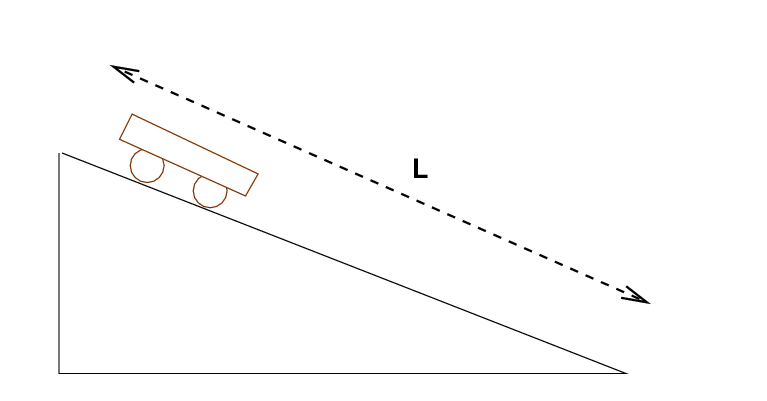
We make 4 trials, and measure the following times, all in seconds.
4.23 4.29 4.19 4.27
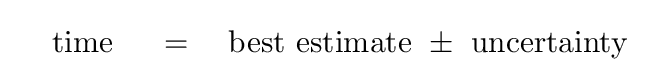
We can describe the results in a compact way by stating a "best estimate" at the time, together with an "uncertainty":
But how do we determine the "best estimate"? And how do we determine the "uncertainty"? This turns out to be complicated; depending on the details of the measurements, one method might be better than another. There are people who devote their careers to studying statistical properties of various measurements.
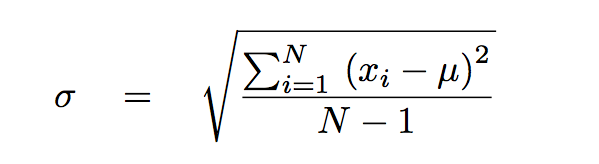
In this class, we'll use relatively simple methods which are common in the physical sciences. They may be less sophisticated than some methods you'll see in later courses, but they will in general yield sensible results. We will calculate the mean μ value and the standard deviation from the mean σ (sometimes called "sample deviation from the mean") from our measurements.

Look at our measurements again:
        4.23     4.29     4.19     4.27


   Q:  Describe these measurements in a compact manner.
Right.
Another way to characterize a set of measurements is to describe the "percentage uncertainty" or "fractional uncertainty" in the data.
   Q:  What is the fractional uncertainty in these times?


   Q:  What is the percentage uncertainty in these times?
Right. The fractional uncertainty is 0.010, and the percentage uncertainty is 1.0 percent. Good.
Okay, now let's put these statistics to work. You made some measurements of the time required for a mass hanging from a spring to oscillate 20 times.
But what if you then use a measurement with uncertainty to compute a further quantity? How much uncertainty will that output quantity have?
For example, you know that
                              displacement
    average velocity   =     ---------------
                              time interval
but what if the time interval has a known uncertainty? That must lead to some uncertainty in the computed velocity -- but how?
It turns out that this subject is very important in many branches of experimental sciences, including physics. You will be using quantities with uncertainties to compute results over and over and OVER in this course, and in the next course, and in almost all your physics courses. The topic of propagation of errors is a big one. I'm not going to spend a great deal of time explaining the theory behind the formulae we'll use; if you're interested, you should take a good mathematics course.
Professor Lindberg has written a very nice guide to this subject:
As you will see if you read his guide, there are at least two ways to deal with uncertainties as you go through some set of calculations: the simple approach and the sophisticated approach using standard deviations. The two methods will often yield similar results, so in this case, we're going to stick with the simple method. You should be aware, however, that later on in your physics career, you may need to switch to the more sophisticated approach.
You can find the simplified rules for the propagation of uncertainties in this document:
Let's try out these rules to determine the velocity of the cart. Since the velocity depends on a division, we use the division rule:
                                      L
           velocity         v   =    ---                (meters per second)
                                      t


   uncertainty in velocity          dL   dt
   -----------------------      = ( -- + -- )           (pure fraction)
            velocity                 L    t


                                    dL   dt
   uncertainty in velocity      = ( -- + -- ) * ( v )   (meters per secon)
                                     L    t
Okay, go ahead and try:
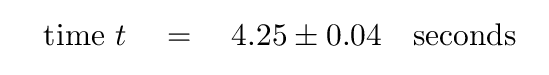
               distance   L    =     1.0              meters

               time       t    =     4.25  +/- 0.04   seconds


      Q:  What is the best estimate for the velocity of the cart?


      Q:  What is the percentage uncertainty in the velocity?


      Q:  Write the velocity as a best estimate, plus an uncertainty.
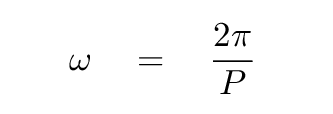
You just calculated the average period for your measurements, and its uncertainty. The period P is related to the angular frequency ω via
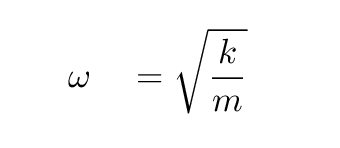
The angular frequency, in turn, is related to the mass of the object m and the force constant k of the spring:
You know how to handle one quantity with an uncertainty .... but what if there are multiple quantities with uncertainties?
For example, we measured the time it took a cart to roll down a ramp. In the earlier calculations, we assumed that the length of the ramp was exactly L = 1.0 meters; in other words, it had no uncertainty.
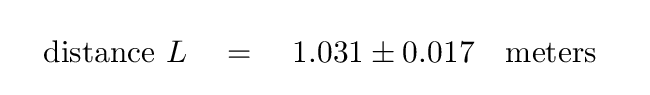
But when we go back to the ramp and measure it carefully, we find a more complicated situation. Three measurements yield the following values for L.
1.012 1.043 1.039
       Q:  Express the length L as a best estimate and
           an uncertainty.
Yup.
So, now both the length the cart travels and the time it takes to move have some uncertainty. How do we compute the uncertainty in the velocity now? Well, just go back to the same rule:
                                      L
           velocity         v   =    ---                (meters per second)
                                      t


   uncertainty in velocity          dL   dt
   -----------------------      = ( -- + -- )           (pure fraction)
            velocity                 L    t


                                    dL   dt
   uncertainty in velocity      = ( -- + -- ) * ( v )   (meters per secon)
                                     L    t
Okay, give it a shot.
               distance   L    =     1.031  +/-  0.017  meters

               time       t    =     4.25   +/-  0.04   seconds


      Q:  What is the best estimate for the velocity of the cart?


      Q:  What is the percentage uncertainty in the velocity?


      Q:  How does the percentage uncertainty in velocity compare
          to the percentage uncertainty in time, or length?


      Q:  Write the velocity as a best estimate, plus an uncertainty.
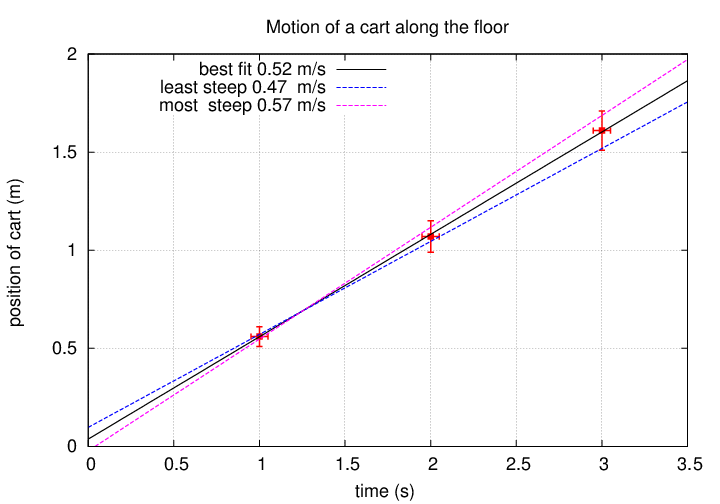
Sometimes, you'll acquire a set of measurements at different times, something like this:
  time (s)              position of cart (m)
 -------------------------------------------
   1.00 +/- 0.05          0.56 +/- 0.05

   2.00 +/- 0.05          1.07 +/- 0.08

   3.00 +/- 0.05          1.61 +/- 0.10
 -------------------------------------------
Suppose we want to figure out the average velocity of the cart ... how can we do it?
Well, there are several methods, but given the choice between the two listed below, you will almost always find the graphical method to be better.
We'll talk about graphs more next time ...
Copyright © Michael Richmond.
This work is licensed under a Creative Commons License.