 Copyright © Michael Richmond.
This work is licensed under a Creative Commons License.
Copyright © Michael Richmond.
This work is licensed under a Creative Commons License.
If you go to
you will be able to access a wealth of information on all the planets which astronomers have found so far, and even some candidate objects which have not yet been confirmed.
I recommend going to the "Confirmed Planets" data access page. From the main page, click on Data -> Confirmed Planets. You should end up at a page that looks something like the interface to a database (because it is):
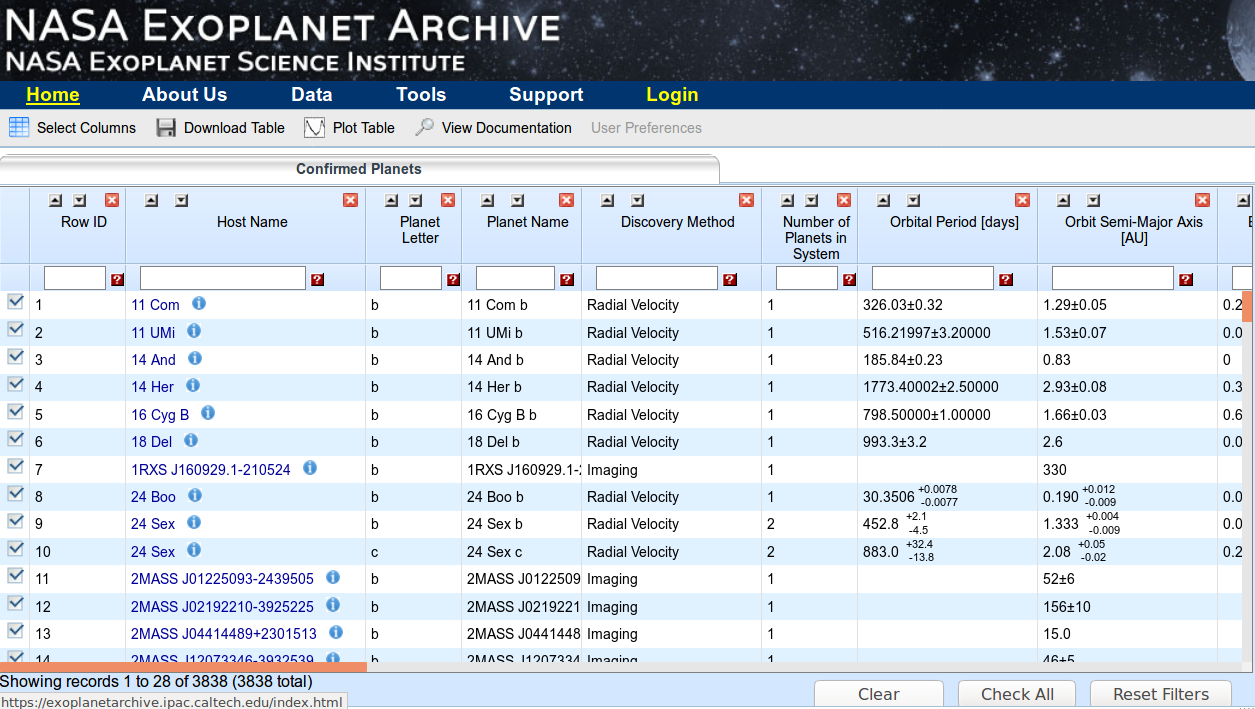
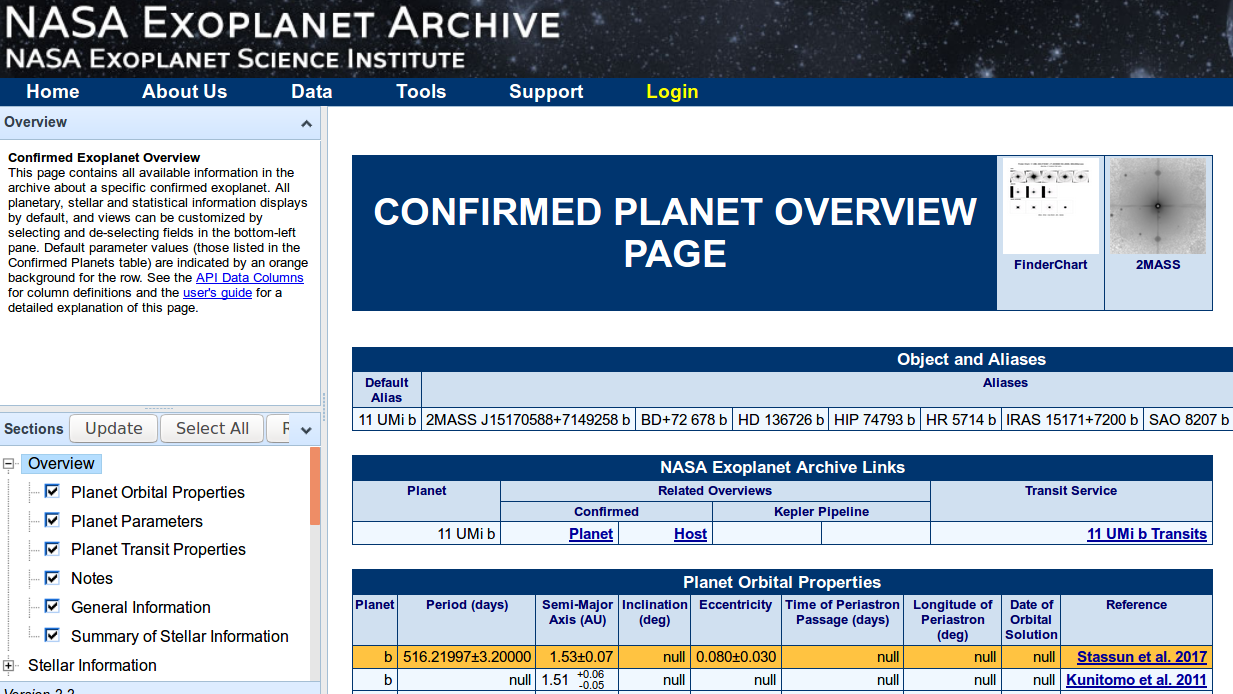
If you want to know more about any particular planet, just click the blue circle with the letter "i" next to the planet's name. A new page will appear, full of data on the planet.
We are going to use the very nice interactive plotting feature of the site today. How does it work? Well, go back to the "Confirmed Planets" page, and click on the Plot Table icon.

Once you are on the plotting page, use the boxes at left to select the quantities you wish to place on the X-axis and Y-axis of your graph, and then click on the Redraw item.
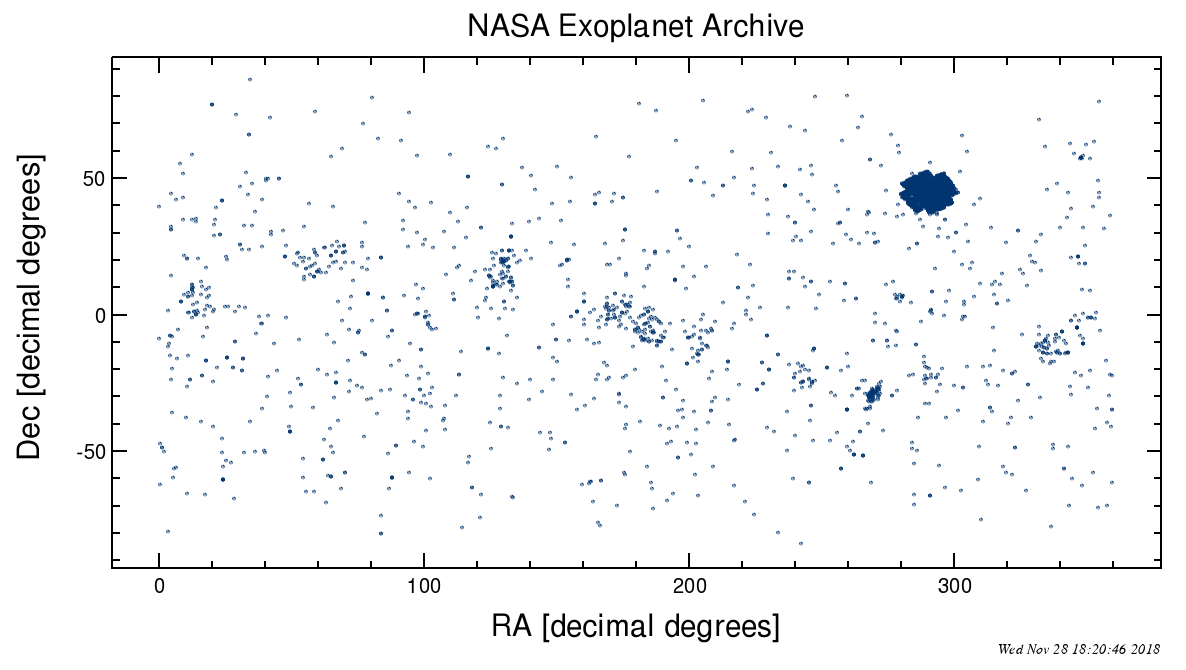
  Give it a try!  Make a graph showing the position of all the
       exoplanets in the sky.

           Choose "RA [decimal degrees]"   for the X-axis.
           Choose "Dec [decimal degrees]"  for the Y-axis.


  Q:  Have we found exoplanets in all regions of the sky equally,
           or have we found many exoplanets in a few small regions?


           Explain.
So, let's examine some of the graphs which show properties of the exoplanets we have discovered so far. I may ask you to figure out what some of these graphs tell us -- so put on your thinking caps!
As we examine various properties of the exoplanets, be careful to watch out for selection effects.
What's a "selection effect?" It's simply the fact that if you look for planets (or other objects) using a particular method, you are most likely to find planets (or other objects) which are easy to find by that method.
For example, suppose you are given the job of measuring the average age of all the people in New York State. There are too many people to ask everyone, so you have to pick some method to select a sample. Your friends Joe and Natalie try to help.
                 Joe                       Natalie
----------------------------------------------------------------

     Goes to a toll booth on          Goes to the obsetrics ward
       the Thruway, and                  of Highland Hospital,
       asks each car's driver            and looks at the chart
       "What's your age?"                of each patient.


     What average age will            What average age will
         Joe find?                       Natalie find?

-----------------------------------------------------------------
Neither Joe nor Natalie will end up with a distribution of ages which accurately represents the TRUE distribution of all people in New York State ... so neither one will end up with an accurate average age.
Keep this in mind as we proceed.
Let's start out by comparing the mass of exoplanets to the period of their orbits.
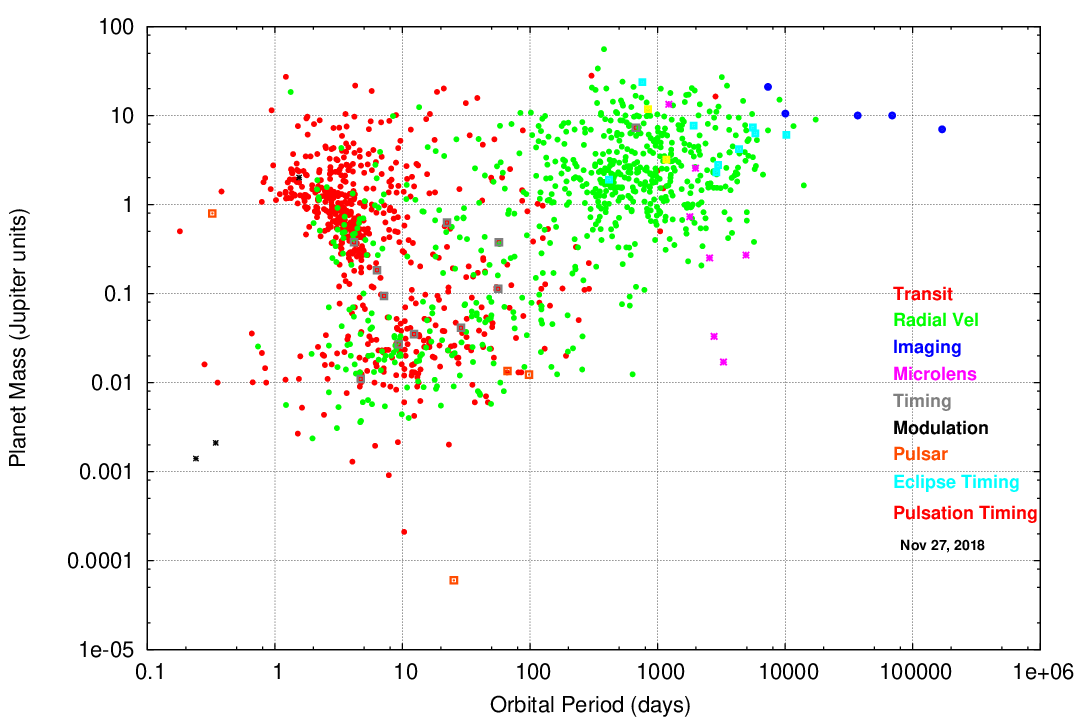
Q: What do we call planets which are in the clump at upper left?
Now, look this graph again. There are two big clumps of planets which are roughly the mass of Jupiter: one at upper left, one at upper right. The color of the dots in these clumps are different.
  Q:  Why are most of the "cold Jupiters" discovered by
          the radial velocity method, instead of the transit method?
There are several reasons, but one of them is simply that it's very hard to find planets with long periods via the transit method.
For example, suppose that you and your friend decide to study a star which may host an exoplanet.
Each person makes one measurement per night. Let's see what each of you can learn as time passes.
Day 1 - 80 Click on the graph to see what happens.
![]()
  Q:  After 80 days, what do the radial velocity measurements
           reveal to us?

  Q:  After 80 days, what do the transit measurements reveal to us?
Day 81 - 130 Click on the graph to see what happens.
![]()
  Q:  After 130 days, what do the radial velocity measurements
           reveal to us?

  Q:  After 130 days, what do the transit measurements reveal to us?
Day 131 - 400 Click on the graph to see what happens.
![]()
  Q:  After 400 days, what do the radial velocity measurements
           reveal to us?

  Q:  After 400 days, what do the transit measurements reveal to us?
Day 401 - 500 Click on the graph to see what happens.
![]()
  Q:  After 500 days, what do the radial velocity measurements
           reveal to us?

  Q:  After 500 days, what do the transit measurements reveal to us?


  Q:  What would happen if the weather was bad, so that
           it was only possible to make one measurement
           every week or so?
Before we move on, let's look at this graph one more time:
  Q:  Where would the Earth fall on this diagram?


  Q:  Have we discovered many planets like the Earth?
Okay, let's move on to examine other properties of exoplanets. Remember that what we see may not always reflect the true distribution of planets in our Galaxy.
Suppose that we consider planet RADIUS on the y-axis, instead of planet mass.
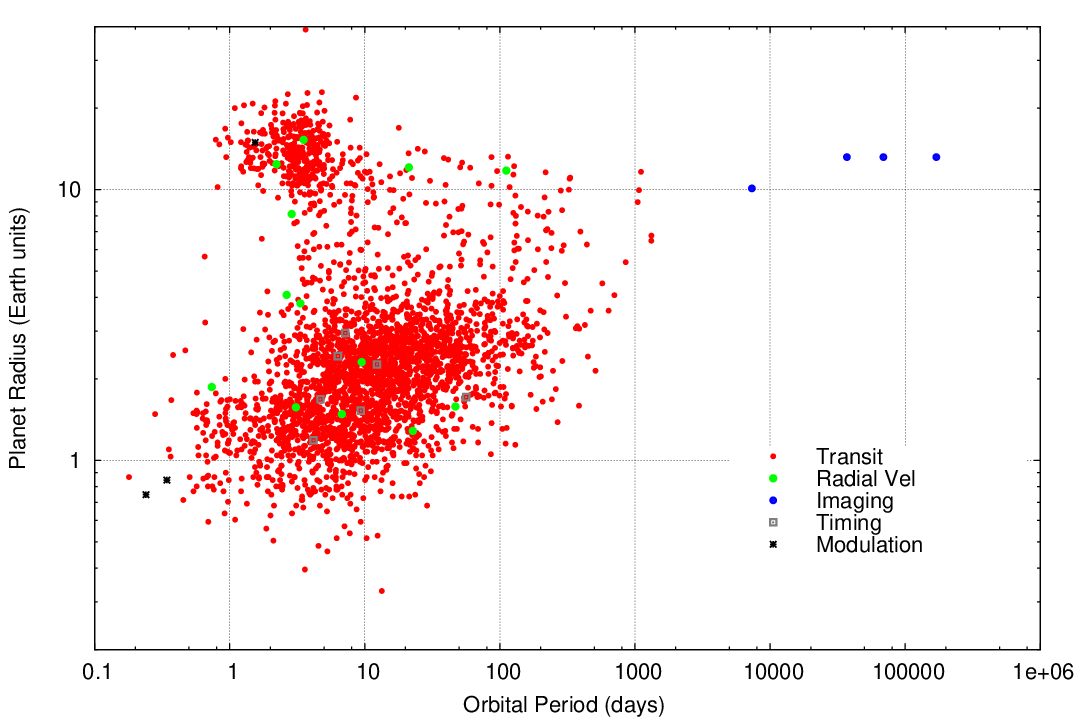
Q: What happened to all the "cold Jupiters" ???
Next, let's try plotting something like "temperature" of planets against their orbital periods. There is a quantity called "temperature" in the Archive, but I have found some rather strange values in that column of the database.
So, I'll compute something that should be related to the temperature: the amount of radiation that each planet receives from its host star, compared to the amount radiation that the Earth receives from the Sun.
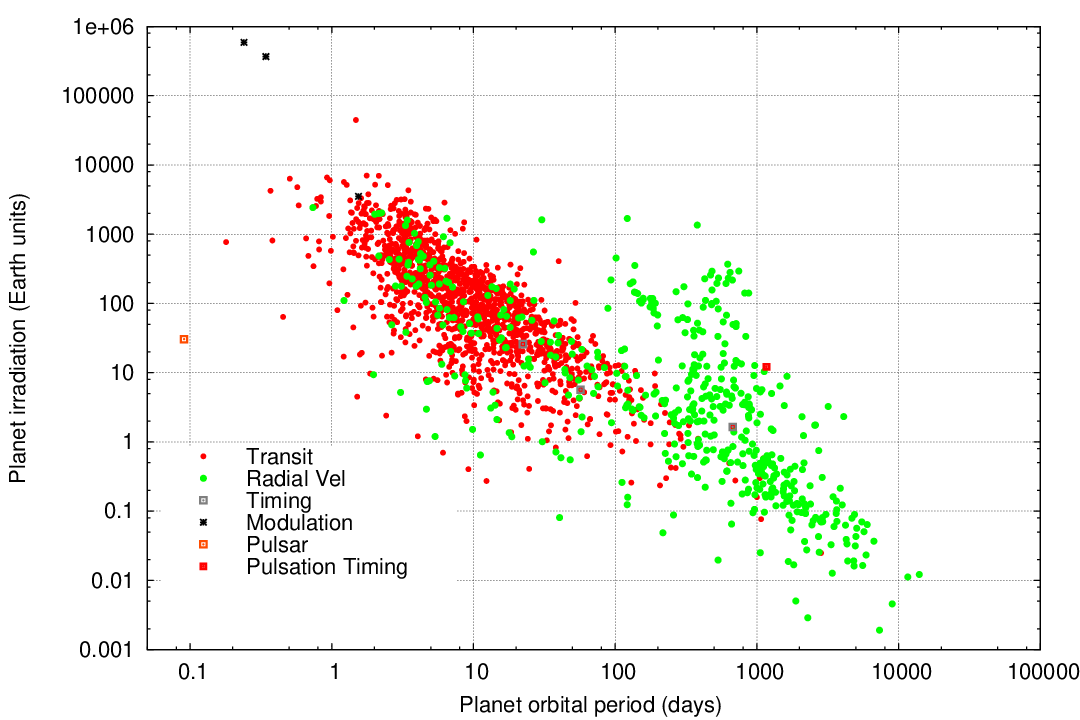
  Q:   Where would the Earth fall on this diagram?


  Q:   Why is there a clump of points above the main
             locus on this diagram?
Next, we'll put the semi-major axis, a, of each planet's orbit on the Y-axis, and the period, P, on the X-axis.
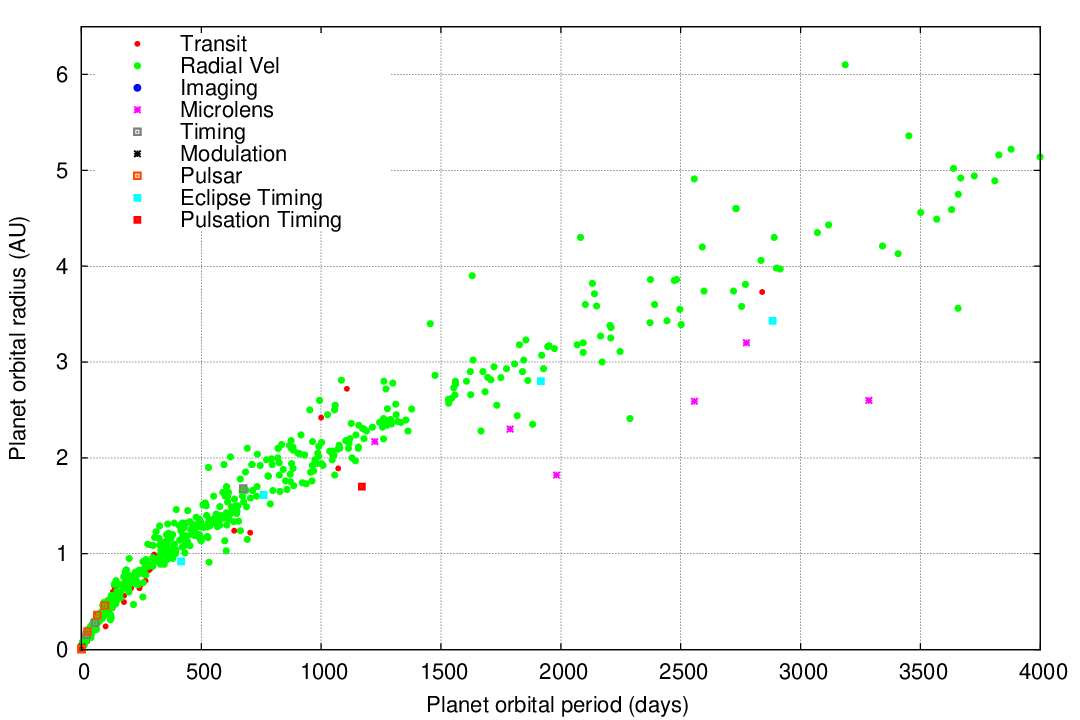
  Q:  Do you see a straight line on this graph?


  Q:  SHOULD you see a straight line on this graph?


  Q:  What sort of relationship SHOULD you see on this graph?
Yes, that's right. As Mr. Kepler figured out long ago, there should be a connection between the size of a planetary orbit and the period of that orbit; but the relationship isn't linear. Kepler found that for planets in our own Solar System,
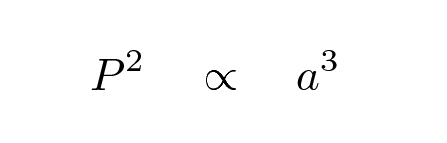
Okay, fine. Let me draw a line showing Kepler's Third Law on the graph.
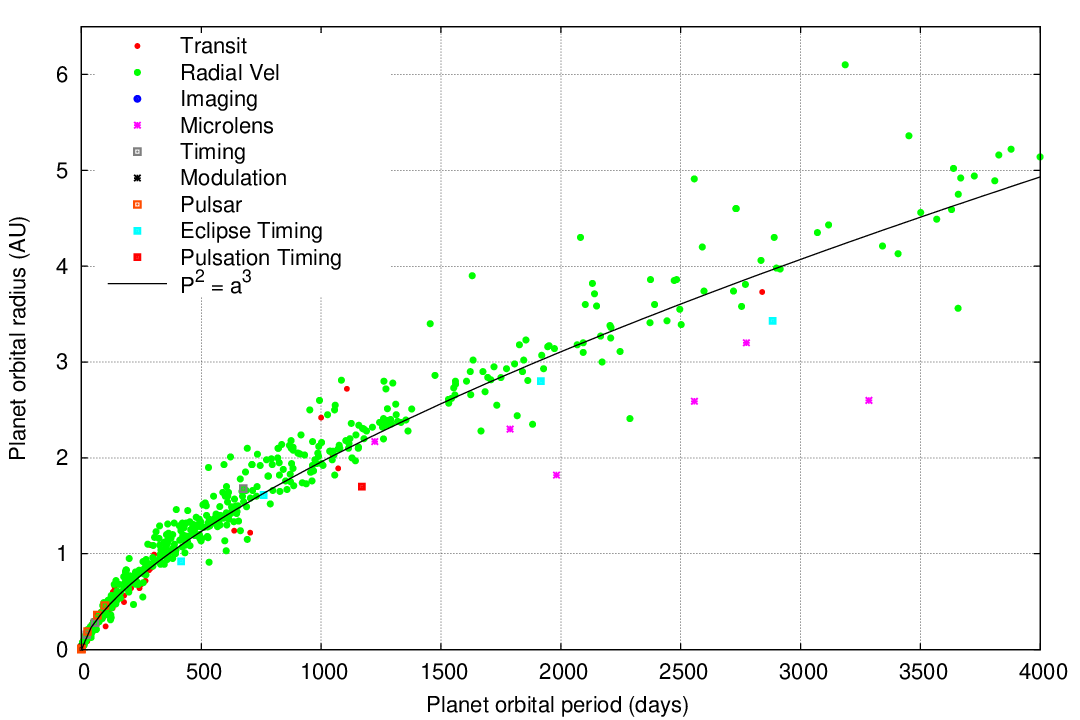
Excellent! It appears that Kepler's Third Law applies to the orbits of planets around other stars.
But -- wait a minute. Most of the planets lie along the line, or very close to it, but some do not. Look at the planets with period around 2500 days. Most have orbits with a semi-major axis of about 3.5 AU, but one planet has a much larger orbital radius -- about 5 AU -- and another has a much smaller orbital radius -- only 2.5 AU.
  Q:  Why would one planet have a much larger orbital radius,
             and another planet a much smaller orbital radius?
The planet with the larger orbital radius is moving around a much longer orbital path in the same period of 2500 days. That means that it must be moving faster than the other planets ... because its star is pulling on it with a larger gravitational force!
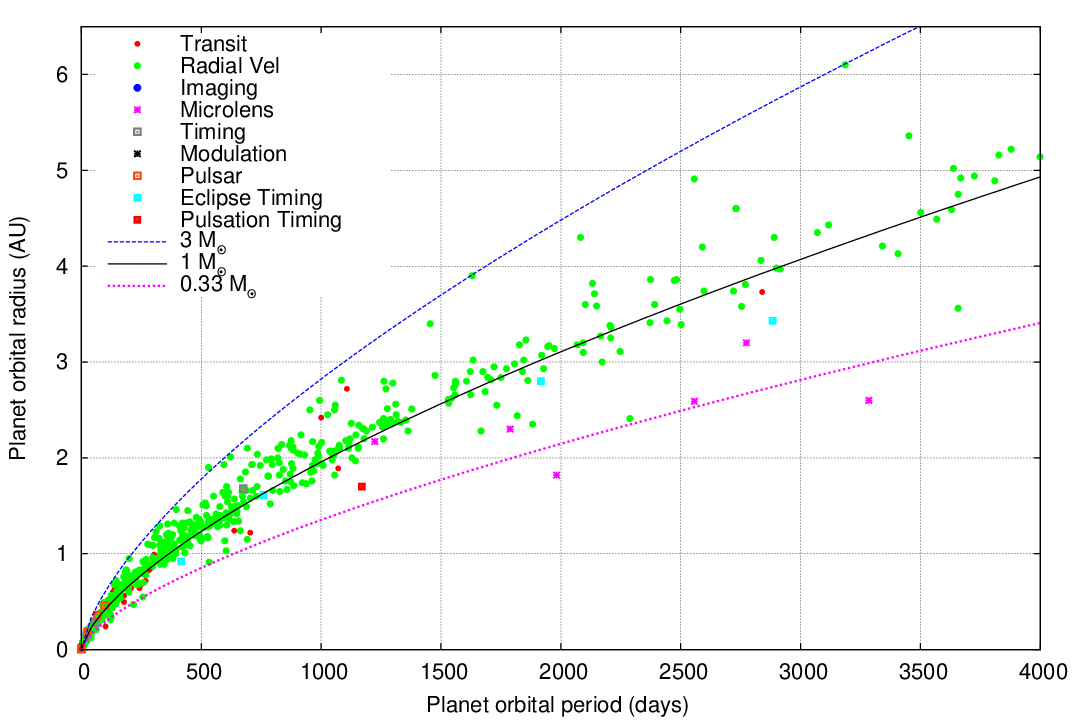
Remember this other form of Kepler's Third Law?
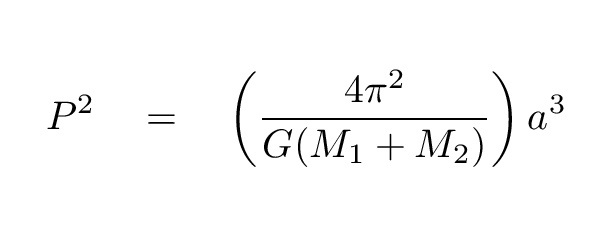
If the host star of an exoplanet has the same mass as the Sun, then the planet's orbit will lie exactly on the same relationship as the planets in our own Solar System. But if the host star is more massive, an exoplanet orbiting it will lie above the line; if the host star is less massive, the exoplanet will fall below the line.
Finally, let's try to figure out something about the physical structure of exoplanets themselves. Let's put mass on the Y-axis, and radius on the X-axis.
  Q:  If we compare mass and radius of each planet,
          what physical property might we learn?
That's right: we might learn something about the density of each planet.
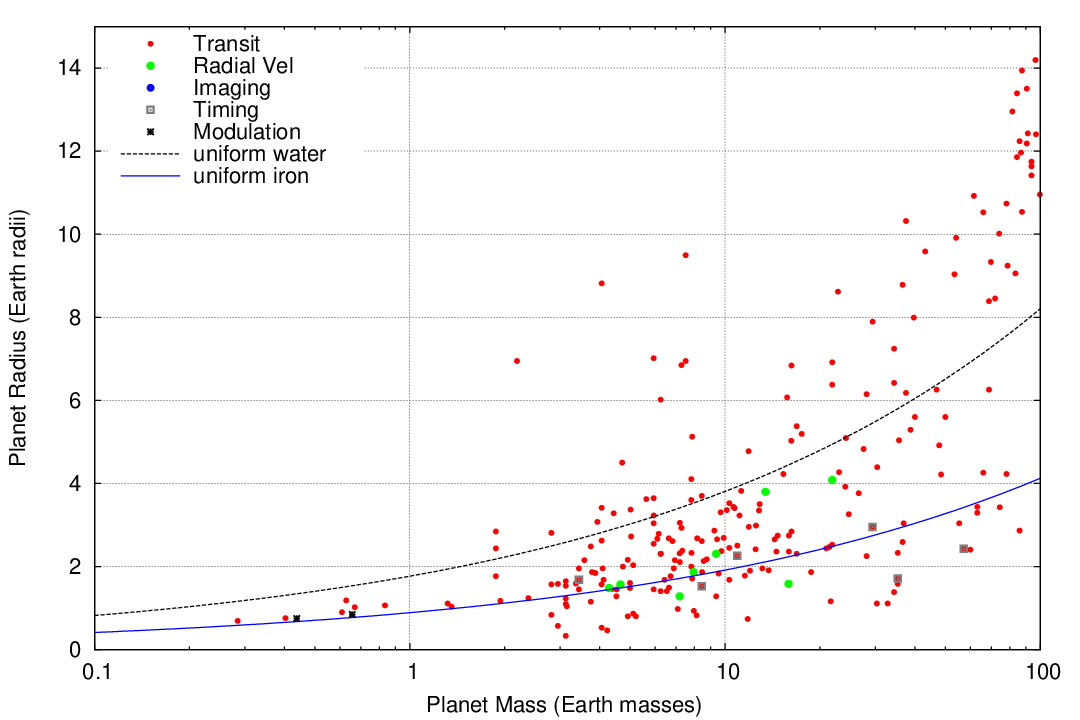
Q: What can you say about "small" planets?
Oh, but that previous graph doesn't show all the planets. We need to zoom out to see all of them.
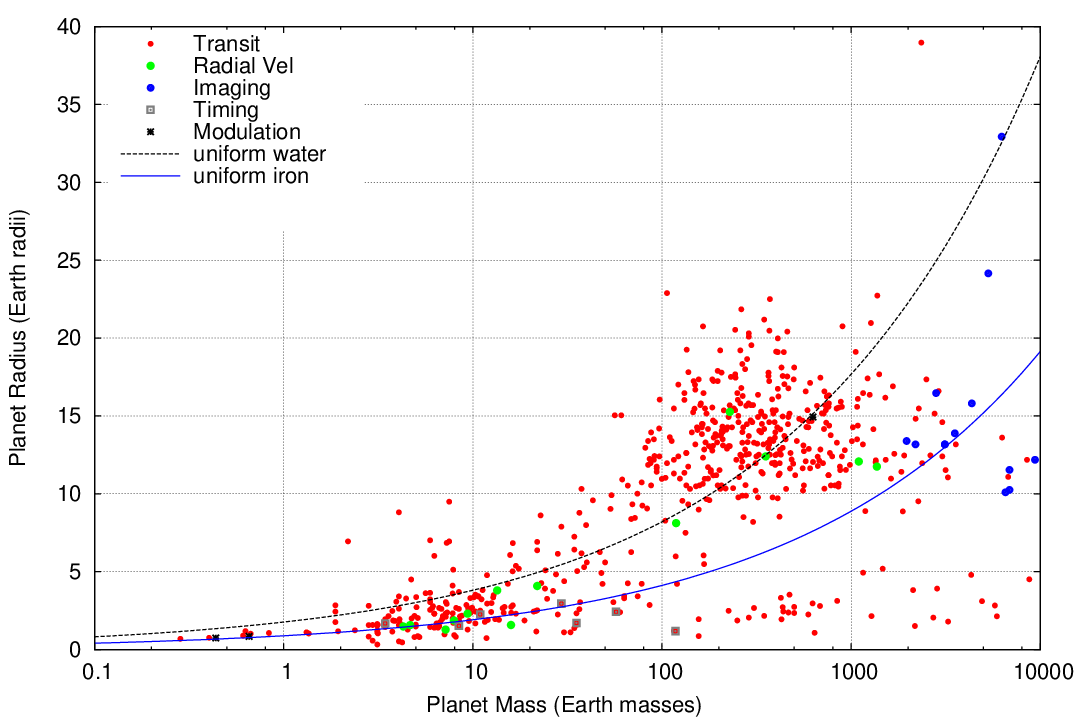
Q: What can you say about "big" planets?
Copyright © Michael Richmond.
This work is licensed under a Creative Commons License.