 Copyright © Michael Richmond.
This work is licensed under a Creative Commons License.
Copyright © Michael Richmond.
This work is licensed under a Creative Commons License.
You are familiar with the basic idea behind radial velocity variations, right?
The idea is pretty simple: if a star has a planetary companion, then the star will make a small orbit around the center of mass of the star-planet system. As the star revolves around this center, its light will be Doppler-shifted with the period of its orbit. Find this periodic shift, and *boom* there's the planet.
So, what's so hard about that?
Q: Really -- why is this so difficult?
The problem is twofold:
Let's do a simple example: imagine a simpler Solar System which consists of just the Sun and one planet: either the Earth, or Jupiter.
                            Earth           Jupiter          Sun
---------------------------------------------------------------------
  Mass (kg)               5.98E24           1.90E27        1.99E30

  Orbital radius (m)      1.496E11          7.78E11

  Orbital period (yr)     1.00             11.86

---------------------------------------------------------------------


    Q:   What would be the speed of the Sun's motion around the
         center of mass in each case?
Okay, so the speed of a star's orbital motion around the center of mass isn't going to be very large. What does that mean for the Doppler shift?
    Q:   You observe one absorption line in a stellar
         spectrum, which has a rest wavelength of 5000 Angstroms.

         If this star is moving away from us at 10 m/s due to the
         gravitational pull of a planet, what will
         the observed wavelength of this line be?
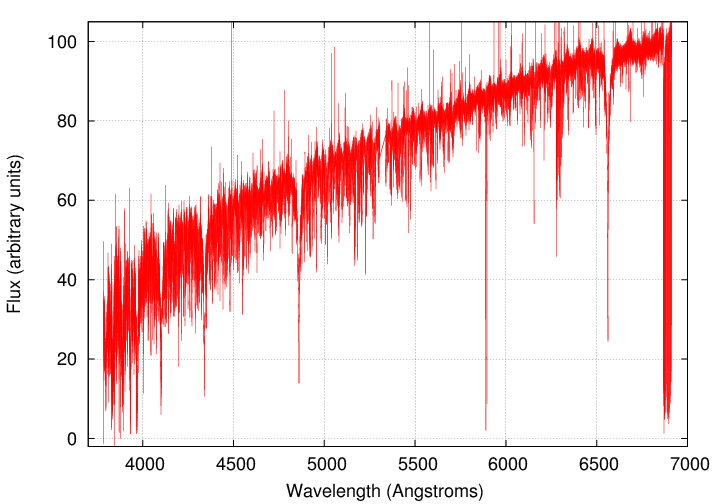
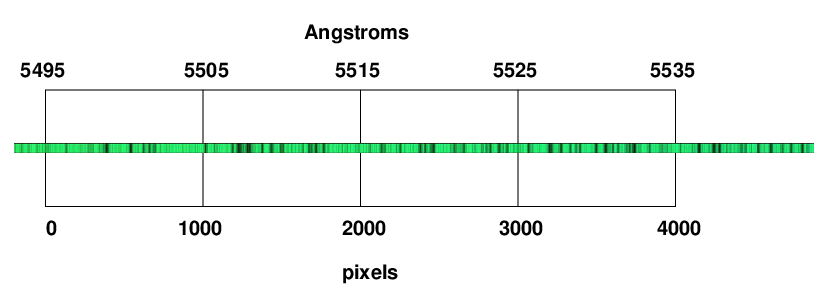
That's a pretty small shift. Here, for example, is a typical spectrum of a G2V star.
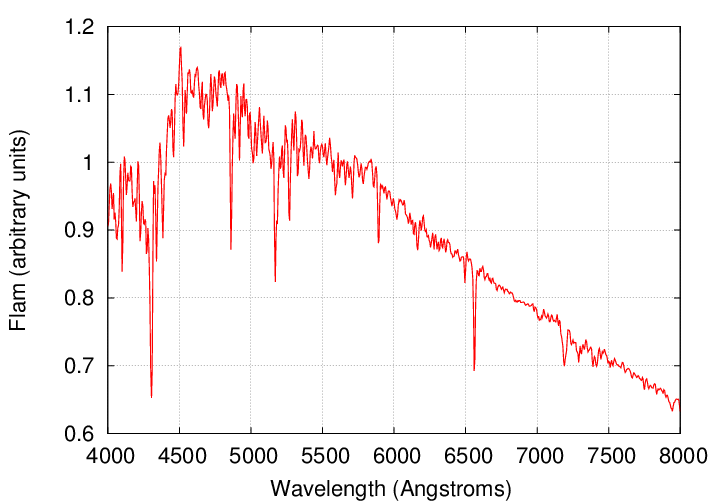
There's no way to measure a 10 m/s shift in a spectrum like this, which is low-resolution. Recall that physicists describe a spectrograph by its resolving power:
                                  central wavelength
    resolving power  R   =    -------------------------------
                                 smallest feature visible
In the examples above, the resolving power is only about R = 1000. That's typical of general-purpose instruments: the SDSS spectrograph had R = 2000.
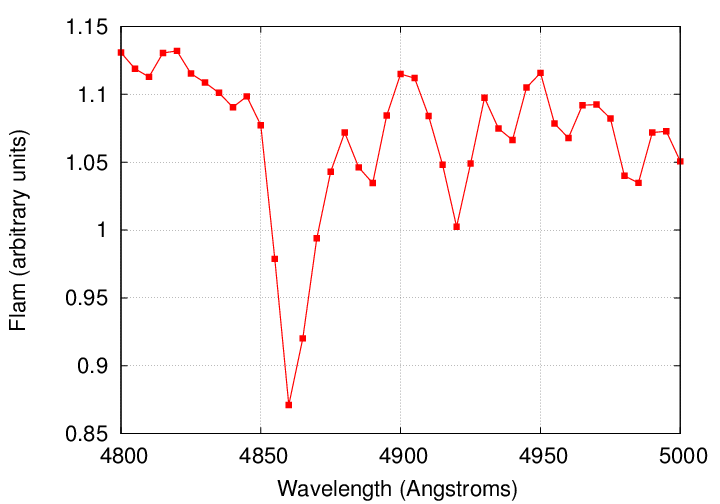
People interested in planets build spectrographs with higher resolving powers.
Compare a spectrum from HARPS to one from a "typical" spectrograph; these are two different stars, but you should get the general idea.
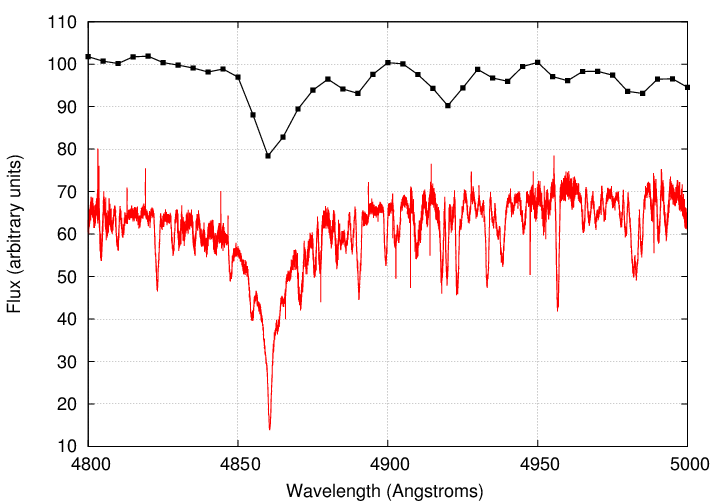
But even these special-purpose instruments don't have nearly the resolving power to detect the shift in a spectral line caused by a star's reflex motion in response to a planet ... do they?
Actually, they do ... if you use them properly. There are two "tricks" in the analysis of stellar spectra which allow astronomers to measure Doppler shifts of just a few meters per second.
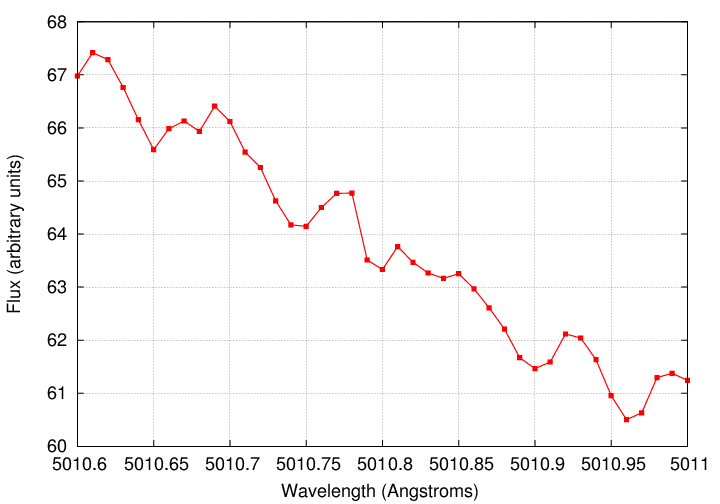
The general idea of determining the centroid of a sampled quantity to a precision higher than that of the samples themselves is the same reason that people can use ground-based optical images to measure the positions of stars to better than 1 arcsecond.
        Q:  How many good lines might appear in the entire
            HARPS spectrum?
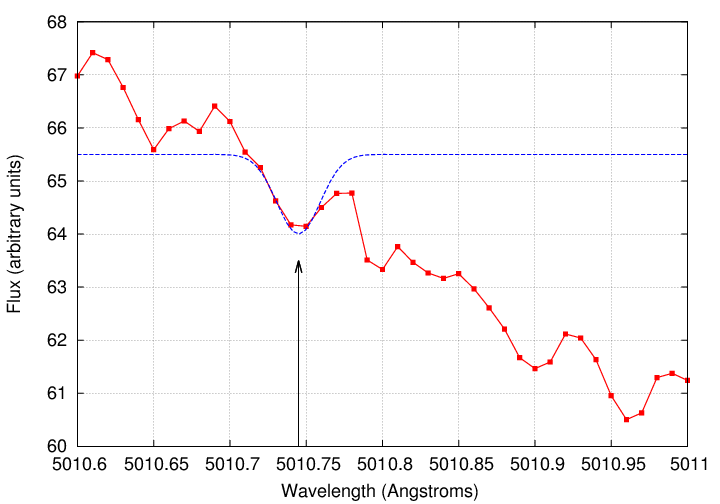
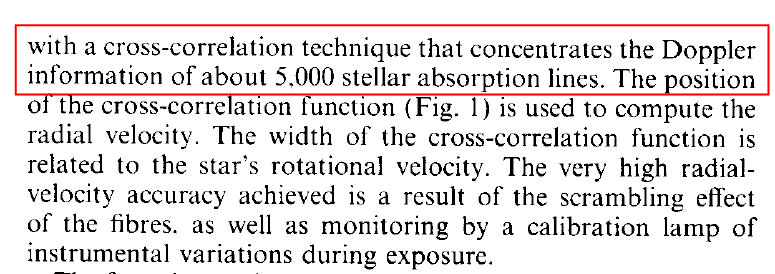
In their paper describing the discovery of the planet around 51 Peg in 1995, Mayor and Queloz write:
Let's put these two "tricks" together and see if we can figure out just how well a spectrograph like HARPS ought to do:
        A star is moving at v = 30 km/s away from the Sun.
        You take a spectrum over the range from 4000 - 7000 Angstroms,
           sampled every 0.01 Angstrom (so element size = 0.01 Angstrom).
        Use as the 'typical' wavelength 5000 Angstroms.

          - you determine centroid of each line to 0.2 elements.

          - assume 3 good lines per Angstrom, on average


        Q:  What is the size of the Doppler shift, in Angstroms?

        Q:  What is the uncertainty in wavelength for one good line?

        Q:  What is the uncertainty in wavelength for ALL good lines,
                 combined together?

        Q:  What is the uncertainty in radial velocity, using all
                 the lines combined together?
Great! It appears that if we can take a spectrum which records tens of thousands of absorption lines, all sampled very finely, then we can determine the radial velocity of a star to the required precision.
Wait a moment ... if there are tens of thousands of lines, and each one is sampled finely, and there's lots of space between each one, then .... um, well, the spectrum must contain hundreds of thousands of elements.
But -- how can they measure it? Don't even the largest CCDs have only 8192 pixels in each row? If we try to sample the entire spectrum
Image courtesy of
David Haworth's "Observational Astronomy" site
onto a single CCD, only a teeny tiny portion will fit!
Q: How can we record the entire spectrum in one exposure?
The answer is to use not one dispersing element (prism or grating), but two dispersing elements oriented at right angles. One spreads the light out left-right,
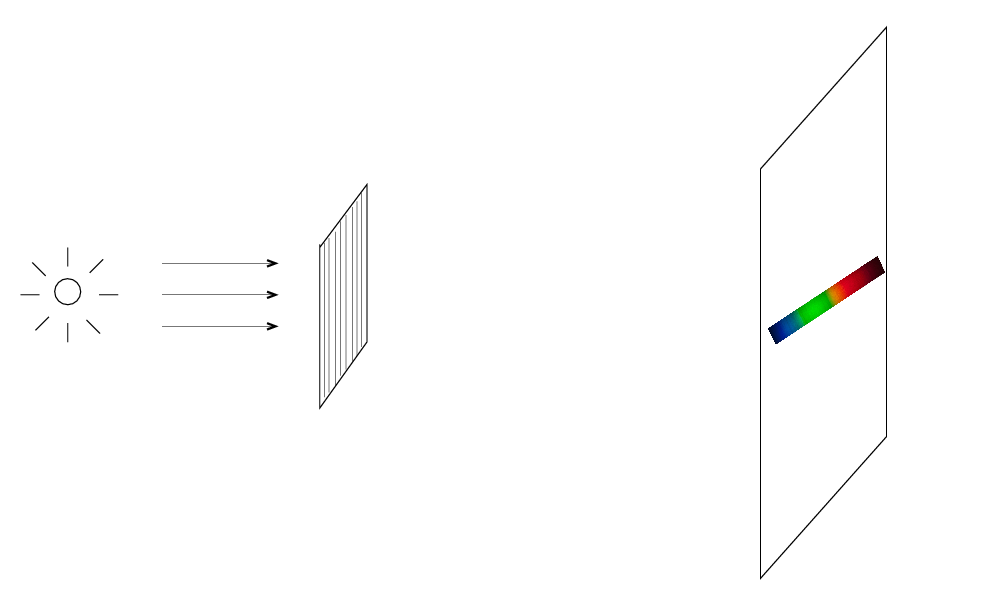
the other spreads the light out up-down,
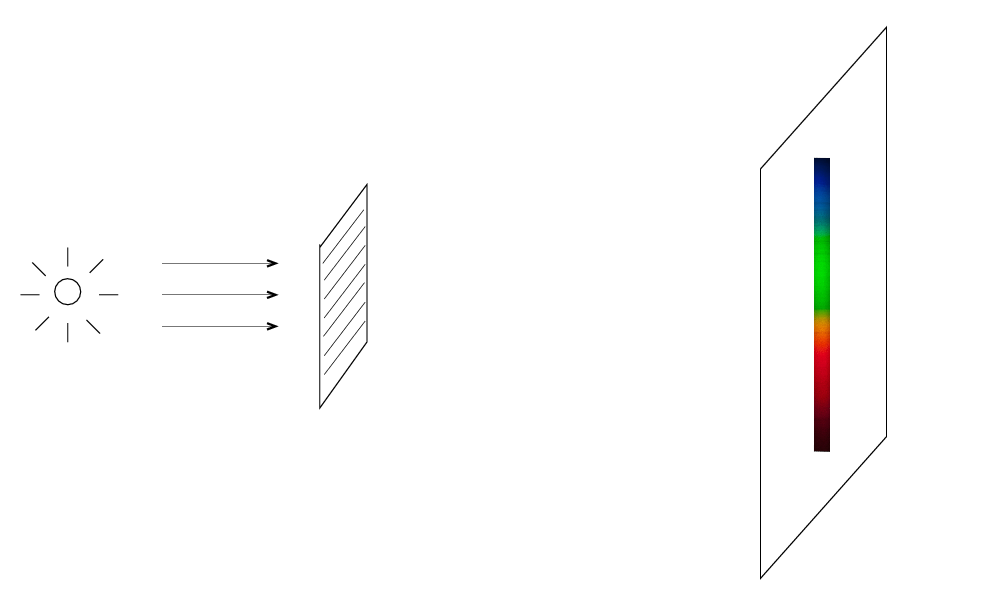
so if you use both in sequence, you get many little rows running left-right, down a bit, left-right, down a bit, and so forth.
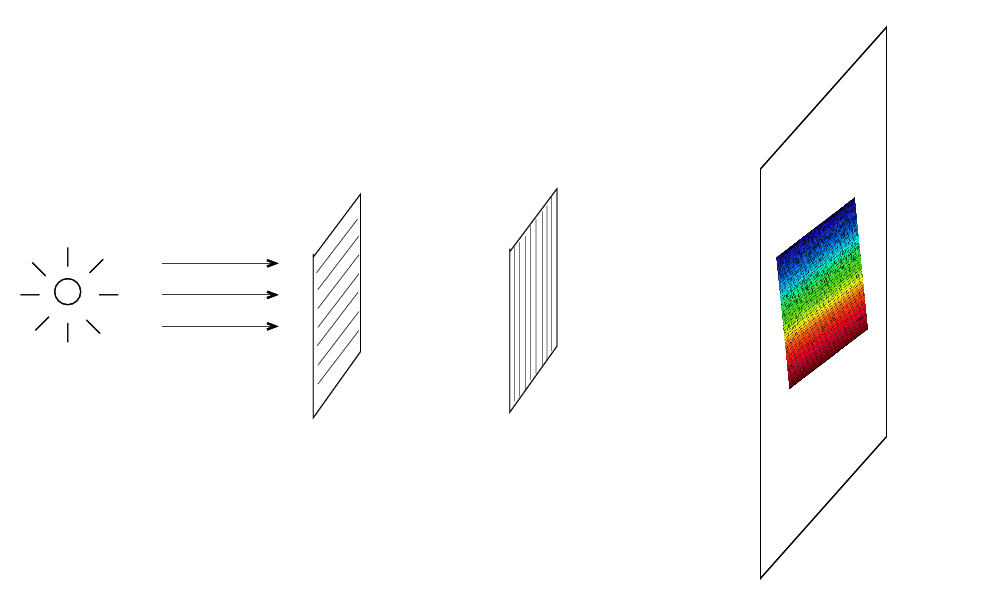
In other words, an echelle spectrograph produces a rectangle of spectrum, with many horizontal rows inside. This rectangle will fit very neatly inside a typical CCD, so we can get a very large stretch of spectrum with a high resolution in a single exposure.
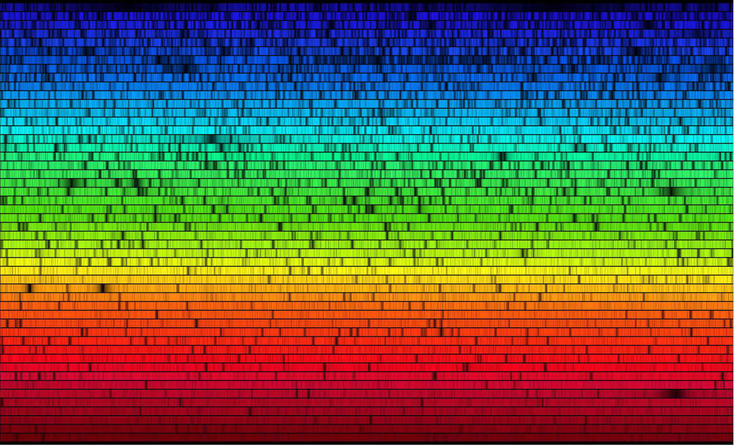
Solar spectrum courtesy of
Kitt Peak National Observatory and the Harvard-Smithsonian
Center for Astrophysics
Well, actually, the picture above is not an actual single exposure -- it's a processed and rectified pretty picture. An ACTUAL single echelle image looks more like this:
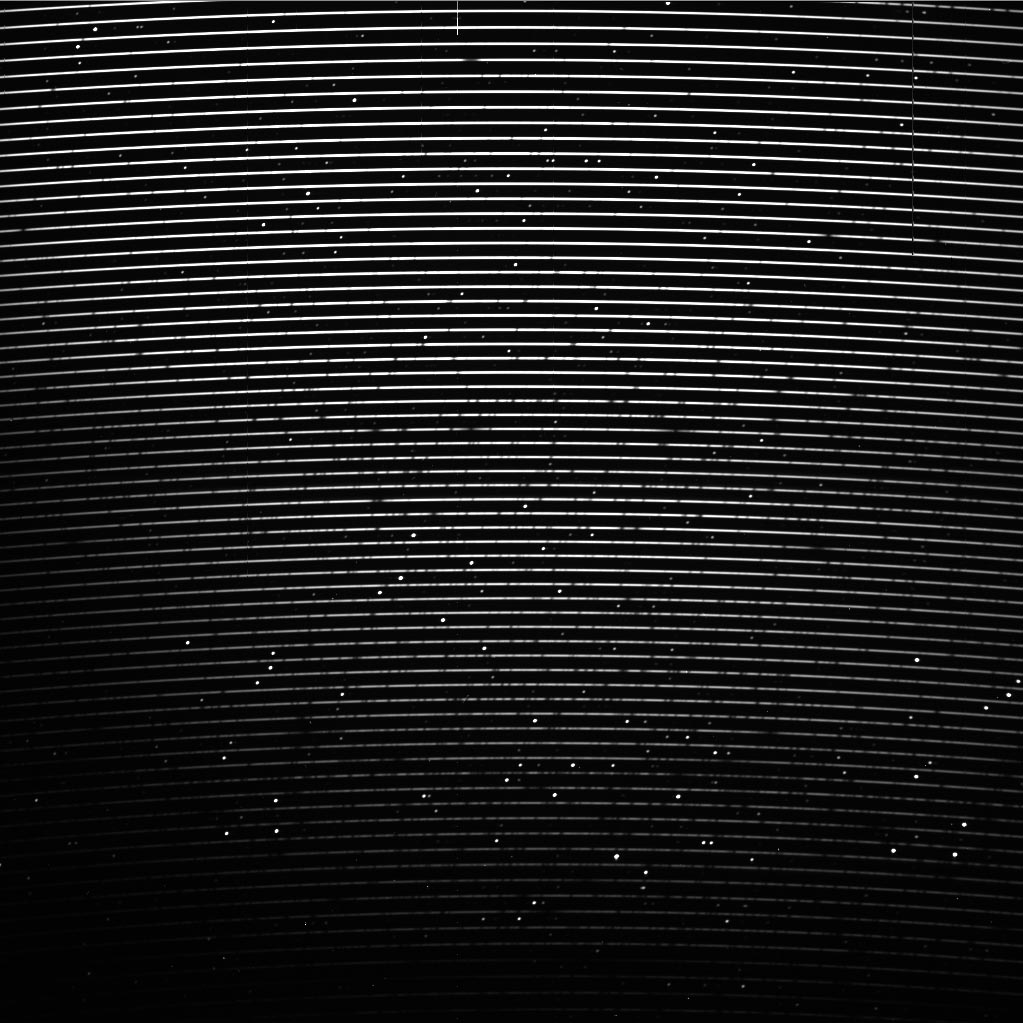
Spectrum of 51 Peg taken by
the ELODIE instrument
or this (which is actually an image taken by amateurs with a commercially available echelle spectrograph )
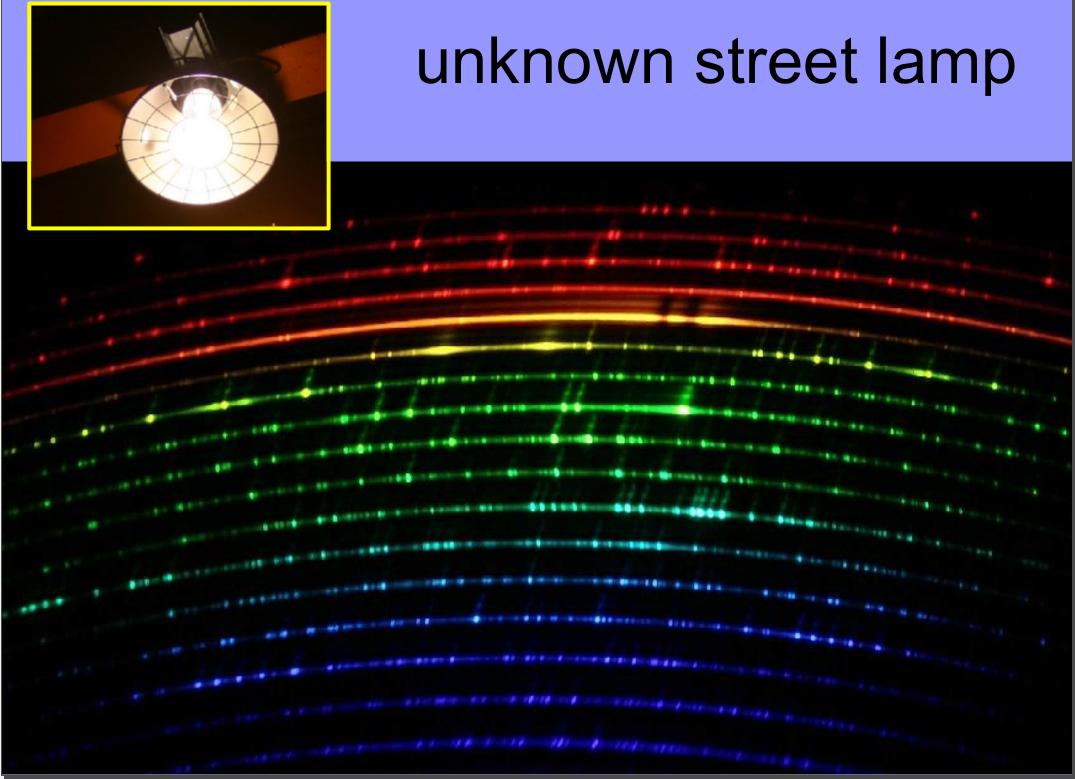
Image courtesy of
Olivier Thizy and ASPA
As you might imagine, reducing and analyzing the data recorded in echelle images is ... not so easy. There are a LOT of non-linear effects that must be calibrated and removed.
Some of those effects occur due to changes in the instrument as is expands or contracts or bends. Obviously, astronomers want to prevent such instrumental changes from happening. In the case of exoplanet searchers, this quest for stability has led to
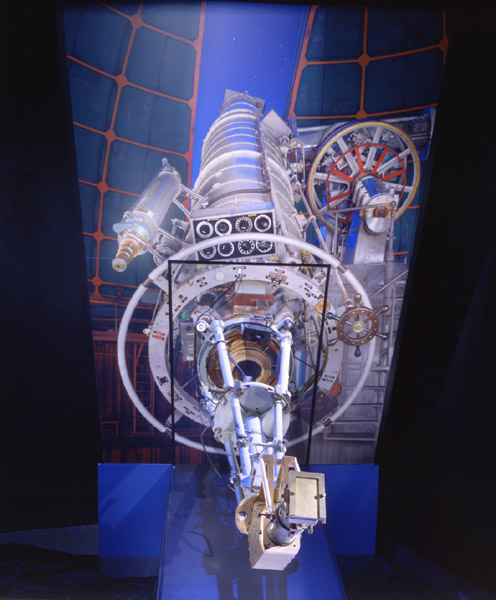
Image of Brashear spectrograph at Lick Observatory
courtesy of
the Smithsonian
and instead sitting motionless in a room, fed by long fibers from the telescope.
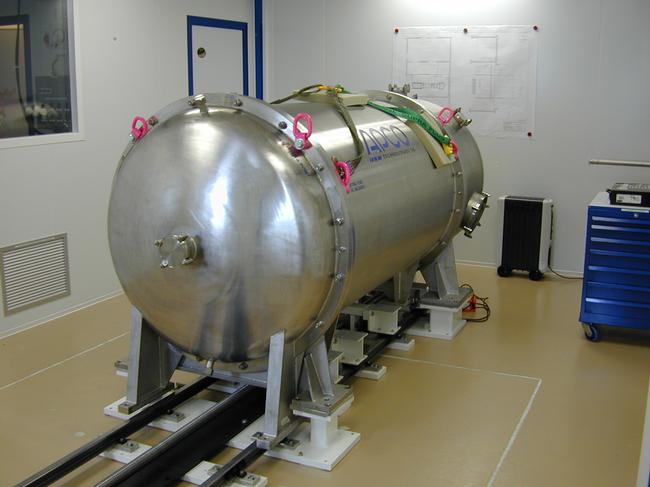
Image of HARPS courtesy of
ESO
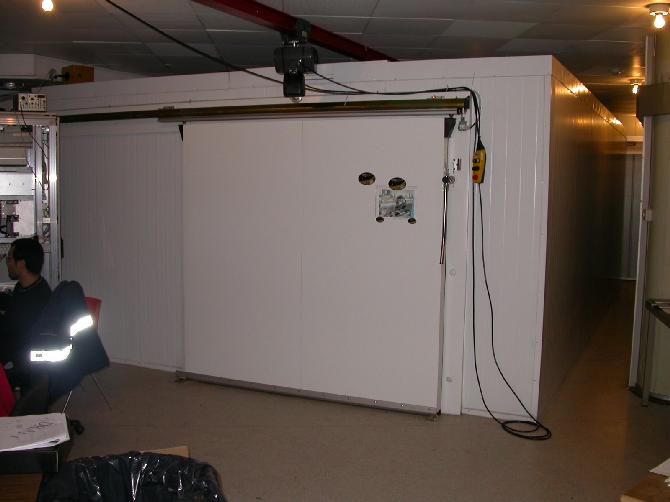
Image of HARPS courtesy of
ESO
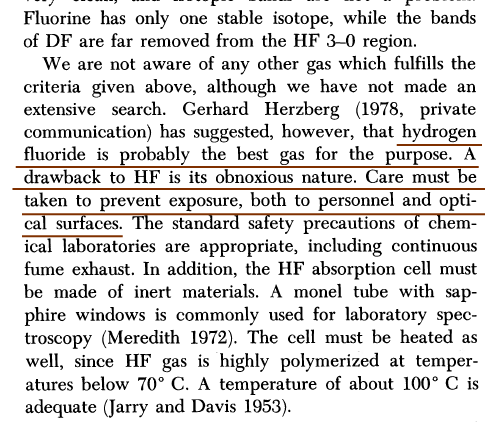
Text from
Campbell and Walker, PASP 91, 540 (1979)
but later, iodine was chosen as the standard.
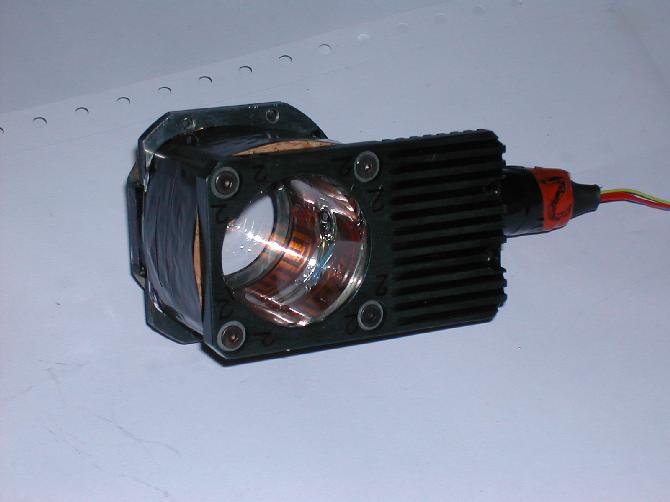
Image of HARPS courtesy of
ESO
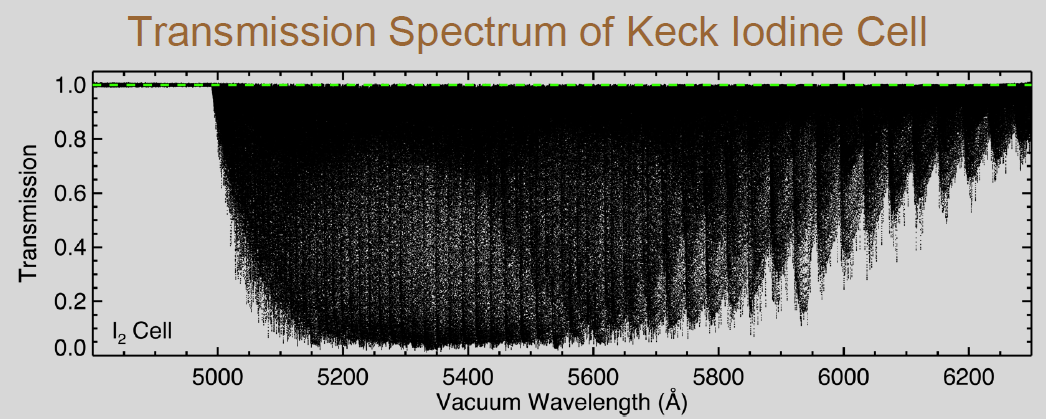
Image from
a presentation by Valenti and Anderson
(a copy available below)
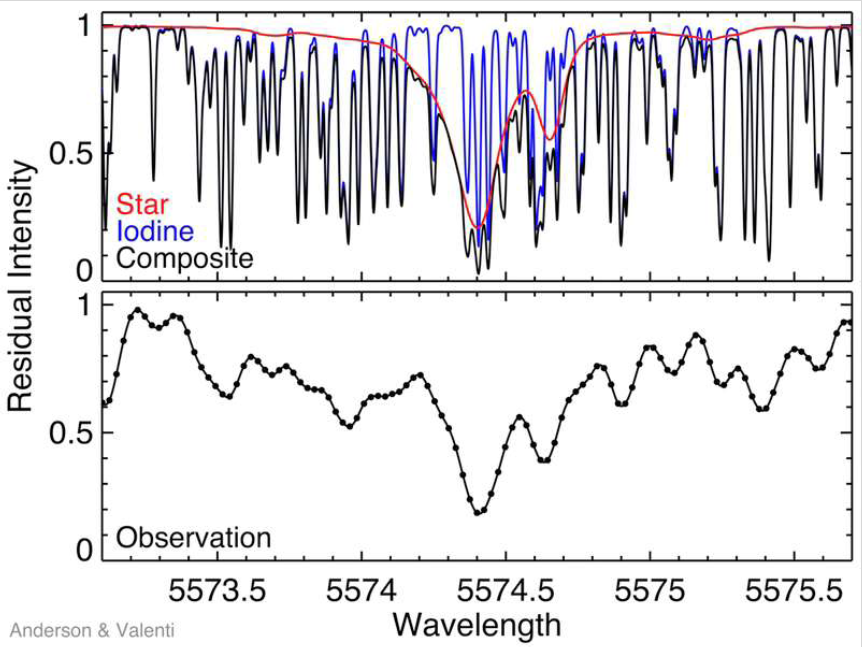
Image from
a presentation by Valenti and Anderson
(a copy available below)
So, combining all these techniques, just how well can planet-hunting astronomers measure radial velocities of candidate host stars?
A very nice summary is provided by
There are a number of teams, using different telescopes and spectrographs, all working hard to reduce their systematic errors. A partial list is
Many of these instruments are currently measuring radial velocities with precisions down to 1 m/s or so.
However, the authors of the review article look forward to bigger and better instruments, which might reach precisions of 0.10 m/s in the next decade or two:
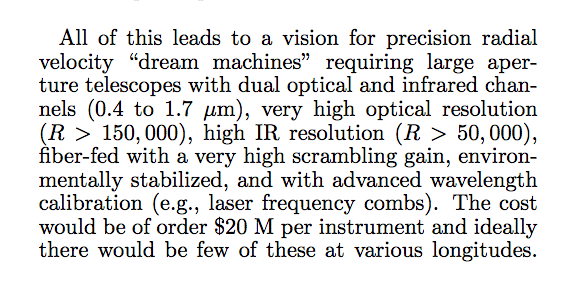
....

Quoted from the conclusions of Fischer et al., PASP 128, 66001 (2016)
Copyright © Michael Richmond.
This work is licensed under a Creative Commons License.