 Copyright © Michael Richmond.
This work is licensed under a Creative Commons License.
Copyright © Michael Richmond.
This work is licensed under a Creative Commons License.
Some of the graphs referred to today can be found at the NASA Exoplanet's site 'Exoplanet Plots' page.
Let's make some graphs showing the overall properties of the confirmed exoplanets. As we proceed, look for evidence of selection bias in our set of objects. Selection bias is simply the fact that it's easy to find things that are easy to see, and hard to find things that are hard to see. Sounds simple, but it can wreak havoc with the conclusions drawn from an observed sample of objects.
You make the plot, and then we'll all discuss it. Ready?
    Plot exoplanet ORBITAL SEMI-MAJOR AXIS on the y-axis
                 and ORBITAL PERIOD on the x-axis.
  Q:  What pattern do you see here?   Can you explain it with physics?


  Q:  How broad is the locus of points?   What does that mean
           about the masses of the host stars?

           (try peeking at  my version)

  Q:  Why is the range of host stellar masses so small?
Plot exoplanet MASS on the y-axis and ORBITAL PERIOD on the x-axis.
  Q:  What groups do you see here?


  Q:  Which of these are "Hot Jupiters?"


  Q:  Why are there few planets in the lower-right region of this graph?


  Q:  Where would Earth appear in this diagram?
Plot exoplanet RADIUS on the y-axis and ORBITAL PERIOD on the x-axis.
  Q:  Which of these are "Hot Jupiters?"


  Q:  Hey, where did the "Cold Jupiters" go?


  Q:  Why are there few planets in the lower-right region of this graph?


  Q:  Can we really trust the points for the "Imaging" method?
Plot exoplanet MASS on the y-axis and PLANET RADIUS on the x-axis.
  Q:  Which of these are "Hot Jupiters" and "Cold Jupiters"?


  Q:  What does an unknown orbital inclination do to the position
           of a point on this graph?


  Q:  Where would the Earth appear on this graph?


  Q:  Identify planets which are "rocky" and "gassy" on this graph.


  Q:  What would you call the planets near the upper region?
Plot exoplanet DENSITY on the y-axis and ORBITAL RADIUS on the x-axis.
  Q:  What is the largest orbital radius among these objects?  Why?


  Q:  Where would the Earth appear on this graph?


  Q:  Where are the "hot Jupiters" on this graph?


  Q:  A few objects here were discovered by the Radial Velocity technique.
            Do they scatter uniformly over the graph?  Why not?
    Plot exoplanet ORBITAL ECCENTRICITY on the y-axis
                              and ORBITAL PERIOD on the x-axis.
  Q:  What groups do you see here?


  Q:  What's happening at the SMALL ORBITAL RADIUS end of the graph?


  Q:  What's happening at the LARGE ORBITAL RADIUS end of the graph?
A recently published paper notes that the eccentricity of exoplanets seems to be connected to the number of objects we've detected in that planetary system. Single objects have higher eccentricity than objects with neighbors.
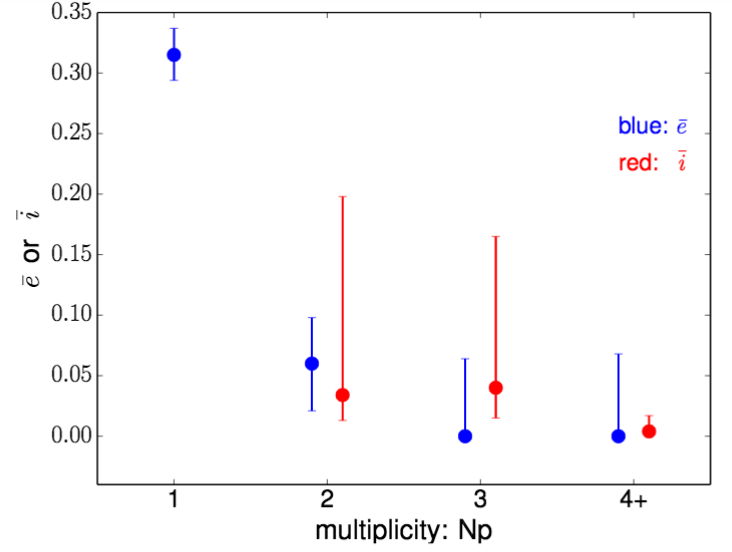
Figure 3 taken from
Xie et al., PNAS (2016).
Now, the next property we want to examine is the temperature of the exoplanet .... but how can we do that? From our vantage point, very far away, it is extremely difficult to measure the surface temperature, or even the cloud-top temperature, of an exoplanet directly.
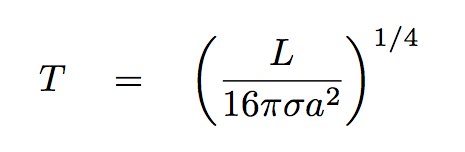
Instead, what we usually do is to compute a substitute: the equilibrium blackbody temperature of the exoplanet. That means
What do you need to know in order to compute this equilibrium temperature? There are several ways to do it, but let's just pick one. Suppose that you can measure the following items:
   Q:  What is the flux of energy striking by the exoplanet
          (and being absorbed, since it is a perfect blackbody)?

   Q:  What is the flux of energy radiated away from the exoplanet?


   Q:  If you set those fluxes equal to each other, can you
          solve for the equilibrium temperature T?
Right.
Okay, let's try looking at this "equlibrium blackbody temperature" for the known exoplanets.
    Plot exoplanet EQUILIBRIUM TEMPERATURE on the y-axis

        and ORBITAL PERIOD on the x-axis.
Compare your result to my version.
Q: What is the difference between your version and mine?
The trouble is that it is difficult to measure accurately the luminosity of a star; that generally requires knowing the distance very precisely, and distances are HARD to measure.
So, I followed the example given by NASA's 'Exoplanet Plots' page and computed a related quantity: irradiation. I used the host star's effective temperature, (which is easy to measure) and its stellar radius (which is not so easy) to calculate the flux of radiation striking an exoplanet, compared to the flux of radiation which strikes the Earth from our Sun.
The basic idea is similar, but this "irradiation" version includes many more exoplanets.
  Q:  Why is there a clump of points above the main locus
             at large orbital radii?


  Q:  What the heck is happening to the two exoplanets
             at the upper left?
Copyright © Michael Richmond.
This work is licensed under a Creative Commons License.