 Copyright © Michael Richmond.
This work is licensed under a Creative Commons License.
One of the main reasons that we can't easily detect exoplanets around other stars is simply that those exoplanets tend to be VERY faint. This is especially true if we consider the traditional optical astronomy.
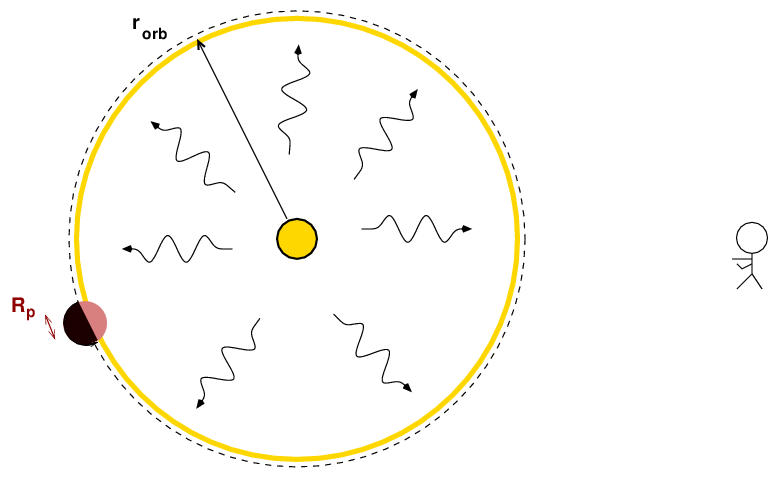
Suppose that a planet produces no luminosity of its own, but only shines by reflected light. This is pretty much the case for all the planets in our own solar system, and likely to be the case for most planets in other stellar systems as well.
How bright will the planet be? And, perhaps more important, how bright will it be compared to its host star?

Well, note that the planet reflects light from the star. So, begin by determining the flux of light from the star which reaches the planet. If we call the star's luminosity L*,

How much of this light is reflected? The flux striking the planet depends on the cross-section area of the planet, of course. Let's define the albedo α as the fraction of the incident light which bounces off the planet back into space. Then

  Q:  Can you write an equation for the ratio of the
      luminosity of the planet to the luminosity of the star?
Good.
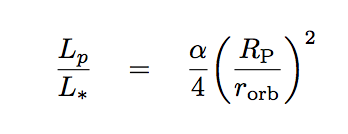
Okay, let's try putting some numbers into this equation. Let's assume that the albedo is α = 0.5.
   For the following three situations, compute the ratio

   of brightness of planet to star.   Also, compute the
   difference in apparent magnitude

   In each case, assume that the host star is identical to the Sun.


      Case               Rp      Rorb         ratio of     difference in
                        (m)      (m)         intensity       magnitude
   ---------------------------------------------------------------------

     real Jupiter    7.15E7     7.78E11


     real Earth      6.37E6     1.50E11


     hot Jupiter     7.15E7     6.00E9


   ---------------------------------------------------------------------
So far, you only know the difference in magnitude between planet and star. But if we make some assumptions about the host star, you can determine the apparent magnitude of the planet.
   Assume that the star is identical to the Sun, and located at
   a distance of d = 10 pc from the Solar System.


     Q:  What is the apparent magnitude of the star?


     Q:  What is the apparent magnitude of the planet in each case?
Those apparent magnitudes sound ... pretty faint. How long will it take to build up a decent image of each one, even if we use a big telescope?
We can check in a rough fashion by using the following order-of-magnitude estimate:
For rough purposes, let's ignore extinction in the Earth's atmosphere, and just try to compute the number of photons which would be collected by a telescope over some exposure time in each case.
                                     number of photons
      Case          apparent    1-m telescope       10-m telescope
                     mag          60 sec               60 sec
   ---------------------------------------------------------------------

     real Jupiter     26.5


     real Earth       28.2


     hot Jupiter      15.9


   ---------------------------------------------------------------------
But how many photons are required to provide a good detection? Well, it turns out that a standard way to estimate the quality of a stellar detection is to compute the signal-to-noise ratio. In this (very) simplified case, we can compute the signal and noise like so:
If we take a typical dark-sky value of sky V = 22 mag per square arcsecond, and assume that the region around the host star covers an area of about one square arcsecond, then the number of photons from the sky can be easily estimated:
And in this (simplified) case, the signal-to-noise ratio is

So, now you can see just how easy it might be to detect a planet circling another NEARBY star, just 10 pc away.
                                     signal-to-noise
      Case          apparent    1-m telescope       10-m telescope
                     mag          60 sec               60 sec
   ---------------------------------------------------------------------

     real Jupiter     26.5


     real Earth       28.2


     hot Jupiter      15.9


   ---------------------------------------------------------------------
Hmmmmm. It looks like the planets of our solar system would be very hard to detect, doesn't it? Is this a consequence of all the simplifications and approximations we've made in the analysis? I don't think so. Consider the work of Jeffery et al., AJ 141, 171 (2011). They observed stars in the Andromeda Galaxy with the 2.4-meter HST, reaching very faint magnitudes in the F606W ("V") band.
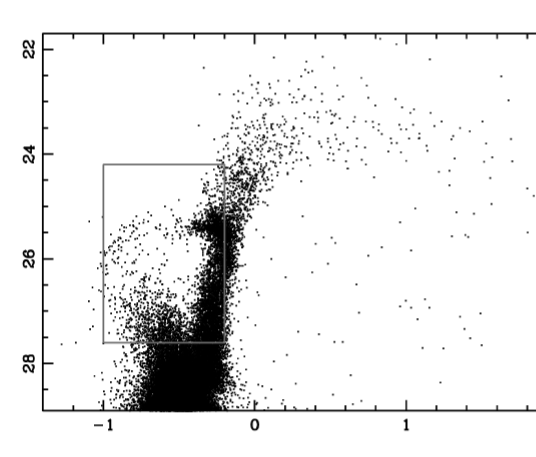
Figure 3 taken from
Jeffery et al., AJ 141, 171 (2011).
How long did they have to integrate to reach these magnitude 28 stars? It varied from field to field, but on average, around 80,000 seconds, or approximately one full day!
So planets don't reflect all that many photons; that's fine, we've figured out that with a large enough telescope, and long enough exposure time, you can collect enough photons from the planet to detect it ... above the sky noise.
But there's another source of noise, very close to the planet: the host star.
Just how close are typical exoplanets to their host stars? Well, once again, let's consider a typical case of a NEARBY star, at a distance of d = 10 pc. Please fill in the following table.
This is one the seemingly rare cases in which those strange units used by astronomers actually make the calculations easy.
      Case        delta mag      linear separation   angular separation
                (planet - star)     (AU)               (arcsec)
   ---------------------------------------------------------------------

     real Jupiter     21.7          5.2


     real Earth       23.4          1.0


     hot Jupiter      11.1          0.04

   ---------------------------------------------------------------------
Why does it matter that the host star is so close to the planet? The problem is glare. Some of the light from the host star will become mixed with the light from the planet; and if that contaminating light is bright enough, its noise will overwhelm the signal from the planet.
Let me illustrate what I mean. Below is the radial profile of a real star, taken from an SDSS image. I added to this real data two artificial signals:
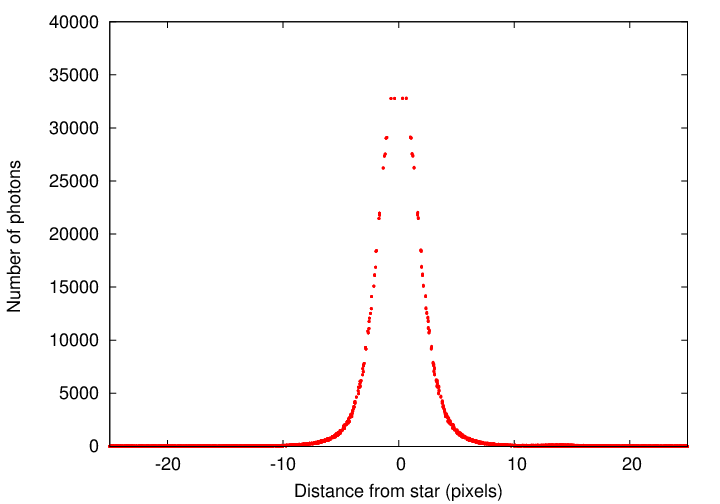
Q: Can you find the fake stars in this graph?
Maybe it will help if I make the Y-axis logarithmic. That should enhance faint signals.
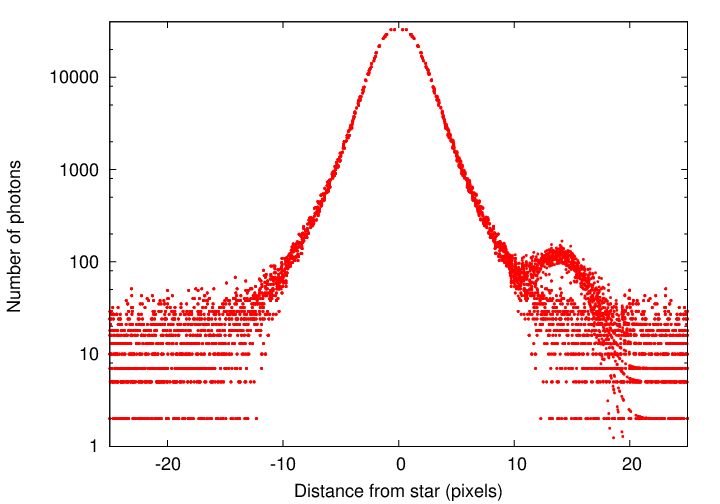
Yes, fake star "A" is located at X(A) = 14 pixels to the right of the host star.
But can you find the other fake star, B? It has exactly the same brightness as fake star A.
  Q:  Where is fake star B?


      (Hint: it is also to the right of the bright star)
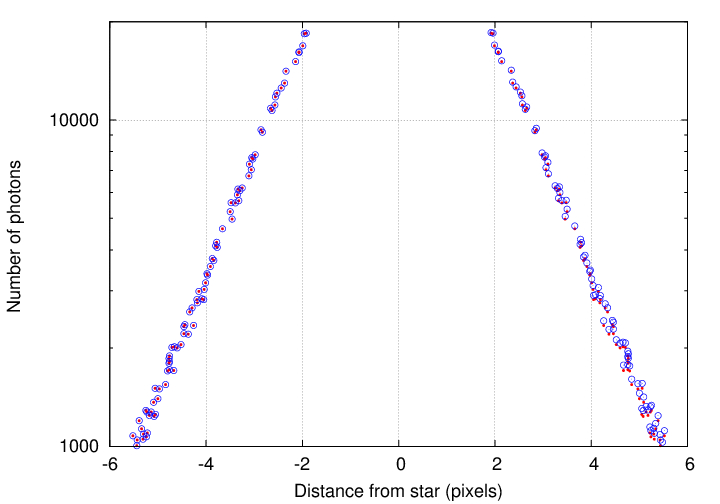
It turns out that fake star B is at X(B) = 3 pixels to the right of the bright star. It has the same amplitude as fake star A: 100 photons.
But while fake star A sat in a region of low noise, and so its peak stuck up above the noise, fake star B is located in a region of very high signal ... and so very high noise. You just can't see it in any ordinary way.
Here, I'll zoom in and show you the inner region of the graph, showing the original star in red and the (real star + fake star B) in blue. Notice how the blue points lie exactly on top of the red points on the negative side of the profile, but are SLIGHTLY above the red points on the positive side of the profile. That's the sign of the added fake star B.
Let's get quantitative. How bright must a planet be to "stick out above the noise" of its host star?
Let's define some quantities:
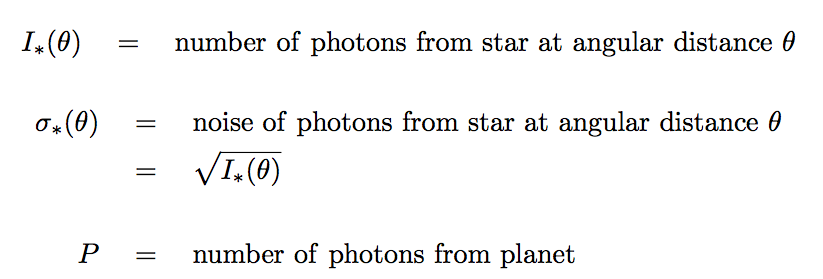
We can state that, very roughly, in order for us to detect a planet at an angular distance θ from a host star, the number of photons from the planet must exceed the noise from the host star at that location.

In order to do run some numbers, we need an analytic function for the intensity of light I(θ) as function of angular distance from the host star. In other words, we need a mathematical description of the Point Spread Function (PSF).
For many purposes, the PSF can be approximated as a gaussian (although we will find out soon that this is often not true in the real world!). Let's use a gaussian model:

where we've made use of the relationship between the Full Width at Half Maximum (FWHM) and the gaussian width s

Putting it all together, we can describe the signal from a gaussian PSF as

Phew.
Now, your turn. Please use the equation above to fill in the following table. First compute the "signal" I(θ) column, then take the square root to find the "noise" column, and finally compute a magnitude which describes the level of the noise at angle θ relative to the star's peak.

                signal        noise
   angle θ        I(θ)    sqrt[I(θ)]      noise in mag
---------------------------------------------------------------------------
    0

    0.5 FWHM

    1.0 FWHM

    2.0 FWHM

    3.0 FWHM

    4.0 FWHM

    5.0 FWHM

---------------------------------------------------------------------------
That looks great! The signal from a true gaussian drops VERY sharply as one moves farther away from the center; and, as a result, the noise in the outer regions of the gaussian also drops very quickly.
At an angular distance of just 4 times the FWHM, the noise in the wings of the true gaussian is 24 magnitudes fainter than the peak of the gaussian. If you recall our earlier calculation of the difference in magnitude between planet and star, you'll note that Jupiter was about 22 mag fainter than the Sun.
So, it seems that as long as a planet like Jupiter is at an angular distance of at least 4 times the FWHM from its host star, we could see it above the star's noise.
It seems that way ...
BUT, ALAS, NO
The problem is that while the gaussian is
it fails miserably to match the fraction of light which is scattered into the outer wings of a real PSF. Let me show you a couple of examples.
First, a radial profile of the star Alpha Comae, measured by the SDSS. This is a very bright star, of magnitude V = 4.3, so it would be saturated with the SDSS detectors. I chose an image in which the star fell just outside the chip, and measured the light in its wings.
In this image, the FWHM of stellar images is about 1.6 arcseconds; so, a true gaussian PSF would fall to basically zero at an angular distance of something like (4*1.6) = 6 arcseconds. But, as you can see, the star's light extends far, far, FAR beyond that small angle.
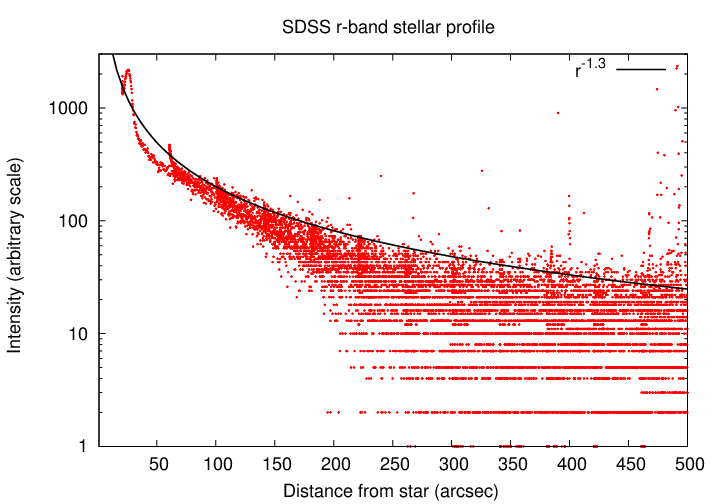
Ignore the central region of this graph --
some crazy stuff is going on due to saturation
In fact, the outer wings of the starlight appear to follow a rough power-law, with intensity decreasing as angular distance to the negative 1.3 power. These very extended outer wings are due mostly (I think) to the scattering of light in the Earth's atmosphere.
That's going to be a problem if we are trying to detect planets close to a bright star.
Well, maybe we can do better if we move outside the Earth's atmosphere. Let's look at the radial profile of a star observed by the Hubble Space Telescope. I chose an I-band image near Proxima Centauri and examined a bright, saturated star.
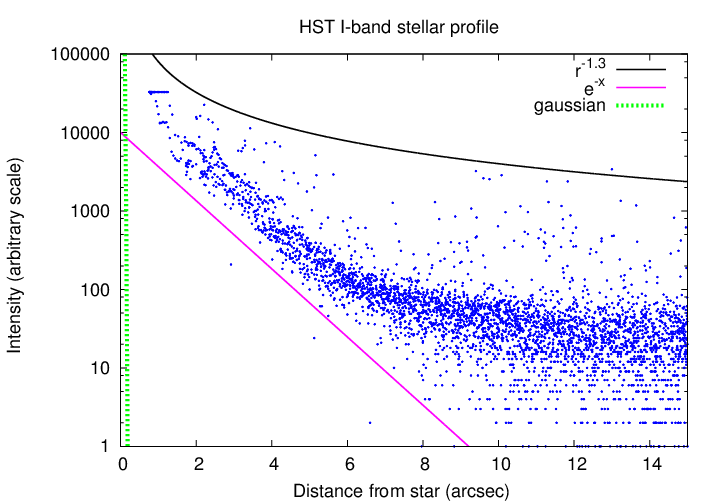
This is certainly BETTER than the ground-based PSF.
But we see again that a true mathematical gaussian function falls off MUCH more rapidly that the real PSF. In the figure above, I've used a gaussian with a FWHM of 0.08 arcseconds, which is close the typical HST value at this wavelength.
Of course, my example was a random star taken in a random image, and the star was completely saturated near the center. For a better view of Hubble's PSF, let's go to the HST WFC3 Instrument Handbook.
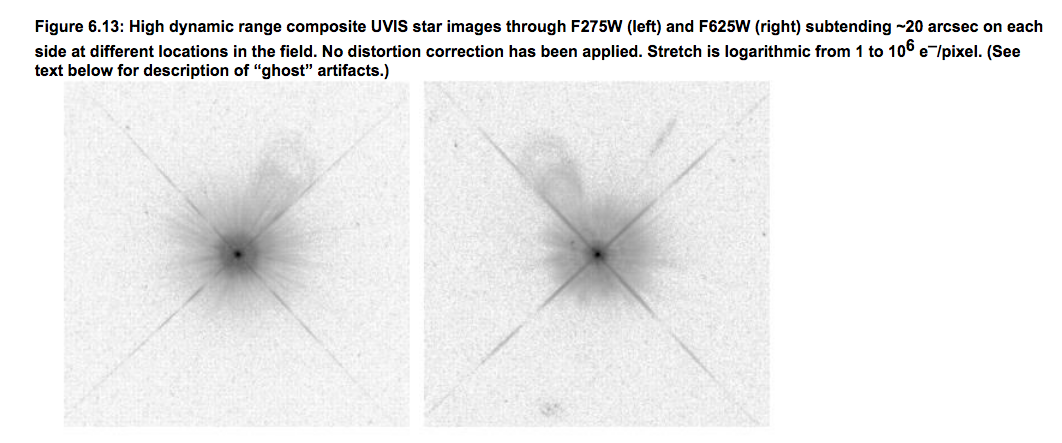
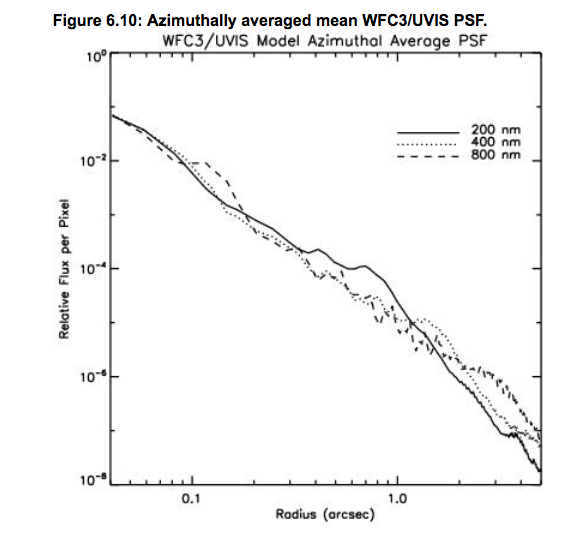
So, if the real PSF doesn't decrease very rapidly, how well will we be able to detect planets close to the host star?
   Q:  In the HST PSF shown just above, by what factor
       does the intensity decrease within 1 arcsecond?


   Q:  Relative to the central intensity, what would
       the noise be at a distance of 1 arcsecond?


   Q:  How many magnitudes below the peak would the
       noise be at a distance of 1 arcsecond?
The bottom line is ... it's really, really tough to take pictures which show exoplanets shining in reflected light. So tough, in fact, that astronomers decided to invent special cameras which use tricks to improve their performance.
We'll talk about those next time.
Okay, so we've learned that trying to see the optical light which an exoplanet reflects from its host star in our direction is really, really, really difficult. Is there a better way to detect the planet?
Well, maybe. It can sometimes help to look at infrared wavelengths.
Here's the reason: if (and this is a big "IF") the planet happens to be warm enough to radiate a significant amount of energy on its own, then the ratio of intensities is no longer of the form

but rather one like this:

Note the differences. In the infrared ratio,
Let's examine that blackbody function. The amount of radiation emitted by a blackbody depends very sensitively upon its temperature -- and also on the wavelength.
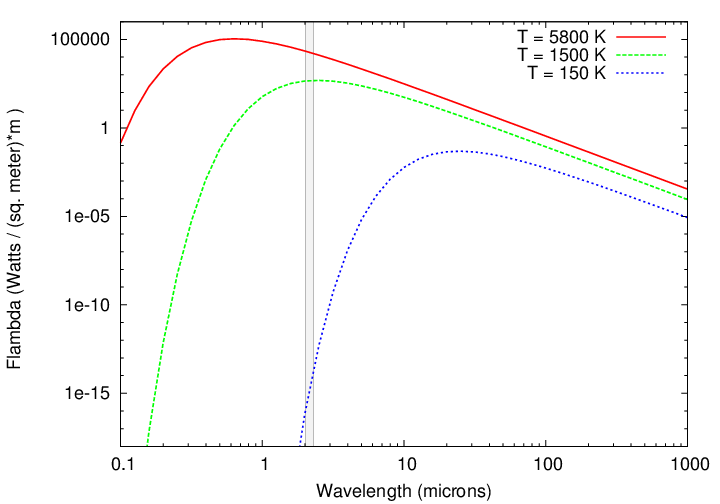
Note that at short wavelengths (to the left), the blackbody radiation can drop like a rock; that's due to an exponential term in the Planck function. But at long wavelengths (to the right), the radiation tends to decrease more gradually.
If we observe two objects at a wavelength which is long enough -- longer than the peak of both spectra -- then the difference between their emission will be relatively small. Compare the 5800 K and 1500 K bodies in the graph above. But if we pick one object which is on the exponential portion of its spectrum -- like the 150 K body above -- then the difference in intensities can be huge.

The graph above shows the blackbody function for three objects:
   Q:  If we observe in K-band, at 2 microns, what is the
       ratio of the blackbody emission function for

              (hot planet)     to    (Sun)


              (real Jupiter)   to    (Sun)
Let's zoom in on the useful section of this graph, concentrating on bodies which really do emit enough thermal radiation to give us some hope.
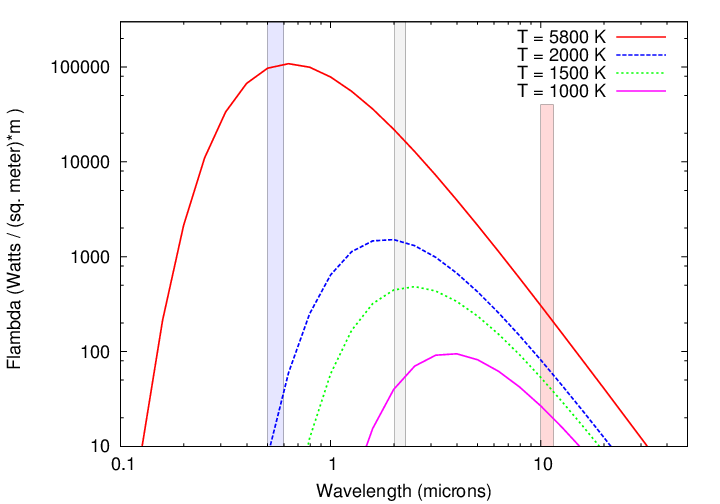
The shaded regions show
As you can see, we can gain a lot by switching from the optical to the near-infrared. If we could work in the mid-infrared, it would make (hot) exoplanets even easier to detect ... but it's pretty difficult to do that from the ground.
Fortunately, some clever astronomers are working on that right now ...

 Copyright © Michael Richmond.
This work is licensed under a Creative Commons License.