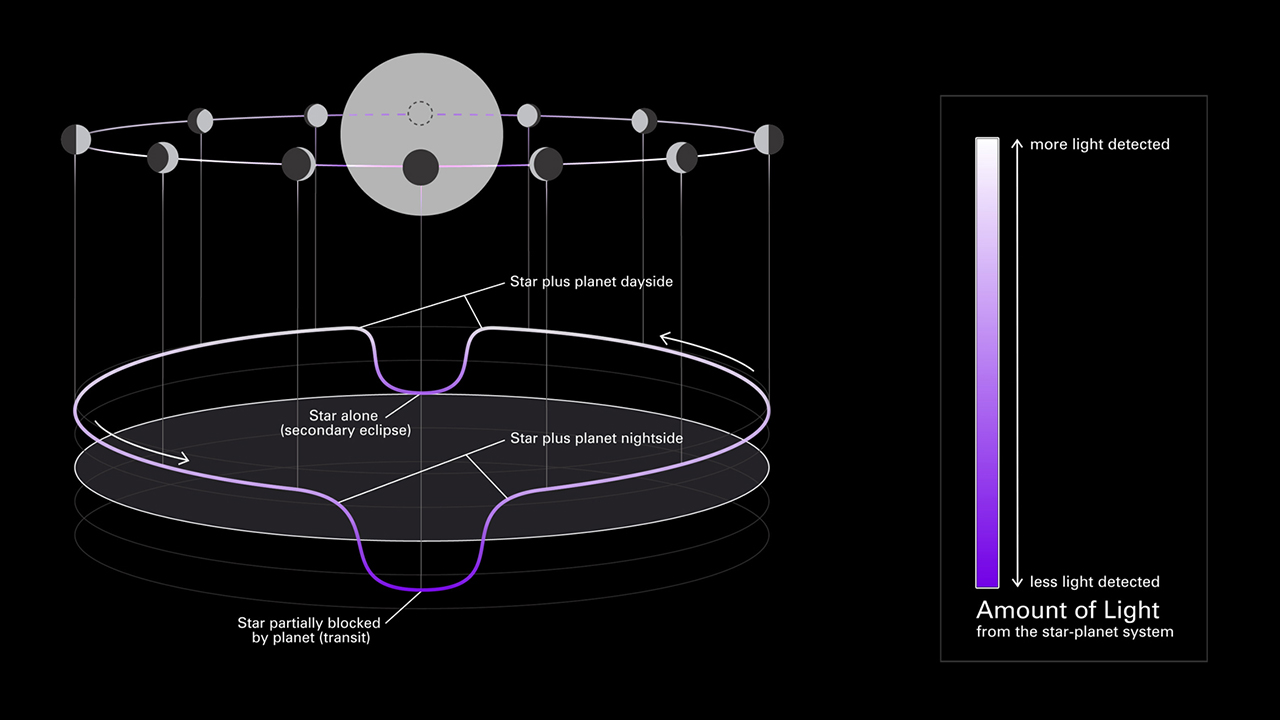
Diagram courtesy of NASA, ESA, CSA, Dani Player (STScI), Andi James (STScI), Greg Bacon (STScI)
 Copyright © Michael Richmond.
This work is licensed under a Creative Commons License.
So far in this course, I've mentioned transits quite a bit; after all, when a planet passes between its star and the Earth, it can block enough of the star's light to produce a perceptible drop in the star's brightness. Transits are responsible for most of the exoplanet discoveries made so far.
But a transit only occurs for a brief period of time, when the planet and the star line up exactly from our point of view. What happens during the REST of the planet's orbit? Are there any circumstances under which we can detect the light of an exoplanet, even when it's not blocking any starlight? If we can detect any of that planet's radiation directly, what should we expect to see during one full orbital revolution?
Contents
We'll make a number of simplifications for today's discussion. Among them are
The goal is to understand at a basic level the rough circumstances under which we CAN, or can NOT, detect the photometric signal of exoplanets as they move around their host stars.
So, let's look at an orbital diagram, and see what it tells us.

Diagram courtesy of
NASA, ESA, CSA, Dani Player (STScI), Andi James (STScI), Greg Bacon (STScI)
As a planet moves around its star, we see it go through phase, just like the Moon. In other words, we see a continuously changing portion of its "daytime" and "nighttime" hemispheres.
There are two special locations in the orbit:
Let's begin by figuring out what we will see if we look only at starlight REFLECTED from the planet. To first order, any measurements made at visible wavelengths will involve reflected light only, so these calculations ought to describe optical observations of exoplanets pretty accurately.
As mentioned before, I'll make several simplications in this discussion. First, I'll assume that all light striking the planet is reflected; this is equivalent to setting the albedo α = 1.
Next, I'll assume that light scatters off the surface in a Lambertian manner. Technically speaking, this means that the intensity of light scattered from each little piece of the surface varies with the angle θ away from its normal vector:

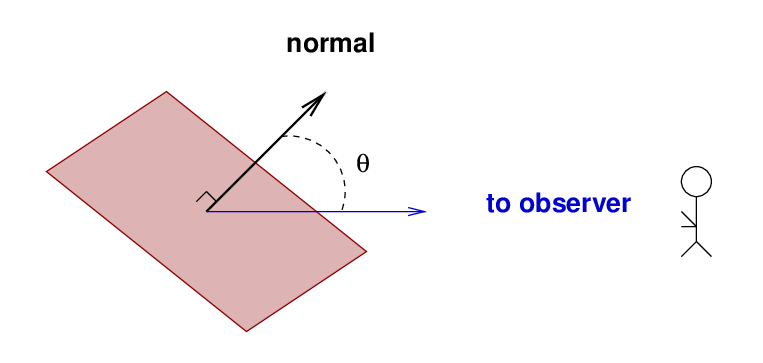
We choose this model for scattering because it's not a terrible description of rough surfaces, and because it's relatively easy to model. Real planets and asteroids in our Solar System tend to depart from this model, especially those with solid surfaces covered with small particles; see discussions of the opposition surge.
Now, with these assumptions, we can calculate how the brightness of the daylit portion of an exoplanet will change as a function of its phase angle. But the really big question is -- what will its maximum brightness be? In particular, how much fainter will it appear than its host star? This quantity -- the brightness of the planet relative to its host star -- is called the contrast, and the maximum value of the contrast can tell us whether it might be possible for some particular instrument to detect a planet.
We can compute the total amount of radiation reflected by a planet as a product of the flux from its host star, and the geometric cross section of the planet. Strictly speaking, we must include the albedo ...

However, this could be somewhat confusing. We are using symbols a to mean "semi-major axis of the planet's orbit" and α to mean "albedo". Fortunately, we're assuming that the albedo is α = 1. So, we'll just stop writing the albedo term from this point on.
This simple analysis yields one way way to write the maximum contrast of an exoplanet shining via reflected light:

An important point about reflection is that, at least in our simple model, photons which strike the planet bounce off without any change in wavelength. So, even though we've written equations in terms of luminosity L, which could involve the integration over a wide range of different wavelengths, they are just as correct if we consider any particular slice of spectrum: these equations relate the number of photons emitted by the star at any wavelength to the number reflected by the planet at that same wavelength.
It might be more useful to describe the intensity of light directed toward the Earth at some particular wavelength Iλ, which is what our instrument actually measure.

Note that there's no dependence on wavelength: under our model, the ratio between planet and star in reflected light will be exactly the same in the optical B band, or optical V band, or the near-IR K band, or whatever band one might choose.
Finally, there's one small correction we must make. If light scatters in a Lambertian manner off the surface of the planet, then there is a small amount of additional dilution that occurs, causing the reflected light to be a bit fainter than this naive calculation would indicate. The geometric albedo of a planet with Lambertian scattering turns out to be 2/3 of the naive value, and so we end up with an expression for the maximum contrast of an exoplanet at "full planet" phase like this:

The maximum contrast is set by a simple geometric factor, the fraction of all the star's photons that bounce off the planet. That's the meaning of the final term on the right-hand side.
For convenience, let's consider three particular scenarios, describing different types of exoplanet systems.
                          hot Jupiter       real Earth         habitable Earth
       Scenario:           around Sun       around Sun         around M5 dwarf
                             "A"               "B"                  "C"
-----------------------------------------------------------------------------------

 Planet radius (m)         7.15 x 10⁷       6.37 x 10⁶          6.37 x 10⁶

 Semi-major axis (m)       6.00 x 10⁹       1.50 x 10¹¹         8.78 x 10⁹

-----------------------------------------------------------------------------------

 Star radius (m)           6.96 x 10⁸       6.96 x 10⁸          1.37 x 10⁸

 Star temperature (K)        5800             5800                3173

-----------------------------------------------------------------------------------
For each of these systems, we can use the equations we've derived to compute the contrast of an exoplanet shining by reflected light as it moves around its host.
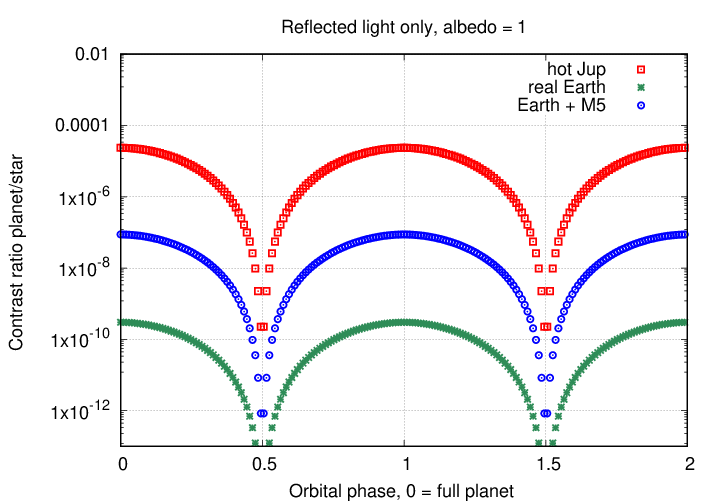
The results aren't surprising. The contrast of planets close to their host stars is typically much higher than those which have large orbits, and, other things being equal, large planets are brighter than small ones.
Note also how much brighter a planet will be when it is close to "full phase" than when it is close to "new phase:" the difference can be several orders of magnitude. In many cases, astronomers can expect to detect a planet's reflected light only when it is close to "full planet."
But even for favorable cases, such as a hot Jupiter (large planet, close to its host star), the maximum contrast is small ... very small. So small, in fact, that it can be very, very, VERY difficult to detect an exoplanet by reflected light. Let's see just how difficult it can be. I'll build a little simulation which computes the total light of the host star and the exoplanet together, varying as the planet moves around its orbit. If we normalize the measurements so that the star alone has an intensity of 1.0, then the combined light of star-plus-planet will have an intensity of
Intensity of star plus planet = 1 + contrast
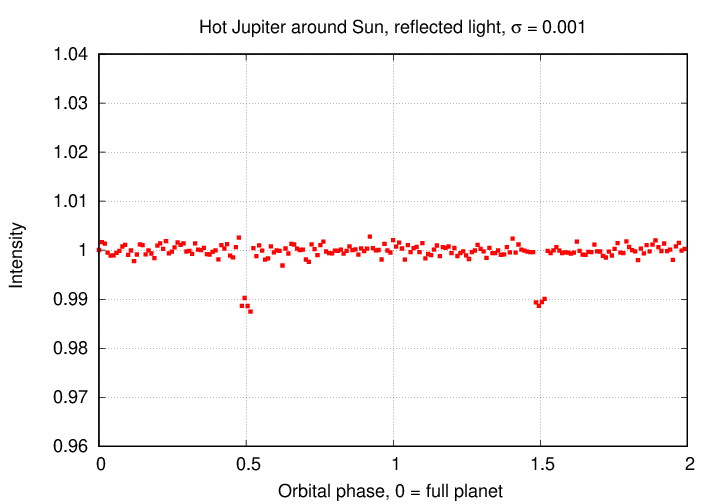
Suppose we use a telescope and camera and observing parameters which allow us to measure the brightness of a star with a precision of σ; that is, let the random scatter in photometric measurements have a fractional uncertainty of σ. It's pretty easy with modern digital detectors to make measurements with σ = 0.01 = 10-2. Here's the light curve produced by such a system:
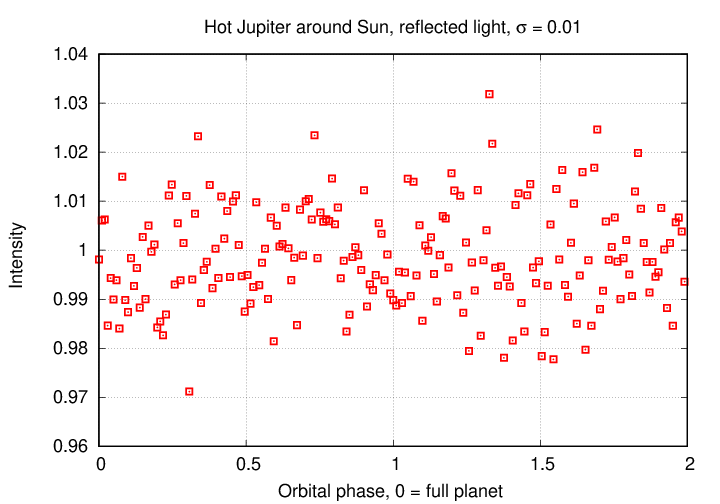
Q: Can you see the variations due to the planet's orbital motion?
I certainly can NOT see any variations; in fact, this dataset doesn't even show the transits.
If we increase the precision of our measurements by a factor of ten, then at least we can detect the transits. This level of precision, roughly one milli-magnitude, is typical of the best ground-based work.
By going into space, and using specially designed instruments, we can push the precision by another order of magnitude, to σ = 0.000 1 = 10-4. The graph below is zoomed in to show any variations outside of the transits more clearly.
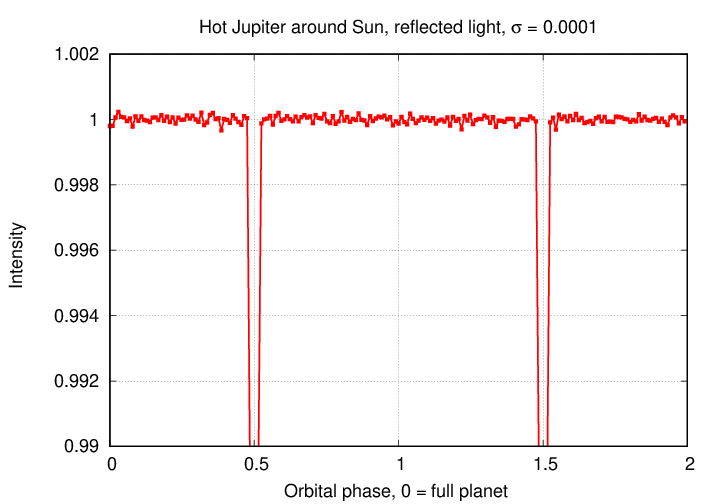
Q: Can you NOW see the variations due to the planet's orbital motion?
Hmmm. I can't.
If we increase the precision by another factor of ten, to σ = 0.000 01 = 10-5, then at last the expected variations with orbital phase start to appear. Note that we can start to see the secondary eclipse at phase = 1, when the planet passes behind the star. This is approximately the level of precision of measurements made by the CHEOPS satellite, specially designed to measure exoplanet transits.
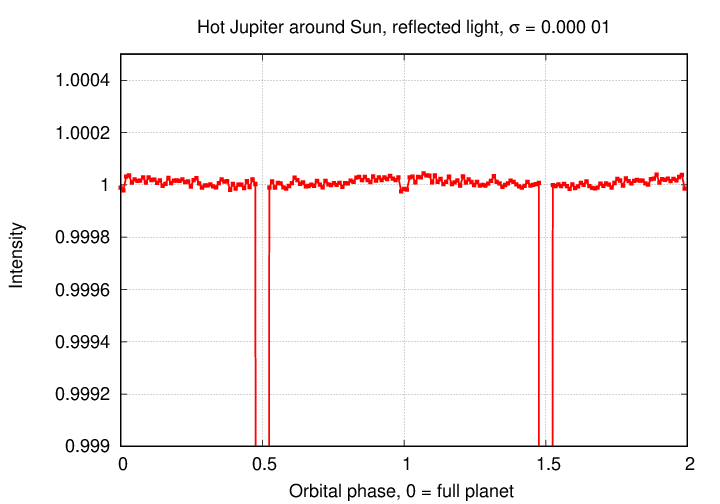
But in order to see them clearly, or to discover any variations from the expected pattern, we need to increase the precision by ANOTHER order of magnitude, to σ = 0.000 001 = 10-6. This is considerably beyond our current instruments, unfortunately.
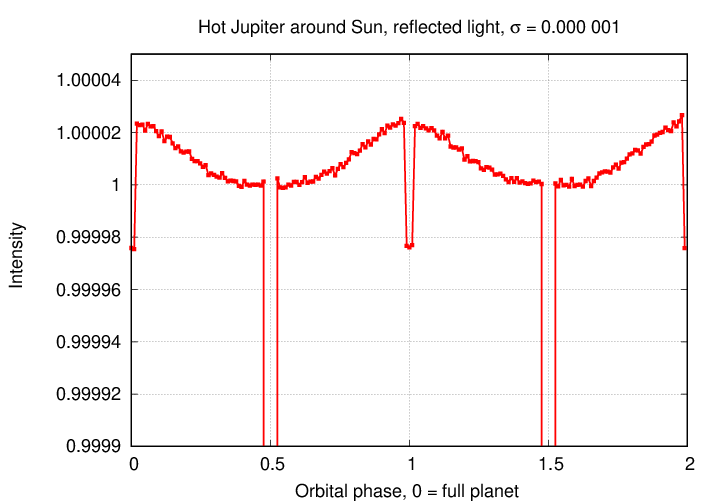
The situation in reflected light looks dim: the vast majority of exoplanets will reflect too little of their host star's light for us to detect them against the glare of the star. Rats.
But if we consider a different type of radiation, the situation becomes more favorable. Instead of looking at starlight which just bounces off the planet, let's ask what happens if that starlight strikes the planet's surface (or atmosphere) and is absorbed. The energy will heat up the planet, raising its temperature and causing it to emit radiation via the thermal blackbody process.
Since most exoplanets will emit the bulk of their thermal radiation in the near-infrared, this means that optical telescopes are the wrong tool for this job. We must turn to telescopes and instruments designed to work in the near-IR, at wavelengths of, typically, 1 to 10 microns.
Q: What's so special about the region between 1 and 10 microns?
Both reflection and thermal emission are driven by starlight which strikes the planet, but there's a crucial difference: for thermal emission, the star's photons are absorbed by the planet, and a new set of photons, with a different distribution of wavelengths, are radiated by the planet. If we observe at the proper wavelengths, we can exploit this re-distribution of photons to INCREASE DRASTICALLY the contrast between planet and star.
Let's see how it works. We begin in the usual manner, by balancing the energy of starlight absorbed by the planet to the energy of its thermal emission. For simplicity's sake, I'll assume that both planet and star are perfect blackbodies, and so neglect factors such as albedo and emissivity.

Now, if we were to compute the maximum contrast in bolometric terms, that is, the ratio of the total energy emitted at all wavelengths by the planet to the total energy emitted at all wavelengths by the star, we'd end up with the same sort of expression we found for reflected light: one in which the contrast simply depends on the ratio (squared) of the planet's size to the orbit's size.
But let's do something different. First, we'll calculate an expression for the temperature of the planet, relative to the temperatue of the star. Once again assuming that the star is a perfect blackbody, we have

   Q:   Can you derive an expression for the temperature of the planet
             relative to the temperature of the star?
You should find

The next step is to consider the spectrum of blackbody radiation emitted by objects of different temperatures. The blackbody spectrum has a distinctive shape, with a sharp rise from short wavelengths to a peak, then a relatively gradual decrease at long wavelengths. For the star and planet in our scenario "A", for example, the hotter star clearly emits more energy -- and more photons -- at every wavelength than the cooler planet, from every square meter of its surface.
(If we included the larger surface area of the star, the star would dominate by even larger factors)
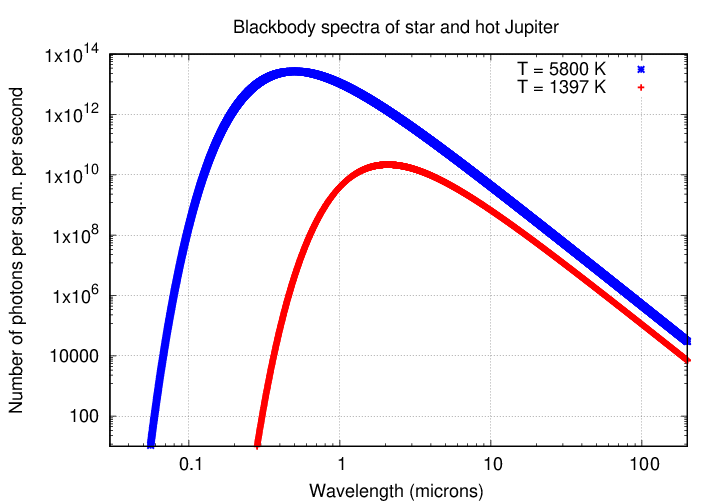
However, the RATIO of the number of photons emitted per unit area changes with wavelength. At visible wavelengths, around 0.5 microns, the star's emission exceeds that of the planet by many orders of magnitude. At long wavelengths, however, around 10 or 30 microns, the ratio is much smaller.
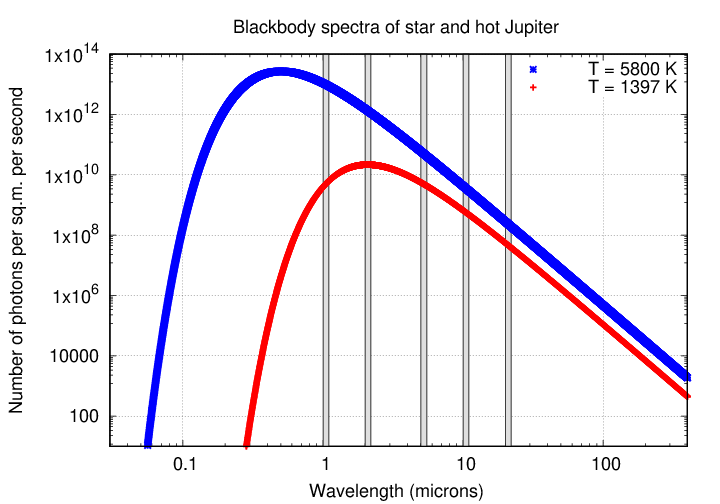
Let's do a bit of quantitative estimation. For convenience, we can use the symbol Ψ to mean "the number of photons emitted per second within some narrow range of wavelengths from one square meter of area."
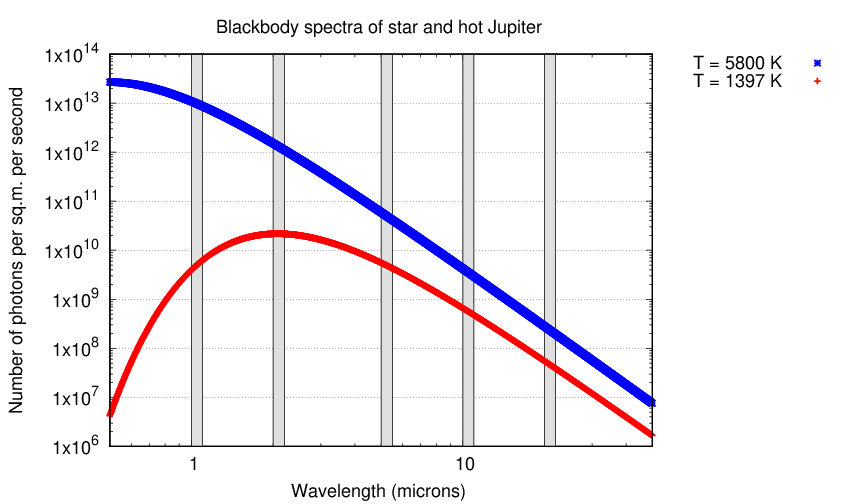
   Q:  What is the ratio of photons emitted per second per square meter
              by the star (ΨS) to the number emitted by the planet (ΨP)?


          wavelength                ratio (star / planet)
       -----------------------------------------------------
             1  micron

             2

             5

            10

            20
       -----------------------------------------------------
As one can see, the ratio of stellar to planetary emission over a narrow band changes dramatically. When the wavelength in question is "long" -- longer than the peak wavelength of either body's spectrum, along what's called the Rayleigh-Jeans tail of the spectrum -- this ratio approaches a fixed value: the ratio of the temperature of the star to that of the planet. In this case, that ratio is (5800 / 1397) ≈ 4.
In other words, when we consider thermal emission at long wavelengths, the ratio of the light emitted in a narrow band band from each square meter of a planet to that emitted in the same band from each square meter of its host star should be linearly related to the ratio of the temperature of the planet to the temperature of its host star.
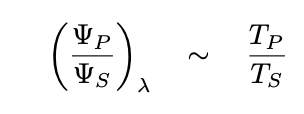
Now we can put it all together, and write an expression for the maximum contrast of an exoplanet (during "full planet" phase) relative to its host star, if both are emitting thermal radiation, and we observe in the Rayleigh-Jeans tail.
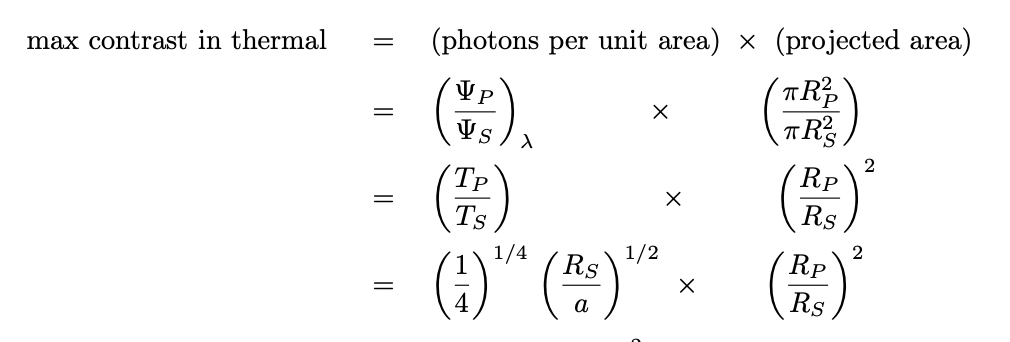
If we compare this expression for maximum contrast via thermal radiation with our earlier expression for maximum contrast in reflected light, we see some key differences.

Since the orbit a is usually much larger than the star RS, and the star RS much larger than the planet RP, the first term for reflection is much (often much, much) smaller than that for thermal emission. It's true that thermal emission has a second factor which will be smaller than one ... but since that ratio of sizes is raised to the one-half power, rather than to the second power, it has only a minor effect.
In fact, our simplified model makes a prediction for the ratio of thermal contrast to contrast in reflection:

A simple model of thermal emission from an exoplanet would suggest that the temperature of the planet's surface (or atmosphere) should be highest at the sub-stellar point: the location on the planet at which the host star is directly overhead. In the diagrams below, this peak temperature is indicated by a red dot.

In this case, the amount of light emitted by the planet as it moves behind the star during a secondary eclipse will be the same on both sides of the event. We would expect a symmetric light curve around the small dip.
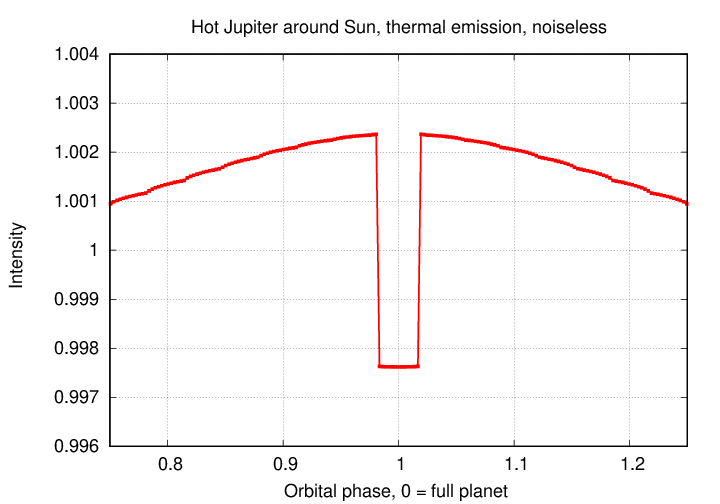
On the other hand, suppose that there is some offset between the sub-stellar point and the location of highest temperature -- as there is on the Earth.
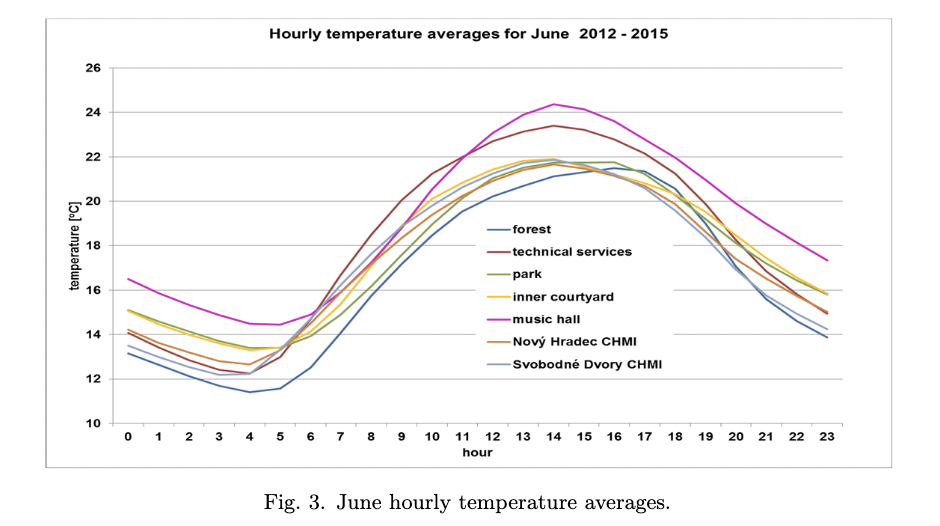
Figure 3 taken from
Microclimate Evaluation of the Hradec Krávéity using HUMIDEX
by Roznovsky et al., Contributions to Geophysics and Geodesy, 47(3),
Sept. 2017
Q: Why do the highest temperatures typically occur after noon?
In that case, the maximum thermal emission will not be the same just before and just after secondary eclipse. In the example below, the planet is orbiting from right to left (counter-clockwise as seen from above); it is also rotating in the same direction, counter-clockwise as seen from above. We call this prograde rotation. The "hot spot" is located in the equivalent of our afternoons, offset by some angular distance from the sub-stellar point.

Since the hot spot points more directly to Earth just before the eclipse, and further away from Earth just after the eclipse, our measurements of this system's thermal emission would show a higher intensity before secondary eclipse, and lower intensity afterward.
Note the promise that this technique holds: by measuring a light curve -- just a light curve -- we might be able to start making a crude map of an exoplanet's disk. Such a map won't be exactly like an ordinary map of the Earth, since it shows thermal emission rather than the usual optical reflection, but it's still a map. The spatial resolution is likely to be very poor -- probably just a few blobs across the entire disk -- but, again, it's a map.
Using ordinary optics to resolve the disk of an exoplanet, in order to image its surface properties directly, is much, much, much more difficult.
One of the exoplanets showing strongest evidence for asymmetric surface properties is the hot Jupiter WASP-43b. This planet is roughly the size of Jupiter, but about twice its mass. It orbits its K7 host at a distance of just 0.15 AU, and so is very hot: its equilibrium temperature is around 1400 K.
The system has been studied in the near-IR by both the Spitzer telescope, at 3.6 and 4.5 microns (Stevenson et al. 2017), and by JWST at wavelengths between 2.65 and 5.17 microns (Challener et al. 2024, Hammond et al. 2024). All groups collected data over the course of an entire orbit, allowing them to generate "full-phase light curves". See the references at the end of this lecture.
The Spitzer measurements show the expected pattern of a deep transit and shallow secondary eclipses. The graph below shows the 4.5-micron Spitzer light curve, covering two secondary eclipses.

Figure 2, lower panel,
from
by Stevenson, K. B., et al., AJ 153, 68 (2017)
  Q:  Do you see any evidence of asymmetric thermal emission
             from the "surface" of the exoplanet in this light curve?
Yes, indeed. The planet's contribution just before the secondary eclipse is considerably larger than just after the secondary eclipse, indicating that the "hot spot" of the planet's atmosphere/surface is offset slightly from the sub-stellar point.
Stevenson et al. use their measurements to create a map of the temperature of the planet, based upon its thermal emission.
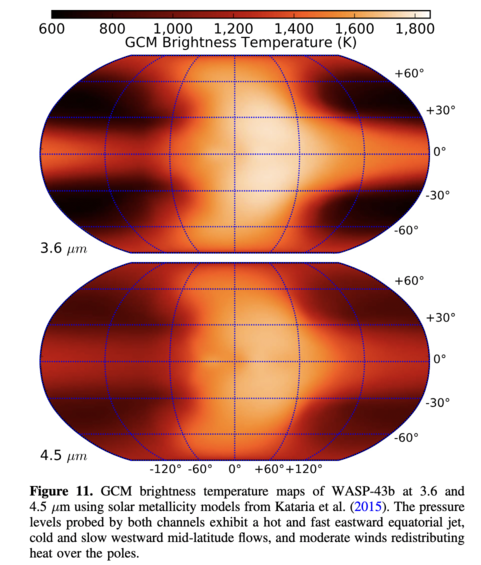
Figure 11
from
by Stevenson, K. B., et al., AJ 153, 68 (2017)
  Q:  Roughly how large (in degrees) is the offset in longitude
            between the sub-stellar point and the "hot spot"?
Note also that the Spitzer observations detect considerably more than zero thermal emission from the night side of the planet; this indicates that heat is being transferred from day side to night side by some mechanism, and/or might be evidence for rapid rotation (so that not all energy deposited during the day can be radiated away before the end of the night).
In 2023, the James Webb Space Telescope observed the WASP-43 system again, using the NRS1 and NRS2 detectors, over the wavelength range 2.65 to 5.17 microns. JWST stared at the system for over 28 continuous hours, allowing it to capture one secondary eclipse, a transit, and the successive secondary eclipse. Combining the data from all wavelengths yields a "white-light" curve with fractional uncertainties per measurement of roughly 10-4 = 0.0001.
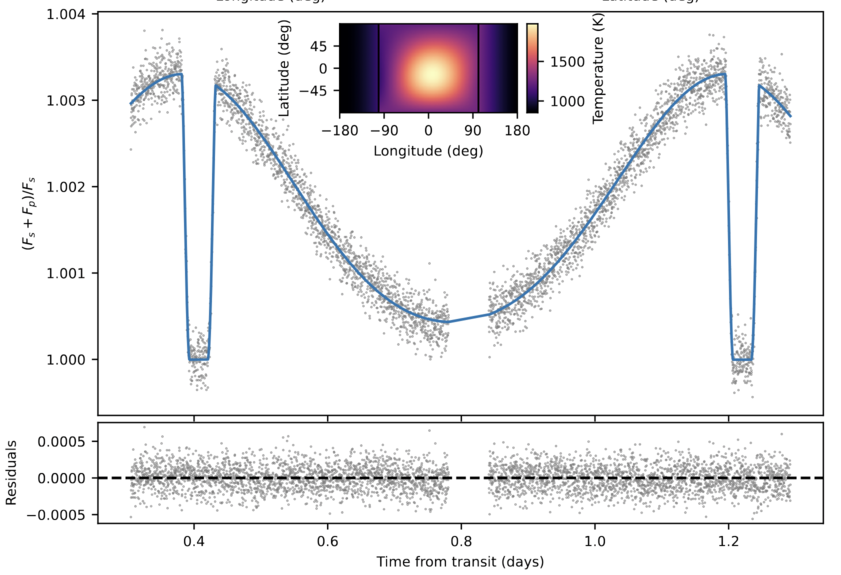
Figure 3, lower panel, taken from
by Challener, R. C., et al., arXiv 2406.10207 (2024)
  Q:  Does this light curve show evidence for an asymmetric pattern
             of thermal emission from the planet?
In this case, we see two different indications of an offset in the planet's thermal emission from the sub-stellar point:
Based on this light curve, the authors deduce that the pattern of thermal emission is offset from the basic model in longitude, as the Spitzer observations suggested: the "afternoon" side of the planet emits more strongly than the "morning" side. The JWST observations indicate a slightly smaller offset than the earlier Spitzer ones, about 7 degrees to the east of the substellar point.
But Challener et al. also find an offset in LATITUDE: in their model the hot spot lies to the south of the planet's equator.
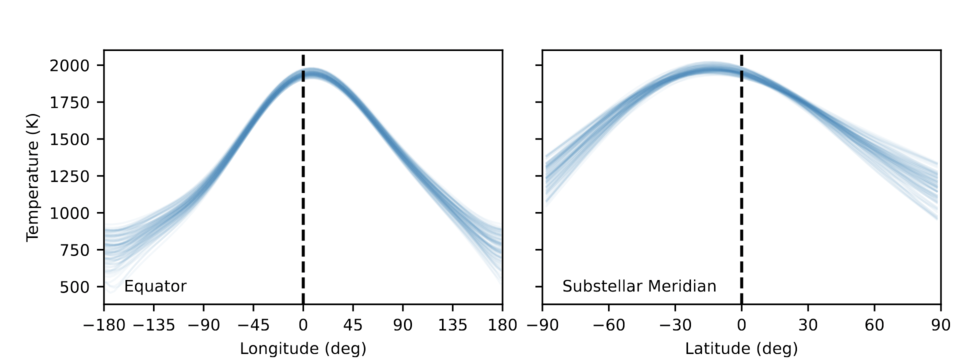
Figure 3, upper panel, taken from
by Challener, R. C., et al., arXiv 2406.10207 (2024)
When they create a model of the planet's thermal emission from a series of spherical-harmonic "eigenmaps," they must include one component (Eigenmap 6) that depends on the latitude in order to generate a light curve matching the observations.
No, I don't know why Eigenmap 6 has a higher temperature north of the equator, but the models shown in other figures and described in the text state that the hot spot is south of the equator.
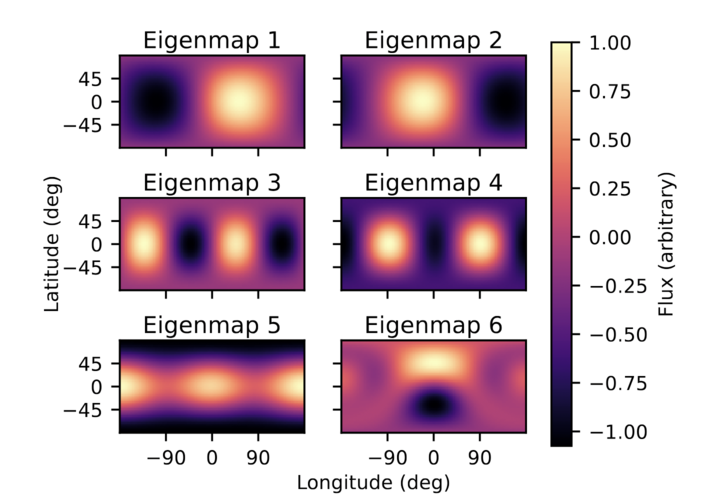
Figure 2 taken from
by Challener, R. C., et al., arXiv 2406.10207 (2024)
When we measure the light curve of an exoplanet system over a full orbit, we see changes over time; around the secondary eclipses, we watch as the planet moves (in conventional diagrams) "horizontally" behind the star, from right to left. Since time is simply related to the "east-west", or "longitude", location of features on a planet's disk, it's easy to see how precise measurements of the light curve can tell us about any longitude-dependent features on the planet's disk.
But how can a simple light curve detect features on a planet's surface/atmosphere which depend on the LATITUDE?
Q: What allows us to see LATITUDE-dependent features in a light curve?
The key is a non-zero inclination of the orbit. If the inclination is zero, then the planet will pass directly behind the middle of the star; there will be no difference between features created by hot (or cold) spots above or below the planet's equator. But if the inclination is larger than zero, so that the planet passes behind the star significantly above (or below) the star's equator, the northern (or southern) hemisphere of the planet will be more (or less) covered during the partial phases of the secondary eclipse.
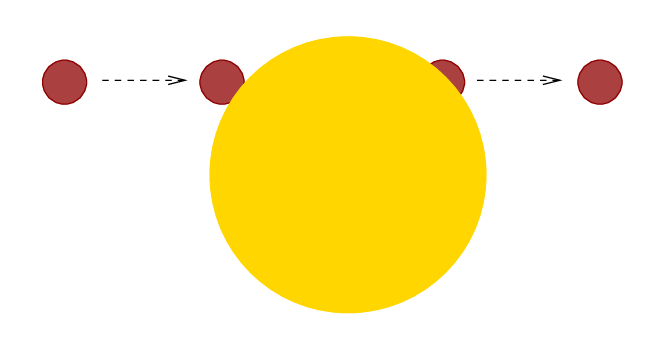
The figure above is drawn to show objects in the WASP-43b system to the proper scale, using values drawn from the NASA exoplanet archive. Notice how the southern hemisphere is covered a bit earlier during ingress, and uncovered a bit later during egress.
Challener et al.'s thermal map of WASP-43b roughly matches that of Hammond et al. (2024), who analyze the same set of JWST observations. Their light curve looks very similar to that of Challener et al. (a good sign).

Figure 1 taken from
by Hammond, M., et al., AJ 168, 4 (2024)
Their Figure 2 zooms in on the measurements just before and just after the secondary eclipse, showing how important it is to include a latitude-dependent offset in order to reproduce the measurements.

Figure 2 taken from
by Hammond, M., et al., AJ 168, 4 (2024)
  Q:  How precise must the measurements be in order to distinguish
           between the "M2: Longitude-Only Map" (red regions) and
           the "M3: Latitude-Longitude Map" (blue regions)?

           Express your answer in parts-per-million (ppm), and
           in fractional uncertainty.
 Copyright © Michael Richmond.
This work is licensed under a Creative Commons License.